Performance Modeling of Web-based Software Systems with Subspace Identification
Ágnes Bogárdi-Mészöly, András Rövid, Shohei Yokoyama
Department of Automation and Applied Informatics, Budapest University of Technology and Economics, Magyar tudósok krt. 2, 1117 Budapest, Hungary Institute of Applied Mathematics, Óbuda University, Bécsi út 96/B, 1034 Budapest, Hungary
Department of Computer Science, Shizuoka University, Hamamatsu Campus, Shizuoka ken, Hamamatsu shi, Naka ku, Jouhoku 3-5-1, 432 8011, Japan agi@aut.bme.hu, rovid.andras@nik.uni-obuda.hu, yokoyama@inf.shizuoka.ac.jp
Abstract: Performance modeling and prediction of web-based software systems are important and complicated considerations. The goal of our paper is to establish proper mathematical models in the form of difference equations, by subspace identification, in order to model and predict the performance of web-based software systems. First, simulation models have been provided to simulate the behavior of thread pool and queued requests. Second, analytical models have been proposed in form of state space models using subspace identification. In addition, it has been demonstrated that the proposed models can be applied to performance prediction of web-based software systems. The proposed models have been validated and verified. Furthermore, performance factor identification and performance prediction techniques have been proposed based on subspace identification.
Keywords: web-based software system; subspace identification; performance modeling;
performance factor identification; performance prediction
1 Introduction
Web-based software systems are client-server software applications, in which, clients run in web browsers. Because they serve a large number of users, their performance and efficiency have become of key importance. Their architecture and runtime environment mainly diverge from the previous concepts. Their performance modeling and prediction are active research fields.
Performance evaluation is significant at every stage of the development process.
There are three main techniques for performance evaluation: analytical modeling, simulation, and measurement [1].
Web-based software systems access some resources while executing the requests of the clients. Typically, several requests arrive at the same time, thus, a competitive situation is established for the resources. For modeling such situations, queueing model-based approaches are widely used [1] [2] [3].
In our previous work [4] [5] [6], statistical methods have been provided in order to identify and investigate novel performance factors as well as queueing network models and evaluation algorithms have been proposed to model the identified dominant thread pool and queue limit performance factors.
In this work [7] [8], a different approach is investigated for modeling the behavior of thread pool and queued requests, state space models are provided using subspace identification, in order to model and predict the performance.
The paper is organized as follows: Section 2 covers the background and related work. Section 3 presents the contribution, namely, simulation models, state space models, performance prediction, error analysis, and propositions. Finally, the last section reports the conclusions.
2 Background and Related Work
This section is devoted to review the background and research efforts related to this work, namely, the concept of thread pool and queued requests, the used SimEvents Toolbox of MATLAB Simulink, and the applied subspace identification method.
2.1 Concept of Thread Pool and Queued Requests
In the case of using a thread pool depicted in Fig. 1, when a request arrives, the application adds it to an incoming queue [9]. A group of threads retrieves requests from this queue and processes them. As each thread is freed, another request is executed from the queue.
The architecture of ASP.NET environment [5] [10] can be seen in Fig. 2. If a client is requesting a service from the server, the request goes through several subsystems before it is served. From the Internet Information Services (IIS), the requests are placed into the named pipe, which is a global queue between IIS and ASP.NET, its limit is set by the requestQueueLimit property. From the named pipe, the requests are placed into an application queue, which is used to maintain the availability of worker and I/O threads, its limit is configured by the appRequestQueueLimit property. When the limit is exceeded, the requests are rejected.
Figure 1
Thread pool and queued requests
Figure 2
Architecture of ASP.NET environment
2.2 MATLAB Simulink SimEvents
MATLAB Simulink is used for modeling, simulation, and analysis of dynamic systems. Simulink is designed for time-based simulation, while SimEvents [11] is aimed for event-based simulation. SimEvents extends Simulink behavior with a discrete-event simulation model of computation.
In SimEvents models, during a simulation, entities can pass through a network of queues, servers, switches, etc. Entities can carry data as attributes. Events can change state variables, outputs, occurrences of other events, for example, an entity advances from one block to another, and the service of an entity is completed in a server. Entities can wait in a queue; its capacity limits the simultaneous number of entities in the queue. Servers can serve entities in service time of given distribution; simultaneous number of entities can be finite or infinite. Entities can be routed from/to the selected input/output port using input/output switches.
Multiple paths can be merged into a single path using path combiners.
2.3 Subspace Identification
Definition 1. The state space representation of a deterministic, discrete time, linear, time invariant system is defined by the following difference equations:
, +
= k k
k+ Ax Bu
x 1 (1)
k,
k
k=Cx+Du
y (2)
where xk represents the state vector, uk is the input vector, and ykis the output vector at time k as well as A is the state matrix, B is the input matrix, C is the output matrix, and D is the feedthrough matrix.
The aim is to determine system matrices A, B, C, D from input-output data by subspace identification. The main thoughts of subspace identification algorithm are demonstrated as follows [12]. Input and output block Hankel matrices (U1i,Y1i) are constructed reflecting the history of input-output data. State sequence (Xi) plays an important role in derivation and interpretation.
1 1
1 3
2 2 1
1
j i i
i
j j
i
u u
u
u u
u
u u
u U
,
1 1
1 3
2 2 1
1
j i i
i
j j
i
y y
y
y y
y
y y
y Y
(3)
1 1
i i i j
i x x x
X (4)
State and output equations can be written using extended version of controllability (Δi) and observability (Γi) matrices as well as lower block triangular Toeplitz matrix (Hi). In geometrical interpretation, output is in the vector space determined by the union of state and input row spaces, state sequence can be estimated by projection of output row space onto orthogonal complement of input row space. Rank can be determined using singular value decomposition.
i1 i
CA CA
C
Γ , Δi
Ai1B AB B
(5)
B CA B CA B D
CA
D CB
CAB D CB
D
H
4 3
2
0 0 0
0 0
0
i i
i
i (6)
i i i
i1 AX1 ΔU1
X , Y1i ΓiX1HiU1i (7) System matrices can be estimated in least squares sense from the following equations:
i i i
i
U X D C
B A Y X 1
(8) Subspace identification has been successfully applied in various application fields, also together with queueing models [13].
3 Performance Modeling
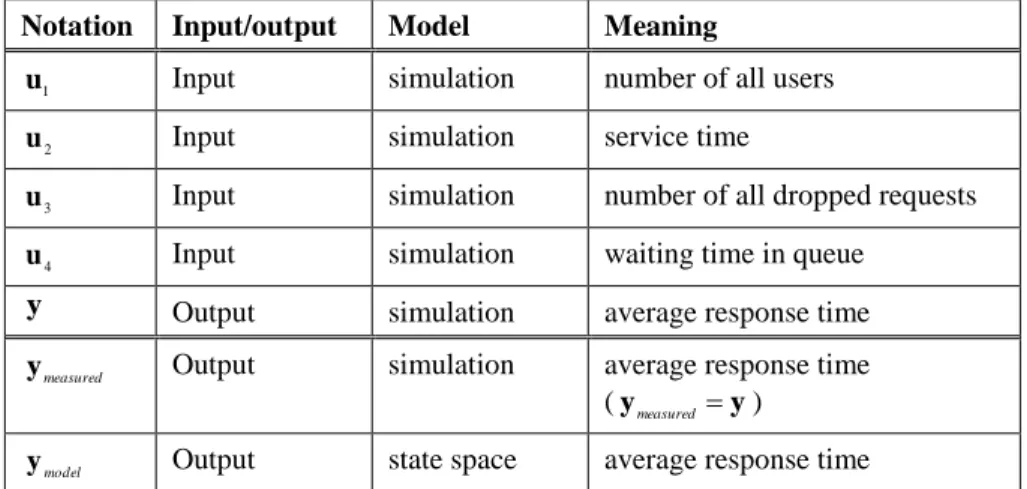
The main contribution of this paper is to establish state space models using subspace identification method in order to model and predict the performance of web-based software systems. Table 1 summarizes the notations used in provided models.
Table 1 Notations of models
Notation Input/output Model Meaning
u1 Input simulation number of all users
u2 Input simulation service time
u3 Input simulation number of all dropped requests
u4 Input simulation waiting time in queue
y Output simulation average response time
measured
y Output simulation average response time
(ymeasured y)
model
y Output state space average response time
3.1 Simulation Models
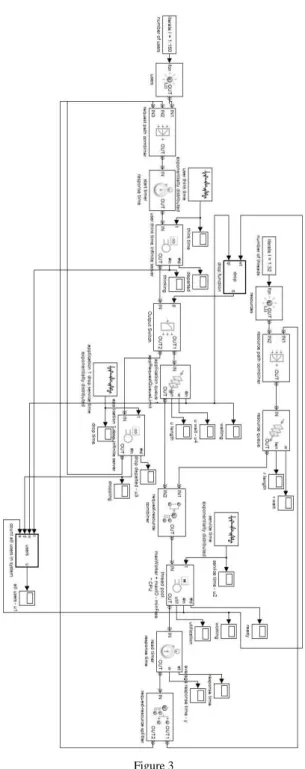
Firstly, for modeling thread pool and queue limit, simulation models (Fig. 3) have been provided using SimEvents of MATLAB Simulink in order to simulate the thread pool and queued requests behavior as well as to obtain input-output data for subspace identification method. Results of other simulation models or measurements can also be used as input-output data.
Figure 3 Simulation model
SimEvents models have been designed according to the concept of thread pool and queued requests (see in Section 2.1) as well as the available SimEvents blocks (see in Section 2.2).
Users (requests) and working threads (resources) have been generated by time- and event-based entity generators, combined by entity combiners, split by entity splitters. Feedbacks have been realized by path combiners. Response time has been monitored using start and read timers.
Application and global queues and their limits have been represented by queues and their capacities. User think time and dropping requests have been modeled as infinite server, thread pool as N-server with exponentially distributed think-, drop- and service time. Dropping method has been implemented by output switch and embedded function of its switching criteria according to appRequestQueueLimit and requestQueueLimit properties.
Simulation models have been provided for a given number of users and increasing number of users. Simulation has been performed over time using lower and higher queue limits. Simulation results are depicted in Fig. 4.
In case of a higher queue limit (5000), all requests can be served; there are no dropped requests (2nd and 4th rows). In case of a lower queue limit (100), some requests are rejected, dropped (1st and 3rd rows).
For a given number of users (150), the number of users in the system is fixed; the average response time tends to a steady value (1st and 2nd rows). For increasing number of users (from 0 to around 1700), the number of users is increasing, in case of a lower queue limit, the same number of users can be served, increasing number of dropped requests causes some slightly increasing overhead in response time (3rd row), however, in case of a higher queue limit, all requests can be served, response time is increasing linearly (4th row).
3.2 State Space Models
Secondly, analytical models in form of state space models using subspace identification have been provided examining various input factors and their effects to each other.
For provided simulation models subspace identification method has been applied and implemented in MATLAB. We would like to model and predict the performance, hence a performance metric has been chosen as output like average response time, and various performance factor candidates have been investigated as inputs like number of all users (u1), service time (u2), number of all dropped requests (u3), waiting time in queue (u4).
Figure 4
Simulation results (left column: u3, right column: y)
The relationship between the above mentioned metric and the factor candidates, has been modeled by subspace identification (see Fig. 5). In case of input u2 the relationship is weak, since the service time is exponentially distributed. In case of inputs u1 and u3 the relationship is moderately strong (1st row). In case of input u4 the relationship is extremely strong (bottom right corner). Furthermore, combining inputs u1 and u3 – whose individual relationship to output is only moderately strong – the relationship between combined inputs u1,3 and output is stronger (bottom left corner).
Figure 5
Relationship between input factors and output metric y in case of increasing number of users using lower queue limit
The system matrices of the state space model in case of the strongest relationship, namely, in case of input u4 using lower queue limit for increasing number of users are shown in Fig. 6. Since in this case the system has only one input and one output, B is a column vector, C is a row vector, D is a constant. As the model order 4 was chosen reflecting the best setting.
The detailed results in case of the strongest relationship, namely, in case of input u4 are depicted in Fig. 7 using lower and higher queue limits for a given and increasing numbers of users. The relationship is extremely strong in all cases.
The proposed method has been validated, and its correctness has been verified by comparing the results of simulation (ymeasured) and analytical models (ymodel) depicted in Figs. 5 and 7.
A 0.78953 0.27977 0.47337 -0.033463
-0.80127 0.34866 0.23873 0.13293 0.28777 -0.78382 -0.18142 0.089506 -0.39018 0.74561 -1.0258 0.086449
B -0.54887
0.84371 1.4622 -2.5302
C 4.8106 -0.28536 2.2575 -0.25992
D 0
Figure 6
System matrices in case of input factor u4 and output metric y for increasing number of users using lower queue limit
Figure 7
Relationship between input factor u4 and output metric y
3.3 Performance Prediction
In addition, it has been demonstrated that the proposed method can be applied to performance prediction of web-based software systems. The state space model has been determined based on only the first half of the simulated data. For the second half it has been predicted by the proposed state space model.
The results in case of input u4 are depicted in Fig. 8. The relationship is extremely strong in all cases. The performance prediction facility has been validated and verified, by comparing the results of simulation (ymeasured) and analytical models (ymodel). The relationship without and with prediction has around the same strength comparing the results shown in Figs. 7 and 8.
Figure 8
Relationship between input factor u4 and output metric y with prediction
3.4 Error Analysis
Error analysis has been performed by examining goodness of fit, firstly using lower and higher queue limits for a given and increasing number of users (without prediction), secondly comparing the results without and with prediction.
The model and measured outputs have been compared by the NRMSE (Normalized Root Mean Square Error) fitness value, namely, the goodness of fit.
Definition 2. The goodness of fit is defined as follows where norm stands for L2 norm, and the associated notations are in Table 1.
)) 100 (
(
)
1 ( mod
measured measured
el measured
mean norm
norm
y y
y
y (9)
The results (without prediction) are presented in Table 2. Recall that for input u2 the relationship is weak. In case of a higher queue limit, when there are no dropped requests, for input u3 the relationship is weak. In case of a lower queue limit, when some requests are dropped, for input u3 the relationship is moderately strong. For input u1 the relationship is (moderately) strong. For input u4 the relationship is extremely strong.
Furthermore, combining inputs, whose individual relationship to output is only moderately strong, the relationship between combined inputs u1,3and output is stronger.
Column “Increasing number of users” ”Queue limit” “100” corresponds to Fig. 5, row “u4” to Fig. 7.
Table 2
Goodness of fit in percentages for different inputs (without prediction)
Input
Increasing number of users Given number of users Queue limit
100 5000 100 5000
u1 67.39 95.74 81 80.41
u2 - - - -
u3 69.87 - 55.79 -
u4 96.71 98.16 89.21 92.76
3 ,
u1 85.35 95.01 86.4 83.32
The relationship without and with prediction is extremely strong in all cases, and it has around the same strength comparing the results of goodness of fit shown in Table 3. Column “Without prediction” corresponds to Fig. 7, while column “With prediction” to Fig. 8.
Table 3
Goodness of fit in percentages for input u4 without and with prediction
Without prediction With prediction Increasing
number of users
Queue limit 100 96.71 96.73
5000 98.16 97.54
Given number of users
100 89.21 88.35
5000 92.76 92.72
3.5 Propositions
To summarize, we can say that the subspace identification method can be applied to performance factor identification and performance prediction.
Proposition 1. The subspace identification method can be applied to performance factor identification.
It is shown the way in which the subspace identification method can be applied to identifying performance factors. The input is one (or more) performance factor candidate(s). The output is one (or more) performance metric(s).
The relationship between the factor candidate and the metric is modeled by subspace identification. If the relationship cannot be calculated, in other words, weak, then it is not a performance factor. If the relationship can be calculated, the goodness of fit in percentages is high, the performance factor candidate influences the performance, namely, a novel performance factor is identified.
The related experimental results are demonstrated in Sections 3.2 and 3.4.
Proposition 2. The subspace identification method can be used for performance prediction.
It is shown the way in which the subspace identification method can be applied to predicting performance. The input is one (or more) identified performance factor(s) by Proposition 1. The output is one (or more) performance metric(s).
The relationship between the factor candidate and the metric is modeled by subspace identification. The state space model is determined based on only the first part of the measured or simulated data. The other part is predicted by the provided state space model.
The related experimental results are shown in Sections 3.3 and 3.4.
Conclusions
Recently, web-based software systems have proliferated. Their performance modeling and prediction are relevant issues. In this work, proper mathematical models have been established in form of difference equations by subspace identification in order to model and predict their performance.
First, simulation models have been provided using SimEvents of MATLAB Simulink to simulate the thread pool and queued requests behavior of web-based software systems as well as to obtain input-output data for subspace identification method. Second, analytical models in form of state space models using subspace identification have been provided investigating various input factors and their effects to each other. In addition, it has been shown that the proposed method can be applied to performance prediction of web-based software systems. The proposed models have been validated and their correctness has been verified by comparing the results of simulation and analytical models, as well as, by error analysis. Above all, performance factor identification and performance prediction techniques have been proposed based on subspace identification.
Acknowledgement
This work is supported by the Japan Society for Promotion of Science Postdoctoral Fellowship (26・04765).
References
[1] R. Jain: The Art of Computer Systems Performance Analysis, John Wiley and Sons, 1991
[2] T.G. Robertazzi: Computer Networks and Systems: Queueing Theory and Performance Evaluation, Springer, Cambridge, 2000
[3] B. Urgaonkar, G. Pacifici, P. Shenoy, M. Spreitzer, A. Tantawi: An Analytical Model for Multi-tier Internet Services and its Applications, ACM SIGMETRICS Performance Evaluation Review, 2005, Vol. 33, No.
1, pp. 291-302
[4] Á. Bogárdi-Mészöly, Z. Szitás, T. Levendovszky, H. Charaf: Investigating Factors Influencing the Response Time in ASP.NET Web Applications, Lecture Notes in Computer Science, Springer, 2005, Vol. 3746, pp. 223- 233
[5] Á. Bogárdi-Mészöly: Improved Performance Models for Web-based Software Systems, Modeling Thread Pool and Queue Limit Performance Factors, Lambert Academic Publishing, Saarbrücken, 2010, 132 p.
[6] Á. Bogárdi-Mészöly, T. Levendovszky: A Novel Algorithm for Performance Prediction of Web-based Software Systems, Performance Evaluation, Elsevier, 2011, Vol. 68, No. 1, pp. 45-57
[7] Á. Bogárdi-Mészöly, A. Rövid, S. Yokoyama: Subspace Identification for Web-based Software Systems, International Conference on Engineering and Applied Science, Japan, Sapporo, July 20-22, 2015, pp. 119-127 [8] Á. Bogárdi-Mészöly, A. Rövid, S. Yokoyama: Performance Prediction of
Web-based Software Systems with Subspace Identification, International Scientific Conference on Engineering and Applied Sciences, Japan, Naha, July 29-31, 2015, pp. 89-98
[9] D. Carmona: Programming the Thread Pool in the .NET Framework, in .NET Development (General) Technical Articles, Microsoft Spain, 2002, http://msdn.microsoft.com/en-us/library/ms973903.aspx
[10] T. Marquardt: ASP.NET Performance Monitoring, and When to Alert Administrators, in ASP.NET Technical Articles, 2003, http://msdn.microsoft.com/en-us/library/ms972959.aspx
[11] SimEvents, MATLAB, MathWorks, http://www.mathworks.com/help/simevents/
[12] P. Overschee, B. Moor, Subspace Identification for Linear Systems: Theory – Implementation – Applications, Kluwer Academic Publishers, 2011 [13] P. Várlaki, T. Vadvári, Queueing Models and Subspace Identification in
Logistics, Acta Technica Jaurinensis, 2014, Vol. 8, No. 1, pp. 63-76