SIXTH SYMPOSIUM ON BALLISTIC MISSILE AND AEROSPACE TECHNOLOGY
N U C L E A R R O C K E T E N G I N E A F T E R H E A T R E M O V A L R. D . Leonard
Allison Division, G M C Research Department Indianapolis 6, Indiana
Abstract
An analysis of the open cycle technique for the removal of afterheat from a nuclear rocket engine is presented be
cause of its application to early space vehicles.
The W a y - W i g n e r equation for the generation of beta and gamma particles is used with an expression for the at
tenuation of delayed neutrons for afterheat prediction.
Coolant flow for afterheat removal is determined as a func
tion of system temperature rise and is established for typi
cal nuclear rocket operating times.
It is concluded that when engine system temperatures during shutdown are low, coolant losses charged to afterheat removal will have a significant effect upon payload.
Introduction
Heat is generated in a nuclear rocket engine during shutdown due to the decay of fission products. This heat must be removed in a manner which prevents engine system damage if later restart is required or if recovery for exami
nation or reuse is to be attempted, A technique for ade
quately removing afterheat is analyzed in this paper and payload penalties which will be encountered due to afterheat removal are evaluated. The analysis is directed toward flight applications because of current interest in this topic;
however, the technique is applicable to ground-based sys
tems as well.
Nomenclature
A Wetted area in. 2
c Average specific heat of "heat sink" b / l b - ° F
CP Average specific heat of coolant b / l b - ° F D Step change in reactivity
$
m Weight of "heat sink1 1 lb
Ρ Reactor power b/ sec or mw
Q Total heat b or mw sec
t Time sec
Τ Coolant temperature ° R
Tw Reactor wall surface temperature ° R w M a s s flow rate l b / s e c V Equivalent one group delayed neutron
fraction non-dim
η Heat transfer effectiveness non-dim Subscripts:
f Final i Initial
ο Reactor operation s Reactor shutdown t Total
1 Reactor inlet 2 Reactor exit
Rocket Reactor Model
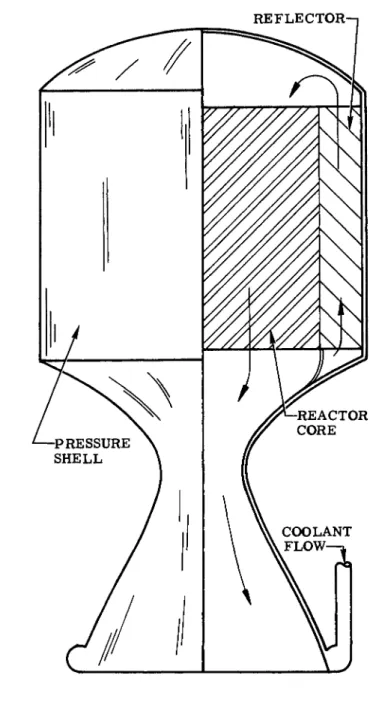
A schematic representation of the engine system used for this analysis is presented in F i g . 1. F o r simplicity, pumps, shields, piping, and control devices have been omitted.
The coolant flow is depicted as passing through a r e g e n e r a - tively cooled nozzle, a reflector, a p r e s s u r e shell, and then through the reactor core. It is obvious that as the afterheat is generated, those items nearest the heat source will absorb most of the afterheat.
Afterheat Generation
The decay products are composed of delayed neutrons, lasting for a few seconds, and beta and gamma r a y s . The W a y - W i g n e r afterheat equation has been used to determine beta and gamma decay power as a function of operating time, tQ, and shutdown time, tg:
SIXTH SYMPOSIUM ON BALLISTIC MISSILE AND AEROSPACE TECHNOLOGY
Fig. 1. Typical Nuclear Rocket Engine.
P s - 6 . 6 x l O -2[ ts- ° -2- ( to + tS) - ° - 2J (1) p0
Eq. 2 represents the delayed neutron contribution as a function of shutdown reactivity and delayed neutron fraction (1):
p / τ = ι τ
S - 6 (2)
P0 1 - D
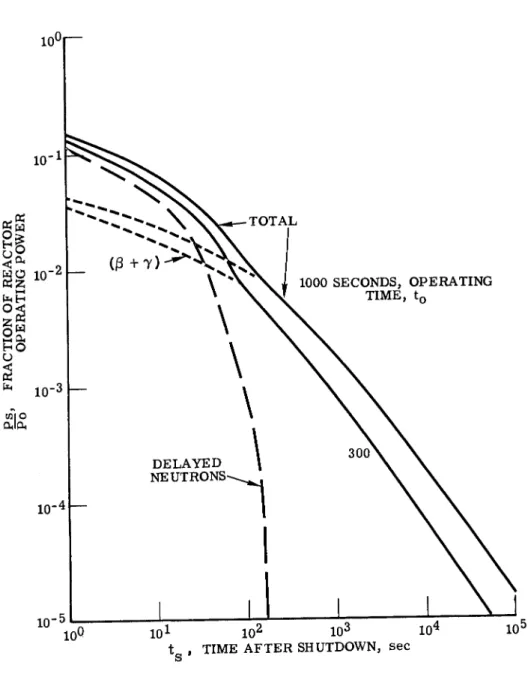
The total afterheat power is obtained by combining E q s . 1 and 2. With the assumption that shutdown reactivity is $7, Fig. 2 presents the total afterheat power. A s will be noted, the delayed neutron power becomes negligible after about 100 seconds shutdown time and may be neglected thereafter.
Operating times of 300 and 1000 seconds shown in the figure are typical of nuclear rocket engine operation.
The total afterheat is obtained from integration of E q s . 1 and 2:
Q T
ί [ β . 6 χ 1 ο - ^ ; 0 · 2 - ( . 0 + ν - ° · 2 ] + ^ dtg (3) By again assuming a step change in reactivity of $7, the solution of E q . 3 is obtained in terms of operating time:
- p J - = 8 . 2 5 tQ U- ° + 1.271 (4)
ο
Eq. 4 is shown graphically in F i g . 3. Note that for an operating time of 300 seconds, the total afterheat is 9 seconds which is 3% of the energy generated during operation.
Selection of Cycle
The scheduling of afterheat removal is primarily a sys
tem requirement. F o r purposes of classification, the r e moval methods are grouped as follows:
1. Open cycle 2. Closed cycle
3. Combination open and closed cycle
S I X T H S Y M P O S I U M O N B A L L I S T I C M I S S I L E ANDL A E R O S P A C E T E C H N O L O G Y
s
Fig. 2. Reactor Power During Shutdown.
5 6 7 8 9 1 02 2 3 4 5 6 7 8 9 1 03 2 3
t0, R E A C T O R O P E R A T I N G T I M E , sec
Fig. 3. Potential Afterheat at Reactor Shutdown.
SIXTH SYMPOSIUM ON BALLISTIC MISSILE AND AEROSPACE TECHNOLOGY
In the open cycle, coolant* is expelled through the engine system at a predetermined rate until the remaining heat generated can be absorbed or disposed of by the system.
One of the disadvantages of the open cycle is that coolant flows of from 5 - 2 0 % of the total propellant flow may be r e quired. Another disadvantage of the open cycle is the large variation in coolant flow rate which may b e as high as 1 0 " ^ or
1 0 " 6 of that required for full power operation. One solution to this problem is the intermediate storage of the generated heat in the system itself with periodic removal while operating the pump at its minimum flow rate. The main advantages of the open cycle are its relative simplicity and light weight because existing system components are utilized.
The closed cycle has the obvious advantage in that coolant is not expended. On the other hand, it requires the use of a radiator which becomes very heavy as power dissi
pation requirements increase. Another problem associated with the closed cycle is the conversion from an "open cycle"
during power operation to a closed system for cooldown. The provision for closing the nozzle and diverting the coolant is by no means a simple problem. It is probable that some form of nozzle plug would be required to effect the closure. An ad
vantage of the closed cycle is that it provides a heat source for the production of auxiliary power. If required, the reactor could continue to operate at a low power level after thrust termination with the radiator used as a heat rejection device.
An appropriate combination of open and closed cycle has been proposed to take advantage of the best features of each. During the initial cooldown when generated heat is l a r g e , the open cycle is contemplated. After the initial cooling period, when shutdown power is s m a l l e r , the system would be closed and the remaining afterheat dissipated through a radiator. Each method has its own merits. Selection of a technique will depend upon specific system requirements.
In this paper, the open cycle has been chosen as the method for afterheat r e m o v a l because of its simplicity and adaptability to early vehicles.
Afterheat Removal
To analyze the afterheat removal technique, it is neces
s a r y to establish the heat transfer requirements. A simpli
fied heat transfer model has been assumed to avoid the dif-
#The term "coolant" is used rather than "propellant" because it is possible they will not be the same fluid.
ficulty of solving the complex set of differential equations of transient conduction and convection. The model assumes a constant area channel surrounded by the m a s s to be cooled.
The differential equations assumed for the model are:
8T = h
F Â , , wc t=k ρ 3 TW
< TW - T ) (5)
9 A t = k
dT
(6)
wc ( Τ , - T . ) = -mc — - (7)
"dT v v > V i2 Al dt
The heat transfer effectiveness is defined as:
T 2 - T l
1 w Ll
(8) By combining E q s . 7 and 8, an expression is obtained with gas discharge temperature, T2» eliminated:
dT wc η
W = - ( Tw - T J ( 9 )
dt x w -V mc
If T- » wc , η, and mc are assumed constant and inde
pendent ortime? the solution of Equation 9 is defined in terms of initial and final wall temperatures:
- t W C p T ]
Twf = T W o - ( T W o-T l) ( l - e m c ) (10) By assuming values for maximum and minimum wall
temperatures, inlet coolant temperature, and system heat capacity per degree, m c , Equation 10 is solved for total coolant m a s s , tw, during the cooldown period. If the mass flow rate is specified, the time required for a cooldown period may then be calculated.
The minimum coolant requirement may be defined as that which results in maximum coolant specific impulse.
Ideally, this means maintaining as high a coolant discharge temperature as possible while dissipating power at the generated rate. Practically, this method is not feasible be
cause of the large variations in required coolant flow rate.
SIXTH SYMPOSIUM ON BALLISTIC MISSILE AND AEROSPACE TECHNOLOGY
If the coolant flow rate is established at the minimum allow
able value upon shutdown, then the coolant discharge tempera
ture will decrease with time because the rate of afterheat generation decreases with time. Constant coolant flow rate, although an uncomplicated method, results in very large coolant flow requirements, e . g . possibly three to four times that required for the mission.
In this analysis, a minimum coolant flow rate of 10% of design flow was selected to assure turbulent flow within the reactor. At lower rates, laminar flow would be established in the reactor, causing problems of flow maldistribution and excessive local core temperatures.
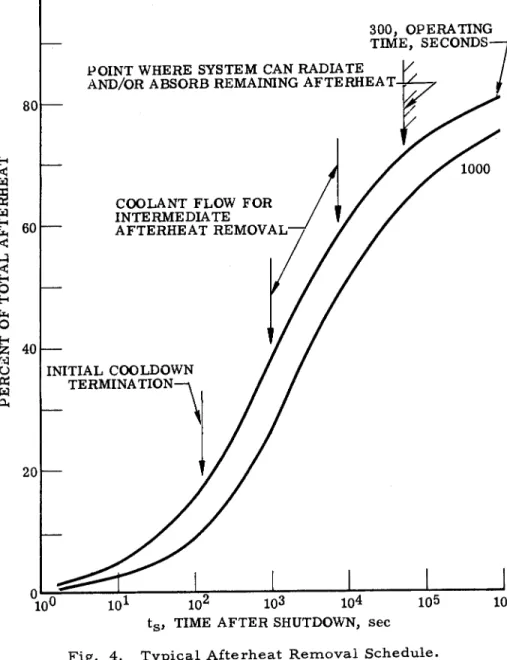
An alternate approach to a single cooling period is to allow the engine system itself to act as an intermediate heat sink with energy being removed by a periodic coolant flow.
In the Afterheat Removal Schedule shown in F i g . 4 , a r r o w s indicate the introduction of coolant. E q . 10 may then be separately applied to each cooldown period, the number of periods being determined by dividing the total afterheat by the energy to be removed per cycle. In this equation, the product mc may be replaced by total afterheat, Qrp, divided by ( T W q - T w f ) and total coolant flow obtained rather than coolant flow per cooldown cycle.
Fig. 5 illustrates system temperature and coolant flow during the shutdown cycle. It should be noted that maximum temperature during the initial cooldown (immediately following power operation) is greater than the maximum system tem
perature after initial cooldown because of system temperature limitations without coolant. Further, the point where the
system can dissipate the remaining afterheat may be a matter of hours after initial shutdown.
Fig. 6 presents total coolant flow per unit operating power as a function of maximum system temperature during cooldown for a typical engine system. It is significant to note that as system temperature increases, the amount of coolant required for cooldown decreases. The total afterheat coolant flow for a typical engine system may range from 5 - 30% of the total flow during operation.
Effect on Performance
Although the analysis presented is approximate in many respects, reasonable estimates of shutdown performance can be obtained for integration with the overall vehicle p e r f o r m ance.
The final step in the afterheat removal analysis is the determination of the effect on vehicle performance. The average specific impulse for cooldown has been obtained by
100
80
H
<
S
W H
<
<
H Ο Η Ο Η U « w a,
60
40
20
300, O P E R A T I N G T I M E , S E C O N D S P O I N T W H E R E S Y S T E M C A N R A D I A T E
A N D / O R A B S O R B R E M A I N I N G A F T E R H E A T -
V
C O O L A N T F L O W F O R I N T E R M E D I A T E
A F T E R H E A T R E M O V A L
7
1000
INITIAL C O O L D O W N T E R M I N A T I O N
10J 10' 103 1 04 105 1 06
ts, T I M E A F T E R S H U T D O W N , sec
Fig. 4. T y p i c a l Afterheat R e m o v a l Schedule.
SIXTH SYMPOSIUM ON BALLISTIC MISSILE AND AEROSPACE TECHNOLOGY
F L O W R E Q U I R E D F O R C O N T I N U E D C O O L D O W N INITIAL T E R M I N A T I O N
O F F L O W
- M A X I M U M T E M P . D U R I N G INITIAL
C O O L D O W N
M A X I M U M D E S I R E D S Y S T E M T E M P E R A T U R E W I T H O U T C O O L A N T F L O W
M I N I M U M S Y S T E M T E M P E R A T U R E
10° 10J 10^ 10c 10" 10a 10c
ts, T I M E A F T E R S H U T D O W N , sec
Fig. 5. Typical Afterheat Removal Sequence.
SIXTH SYMPOSIUM ON BALLISTIC MISSILE AND AEROSPACE TECHNOLOGY
determining the coolant discharge temperature as a function of time ( E q . 7), using coolant temperature to obtain specific impulse, and integrating specific impulse over the cooldown period. F i g . 7 presents the coolant total impulse during
shutdown as a function of maximum system temperature. The curve shows that total impulse increases with decreasing
temperature even though specific impulse decreases with decreasing temperature. Present estimates indicate that the total impulse during shutdown range from 2 - 17% of the operational requirement.
Since operational temperature and specific impulse are higher than during afterheat removal, it is desirable to de
termine the coolant weight penalty for afterheat removal for integration with vehicle performance. By first finding the afterheat total impulse, the total flow during operation that would give the same total impulse during cooldown is found.
The coolant weight penalty is then obtained from the differ
ence between the hypothetical and actual flows.
T o illustrate this point, the following example has been prepared. The following values a r e assumed for the engine:
Operating time 300 sec Maximum system temperature during
cooldown 2000° R Operating power 5000 mw Design flow rate 300 l b / sec Design specific impulse 900 sec Hydrogen as coolant and propellant
Propellant m a s s fraction 0. 6 Payload m a s s fraction 0. 2
It is interesting to note that the assumed engine and vehicle parameters result in a mission velocity of about 27, 000 fps. Such a vehicle would be capable of a 65 day, minimum energy transfer of a probe from low Earth orbit to the vicinity of M a r s ; or a 33 hour flight from a low Earth orbit to a Lunar orbit.
The shutdown coolant flow per unit operating power is obtained from F i g . 6 as 1.2. The total coolant for the shut
down period is:
WTCo o l a n t = 1. 2 χ 5000 = 6000 lb
The total impulse per unit operating power during shutdown is obtained from F i g u r e 7 as 0. 5 χ 103. Total impulse for cooldown is:
ITCo o l a n t = 0.5 χ Ι Ο3 χ 5000 = 2. 5 χ 106 l b - s e c The propellant flow that gives the same total coolant impulse is obtained by dividing the total coolant impulse by
SIXTH SYMPOSIUM ON BALLISTIC MISSILE AND AEROSPACE TECHNOLOGY
the design specific impulse:
tw = 2' 5 X 1 q 6 = 2,780 lb 900
The difference between coolant flow during shutdown and the comparable propellant flow that gives the same total
coolant impulse is defined as "excess coolant:1 1 W = 6000 - 2780 = 3220 lb
Propellant flow is the product of design flow and oper
ating time:
WT p r o p e l l a n t = 300 χ 300 = 9 χ 104 lb
Assuming a propellant m a s s fraction of 0. 6 and a pay- load fraction of 0. 2, the payload is then calculated:
W Pa y l o a d = 9 χ 104 χ = 3 0 ) 0 0 Q l h
Since the excess coolant has not been accounted for, it can be assumed that it is part of the payload. It should be noted that the excess coolant is approximately 11% of the pay- load.
Acknowledgement
The author extends his appreciation to M r . Allen T . Wilson and M r . Marvin J. Malik of the Research Department of Allison Division of General Motors for their review and comments during the preparation of this paper.
References
1. Weinberg, Alvin M . and W i g n e r , Joseph P . : "The Physical Theory of Neutron Chain Reactors, " The University of Chicago P r e s s , 1958.
2. Glasstone, Samuel: "Principles of Nuclear Reactor Engineering," 1958, Van Nostrand C o . , Inc.
3. Rizika, J. W . : "Thermal L a g s in Flowing Systems Con
taining Heat Capacitors, " Vol. 76, T r a n s . A S M E , 1954.
4. M c A d a m s , William H . : "Heat Transmission. " M c G r a w - Hill Book C o . , 1954.
5. King, Charles R. : "Compilation of Thermodynamic Properties, Transport Properties and Theoretical Rocket Performance of Gaseous Hydrogen, " NASA T N D-275, A p r i l 1960.