Abstract
In duplex stainless steels the ideally 1:1 ratio of austen- ite-to-ferrite phases ensures the outstanding mechanical and corrosion properties compared to other, conventional stainless steel grades. However, this phase balance can be easily shifted to a mostly austenitic or mostly ferritic microstructures, depending on the welding process and heat input. In order to determine the phase ratio, several methods are available to use, such as Feritscope measurements, ASTM E562 manual point count method (on metallographic images) or quantita- tive image analysis. From these methods, Feritscope measure- ments cannot be applied to determine phase quantification in the narrow heat affected zone of duplex stainless steel welds – because of the very limited heat input. The manual point count method is very dependent of the assessor and cannot be automated. In this paper a histogram-based image analyz- ing process was developed, using Beraha’s etchant solution.
The results were compared to Feritscope measurements and a very good correlation (R2 = 0.9995) was found. This method will give the ability to easily and automatically measure phase ratio in weld metal, heat affected zone or in subsurface regions of multi-pass welds.
Keywords
duplex stainless steels, etching optimization, histogram-based image analyzing, phase quantification
1 Introduction
Duplex stainless steels (DSS’s) and advanced high strength steels are gaining more and more attention from industry, thanks to their excellent mechanical properties and corrosion resistance, compared to conventional stainless steels [1-4].
These excellent properties are a result of the ideally 1:1 austen- ite-to-ferrite ratio of DSS’s [5-7].
Keeping this balanced ratio is the biggest challenge during DSS welding. All of the DSS’s solidify as delta ferrite and the duplex microstructure evolves under solid-state phase trans- formation during cooling [8-10]. The resulting microstructure after arc welding is a function of many parameters: the used heat input, shielding gas, filler metal and the number of weld passes. The heat affected zone (HAZ) of DSS welds are usually more ferritic, contrary to the weld metal (WM), which can be more austenitic in case of nitrogen-containing shielding gases, nickel over-alloyed filler metal and multi-pass welds [11-15].
The unbalanced microstructure (more ferritic or more auste- nitic) after welding of a DSS can result in the loss of mechani- cal properties and corrosion resistance [16-18]. This is the rea- son why measurement of the phase balance is mandatory after DSS welding.
Under industrial conditions, magnetic induction based Feritscopes are mainly used for phase ratio quantification.
These instruments calculate the ferromagnetic phase ratio (ferrite in DSS) in a given volume. This measured volume is dependent on the penetration depth of the eddy-current used for excitation.
The phase measurement with a Feritscope is limited; only the WM and base metal (BM) phase ratio can be measured accurately. The HAZ is usually very narrow (100–200 µm, e. g. Fig. 1) – due to the maximum recommended heat input for DSS welding is 2.0 kJ · mm-1. This narrow region causes uncertainty at the positioning of the probe, and the excited volume is usually greater since the Feritscope is also measuring either WM or BM as a part of the HAZ results [19].
For more detailed phase ratio quantification, a metallo- graphic specimen is needed. On the prepared specimens x-ray diffraction (XRD) [20], electron backscatter diffraction
1 Department of Materials Science and Engineering, Faculty of Mechanical Engineering,
Budapest University of Technology and Economics, H-1111 Budapest, Bertalan Lajos str. 7, Hungary
2 Department of Welding and Materials Joining, School of Engineering,
LeTourneau University,
TX 75602, Longview, 2100 S. Mobberly Avenue, USA
* Corresponding author, e-mail: varbai@eik.bme.hu
Development and Comparison of Quantitative Phase Analysis for Duplex Stainless Steel Weld
Balázs Varbai
1*, Timothy Pickle
2, Kornél Májlinger
1Received 14 March 2018; accepted after revision 10 May 2018
PP Periodica Polytechnica Mechanical Engineering
62(3), pp. 247-253, 2018 https://doi.org/10.3311/PPme.12234 Creative Commons Attribution b research article
(EBSD) [21, 22] or most often quantitative optical microscopic method can be used for phase ratio evaluation [23, 24].
Fig. 1 Typical microstructure of a duplex stainless steel weld;
2205 DSS base material, TIG welded with 1 kJ∙mm-1 heat input
Quantitative optical microscopy can be used to determine the volume fraction by a manual point count method (according to ASTM E562 standard [25]) or quantitative metallography using an image analyzer. In case of the ASTM E562 method, an array of points formed by a grid line is superimposed upon a magni- fied image, and the number of points falling within the micro- structural constituent of interest is counted and averaged for a selected number of fields. If the amount of volume fraction of interest is higher than 20 % (which is true for almost all cases of DSS welds), 100 point should be evaluated of 20 fields for a 10 % relative accuracy. This method is slow, highly subjective, not automated, and not repeatable for all users. On the contrary, image analyzing is more efficient, because it can be automated and gives faster results than the manual point count method.
For the proper usability of image analyzing an adequate metallographic preparation and contrast etching is required.
For DSS etching different etchant solutions are available (see Table 1); however, Beraha’s reagent is widely used for phase selective color etching [26-28]. Beraha’s reagent paints the ferrite phase dark and the austenite phase remains light. In case of Beraha’s etchant it was found the etching time has a great influence on the usability of metallographic images for quantitative phase analysis.
In our research we investigated the effect of Beraha’s reagent’s etching time of 2205 duplex stainless steel (EN 1.4462) welds on the image quality. The optimum etching pro- cess was determined, which also gives the best correlation to Feritscope results in the weld metal and base metal.
2 Materials and methods
The used base material for automated, autogenous tungsten inert gas (TIG) welding was a 6 mm thick 2205 (EN 1.4426 or X2CrNiMoN22-5-3) duplex stainless steel sheet. The chemical composition of: 22 wt.% Cr, 5.5 wt.% Ni, 2.8 wt.% Mo and 0.166 wt.% N. The heat input during welding was 1 kJ·mm-1, calculated with 0.6 thermal efficiency factor for TIG welding.
The Feritscope measurements were done in 10 points on the face side along the 100 mm long weld seam with equal dis- tances. The used instrument was a Fischer FMP 30 Feritscope, which measures according to the magnetic induction method.
For quantitative image analyzing measurements standard metallographic specimens were prepared from the transverse direction of the weld and polished to 1 µm diamond polisher.
For the microstructural evaluation of duplex stainless steels different etchants are recommended (Table 1).
Table 1 Recommended etchants for duplex stainless steels and their applications
Etchant Content Application Ref.
Beraha
85 mL water 15 mL HCl 1 g K2S2O5
colors ferrite but not
austenite [29]
Carpenter 85 mL ethanol 15 mL HCl
to reveal grain and phase boundaries [29]
Electrochemical NaOH
100 mL water 10 g NaOH
distinguish between
chi and sigma phase [23, 24]
Grosbeck
100 mL water 4 g NaOH 4 g KMnO4
to reveal sigma
phase and nitrides [24]
Inhibited ferric chloride
100 mL water 5 g FeCl3 1 g NaNO3
detrimental phases in lean duplex steels [30]
Murakami
100 mL water 10 g NaOH 10 g K3Fe(CN)6
colors ferrite and
sigma phase [24, 29]
Sodium Hydroxide
100 mL water 40 g NaOH
detrimental phases
in duplex [31]
As mentioned, for phase ratio quantification Beraha’s etchant is the most suitable [29], because it colors ferrite phase dark and leaves the austenite phase bright. However, the suffi- ciency is strongly dependent on the etching time and the num- ber of etching cycles. In order to investigate the effects of etch- ing time and cycle of Beraha’s etchant, different total etching times and different cycles were used (see: Table 2) to quantify the phase ratio in the weld. In Table 2 the total etching time is to be interpreted as the sum of the etching times of each etching cycles, (e.g. 3 cycles and 12 seconds total etching time means 3×4 s etching time). The etchant should be freshly made before every process [29]. Before every etching cycle the metallo- graphic samples were grinded back to 2000 grit paper and pol- ished again. Before the etching the samples were cleaned with ethanol and completely dried. During etching the sample was constantly stirred in the etchant solution. After the etching pro- cess the sample was washed off in running water and cleaned with ethanol and dried again. If multiple etching cycles were used, the cleaning process was done before every etching cycle.
Table 2 The investigated total ethcing times and etching cycles for Beraha’s reagent in case of 2205 DSS welds Etching cycle (1) Total etching time (s)
3 6 12 24 48
1
2
3
According to Table 2, an image was taken using Olympus PMG3 optical microscope from the same 700×700 µm area after each etching process. The phase quantification of the metallographic images were done using an image threshold method [32].
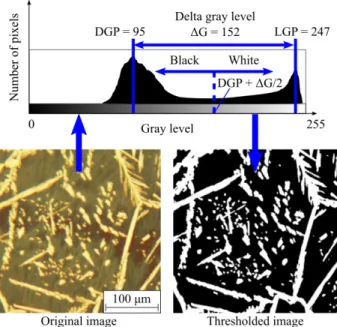
The steps of the developed threshold process (also illus- trated in Fig. 2) are: (I) the original image is loaded to an image analyzer software and (II) the grayscale histogram is taken up on the 0 to 255 range (8 bit). The histogram has two peaks; one at a darker gray level (DGP, closer to 0 value) and one at a lighter gray level (LGP, closer to 255 value). The difference between the two gray level peaks (ΔG) is equiva- lent to the level of contrast of the image. In order to count the darker and lighter number of pixels (which is in correlation to the austenite – ferrite ratio) the original image should be con- verted into a black and white image. The most adequate way to do this is to take the average value of the gray level difference (0.5 · ΔG) and add it to the DGP value (III). The resulted value can be taken as a boundary (DGP + 0.5 · ΔG) (IV), and from this boundary the lower values will be painted to black and the higher values to white (V). Finally, the ratio of the white and black pixels can be measured and correlated to the austenite – ferrite ratio (VI). This process can be automated and does not depend on the type of image analyzer software used. It is also found, in order to have a corresponding result to the Feritscope measurements, the microstructure image should be taken from at least a 500×500 µm area.
Although the Feritscope measurement method is the easiest way to determine the ferrite content in a DSS, it’s application has boundaries. Since it is a magnetic inductive method, the result of the measurement strongly depends on the right contact between the probe and the measured material. This is the reason only flat surface can be measured correctly. For example, the measurement of weld root can be often misleading because of the strong curvature and the lack of magnetic contact. The other limit of the Feritscope method is the measurement of smaller volumes. The HAZ in DSS welds is usually narrow at the typ- ical heat input range (e.g. Fig. 1). Thus, image analyzing and ASTM E562 manual point count are the only proper methods for determining the HAZ microstructural phase ratio.
3 Results and discussion 3.1 Feritscope measurements
Fischer type Feritscope measurements were done in the weld metal in order to compare the results of metallographic phase ratio quantification of different etching procedures. The average measured austenite content, along the whole length of the welded seam was 28.9±2.7 %. All the results of histogram based image analyzing will be compared to these results.
3.2 Phase ratio quantification with image analyzing In Fig. 3 the ΔG values are plotted as a function of total etching time vs. etching cycles. In Fig. 3 it is visible the level of ΔG depends on the used etching cycle and etching time. The optimal etching process can be found, where ΔG (the level of contrast) is the maximum. The highest ΔG values were found at the multiple etching cycles. Accordingly, in Fig. 3 two optimums can be predicted.
Fig. 3 Color fill contour plot of the contrast level of metallographic images as a function of etching time and cycle using Beraha’s etchant on 2205 DSS WM
Fig. 2 Steps of histogram based image analyzing for austenite – ferrite phase ratio quantification of 2205 DSS WM
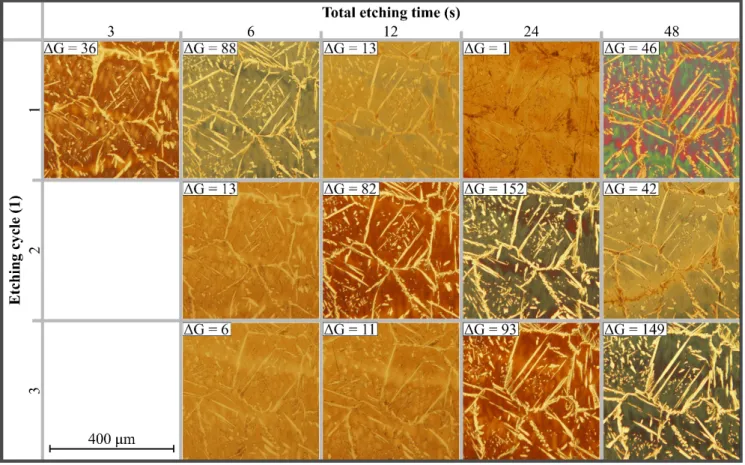
For visualization, cropped areas taken from the etched spec- imens (according to Table 2) are shown in Fig. 4. In Fig. 4 it is also visible that multiple etching cycles will give better results in contrast. For a single cycle of etching the 6 s etching time gave the best result. The 24 s one cycle etching gave the least contrast value, which means the grain structure is over-etched and no optical difference is visible between the two phases (it would make the ASTM method virtually impossible). The first etching cycle is suitable to reveal grain boundaries, but in order to increase the contrast (darken the ferrite phase) another cycle of etching is needed. Three etching cycle is generally not recommended, because in case of shorter individual cycles insufficient contrast was observed (e.g. 3×2 s and 3×4 s etch- ing cycles). One optimal etching process was found at 3×16 s (ΔG = 149) and another at 2×12 s (ΔG = 152) etching cycle, respectively. According to Fig. 3, the optimal etching process seems to have a gradient toward the multiple cycles, with ~10- 15 s etching time in each cycle, but the possible gain is not sufficient as more effort and attention is needed for sample preparation. Therefore, for further evaluation the shorter and simpler 2×12 s total etching cycle was chosen in order to minimize the possible etching defects coming from multiple etching cycles (ethanol cleaning, drying).
For all of the etching cycles the austenite ratio (ARimage) is mea- sured (Table 3) with the image analyzing method described in Chapter 2 (Materials and methods). Taking the Feritscope’s result
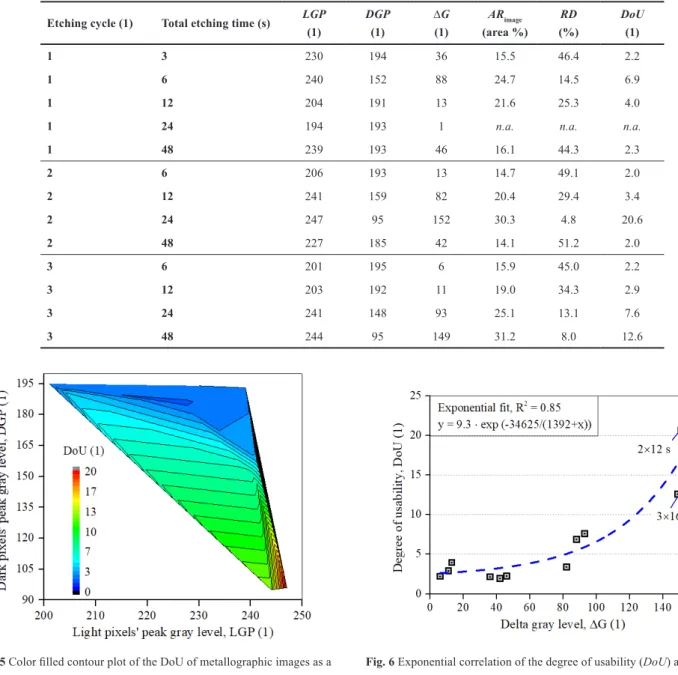
as etalon (ARFeritscope = 28.9±2.7 %) the difference of the image analyzing results compared to the Feritscope’s result are also cal- culated in percentages as, RD = (ARFeritscope - ARimage) × ARFeritscope-1. From RD a unit less number, the degree of usability (DoU) is calculated as DoU = 100 × RD-1. Representing DoU as a function of the DGP and LGP values of the different etching cycles on a contour color fill plot (Fig. 5), it is visible that, the lower DGP and the higher LGP value will result in a higher DoU.
The evaluation of the image with the chosen optimal etching process (2×12 s) gives 30.3 area % austenite content (ARimage) and 20.6 DoU value. In accordance with Fig. 5, the DoU value can be plotted as a function of the ∆G contrast level (Fig. 6). The relationship is a quasi-exponential correlation; the increasing contrast level means exponentially increasing usability.
According to Fig. 6 the two highest usability values were found at the optimal etching times, where the shorter and simpler etching process (2×12 s etching cycle) gave the highest value. Therefore, this cycle is recommended for histogram- based image analyzing.
3.3 Results of manual point count method
The manual point count method according to ASTM E562 was done on two images, which represents the two extremes of the result of the etching process. The two selected images were the ΔG = maximum (2×12 s etching cycle) and the ΔG = minimum (1×24 s etching cycle). The original size of the
Fig. 4 Cross sectional microscopy images on 22050 DSS WM’s with contrast levels (∆G) as a function of different total etching times and etching cycles with Behara’s reagent.
images was a 700×700 µm area. For manual point count a grid was placed onto the images with 108 intersection points. Each intersection points were evaluated individually, deciding if the point is on austenite phase (= 1) on ferrite phase (= 0) or on phase boundary (= 0.5). After the evaluation, the sum of all the values are divided by the number of points (108 points) and multiplied by 100 to get the austenite phase percentage. On the image where ΔG = minimum, it was not possible to get results, because we were unable to decide whether the intersection points lied on the austenite or ferrite phase since there was a lack of color contrast. On the image where ΔG = maximum, the error of the subjective manual point count appeared; one result was 36.1 area % and the other was 33.3 area % on the same image with the same grid (Feritscope value was 28.9±2.7 %, while image analyzer read 30.3 area %). Also, if a 10 % relative accuracy is to be achieved 20 fields of a 108 points grids should
be evaluated. Although the ASTM E562 manual point count method is widely used on metallographic images, its measure- ment error, slowness, and subjectivity can lead to misleading results. Because of the significant error and lack of reproduc- ibility, the manual point count method is usually complemented with image analyzing as well [1, 33, 34]. On the other hand, the image analyzing process described in this paper will always give the same results, regardless of whom the assessor is.
3.4 Comparison of Feritscope and histogram-based image analyzing method
In order to validate the developed histogram-based image analyzing process (described in Materials and Methods sec- tion), previously welded samples were evaluated. The previ- ous projects included different duplex and lean duplex stain- less steel grades welded with different heat inputs, therefore
Table 3 The summary of image data, average austenite content in WM and degree of usability as a function of etching cycles after histogram based image analyzing on 2205 DSS welds, etched with Beraha’s etchant.
Etching cycle (1) Total etching time (s) LGP (1)
DGP (1)
∆G (1)
ARimage (area %)
RD (%)
DoU (1)
1 3 230 194 36 15.5 46.4 2.2
1 6 240 152 88 24.7 14.5 6.9
1 12 204 191 13 21.6 25.3 4.0
1 24 194 193 1 n.a. n.a. n.a.
1 48 239 193 46 16.1 44.3 2.3
2 6 206 193 13 14.7 49.1 2.0
2 12 241 159 82 20.4 29.4 3.4
2 24 247 95 152 30.3 4.8 20.6
2 48 227 185 42 14.1 51.2 2.0
3 6 201 195 6 15.9 45.0 2.2
3 12 203 192 11 19.0 34.3 2.9
3 24 241 148 93 25.1 13.1 7.6
3 48 244 95 149 31.2 8.0 12.6
Fig. 5 Color filled contour plot of the DoU of metallographic images as a function of light and dark peak levels of the metallographic images
Fig. 6 Exponential correlation of the degree of usability (DoU) as a function of image contrast (∆G) on the Beraha etched 2205 DSS WM
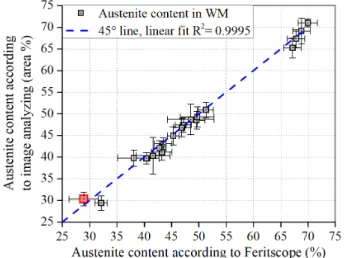
resulting in different austenite contents. The austenite content in the weld metal was determined with both (histogram-based image analyzer and Feritscope) methods. These results were compared in Fig. 7. To the measured points a 45° straight line is fitted with R2 = 0.9995. The value of the optimally etched sample of the current work is highlighted with red color.
The result of this comparison means the developed image analyzing process is suitable to use instead of Feritscope mea- surement for applications where Feritscope is hard to use (e.g.
on heat affected zones, weld roots or on multi-pass welds to measure phase ratio of each pass).
Fig. 7 Correlation analysis of phase ratio results measured by Feritscope and histogram based image analyzing method. The optimally etched sample of the
current work is highlighted with red color.
4 Conclusions
• In this research, a histogram-based image analyzing method for phase quantification of duplex stainless steel welds was developed. The main conclusions are:
• Beraha’s type etchant is suitable for 2205 (EN 1.4462) duplex stainless steel etching for histogram-based image analyzing.
• The optimal etching cycle for histogram-based image analyzing was determined as two etching cycles each for 12 seconds.
• The histogram-based image analysis for phase analysis was compared and validated with Feritscope results in the weld metal as a very good correlation (R2 = 0.9995) was found.
The histogram-based image analyzing method described in this paper is also applicable to measure phase ratio in the heat affected zones of the weld, where Feritscope measurement is not applicable.
Acknowledgements
This paper has been supported by the János Bolyai Research Scholarship of the Hungarian Academy of Sciences grant number: Bo/00196/16/6 and by the National Research, Development and Innovation Office – NKFIH, OTKA PD 120865 (K. Májlinger).
References
[1] Kuroda, T., Ikeuchi, K., Kitagawa, Y. "Role of Austenite in Weld Tough- ness of Super Duplex Stainless Steel." Welding in the World. 49(5-6), pp. 29-33. 2005.
https://doi.org/10.1007/BF03263407
[2] Boillot, P., Peultier, J. "Use of stainless steels in the industry: recent and future developments." Procedia Engineering. 83, pp. 309-321. 2014.
https://doi.org/10.1016/j.proeng.2014.09.015
[3] Russo Spena, P., Cortese, L., De Maddis, M., Lombardi, F. "Effects of process parameters on spot welding of TRIP and quenching and parti- tioning steels." Steel Research International. 87(12), pp. 1592-1600.
2016.
https://doi.org/10.1002/srin.201600007
[4] Dobosy, Á., Lukács, J. "The effect of the filler material choice on the high cycle fatigue resistance of high strength steel welded joints." Mate- rials Science Forum. 885, pp. 111-116. 2017.
https://doi.org/10.4028/www.scientific.net/MSF.885.111
[5] Gunn, R. N. "Duplex stainless steels : microstructure, properties and ap- plications." Abington Publishing. 1997.
[6] Guo, Y., Sun, T., Hu, J., Jiang, Y., Jiang, L., Li, Ji. "Microstructure evo- lution and pitting corrosion resistance of the Gleeble-simulated heat-af- fected zone of a newly developed lean duplex stainless steel 2002." Jour- nal of Alloys and Compounds. 658(658), pp. 1031-1040. 2016.
https://doi.org/10.1016/j.jallcom.2015.10.218
[7] Pluphrach, G., Yamsai, S. "Estimation of Ferrite Grain Size and Mechan- ical Properties of a 22MnVNb6 Microalloyed Low Carbon Cast Steel."
Periodica Polytechnica Mechanical Engineering. 62(1), pp. 83-89. 2017.
https://doi.org/10.3311/PPme.11458
[8] Westin, E. M., Brolund, B., Hertzman, S. "Weldability Aspects of a New- ly Developed Duplex Stainless Steel LDX 2101." Steel Research Inter- national. 79(6), pp. 473-481. 2008.
https://doi.org/10.1002/srin.200806155
[9] Dobránszky, J., Mészáros, I., Nagy, G. "Mechanical and thermal induced phase transformations in superduplex stainless steel." In: 6th World Du- plex Conference and Expo, Venice, Italy, pp. 385-393. 2000.
[10] Mészáros, I., Bögre, B. "Plastic deformation and thermal induced phase transformation in 2507 type super duplex stainless steel." Materials Sci- ence Forum. 885, pp. 184-189. 2017.
https://doi.org/10.4028/www.scientific.net/MSF.885.184
[11] Hertzman, S., Ferreira, P. J., Brolund, B. "An Experimental and The- oretical Study of Heat-Affected Zone Austenite Reformation in Three Duplex Stainless Steels." Metallurgical and Materials Transactions A.
28, pp. 277-285. 1997.
https://doi.org/10.1007/s11661-997-0130-6
[12] Hertzman, S. "The influence of nitrogen on microstructure and proper- ties of highly alloyed stainless steel welds." ISIJ International. 41(6), pp. 580-589. 2001.
https://doi.org/10.2355/isijinternational.41.580
[13] Westin, E. M., Johansson, M. M., Pettersson, R. F. A. "Effect of nitro- gen-containing shielding and backing gas on the pitting corrosion resis- tance of welded lean duplex stainless steel LDX 2101((R)) (EN 1.4162, UNS S32101)." Welding in the World. 57(4), pp. 467-476. 2013.
https://doi.org/10.1007/s40194-013-0046-2
[14] Hosseini, V. A., Wessman, S., Hurtig, K., Karlsson, L. "Nitrogen loss and effects on microstructure in multipass TIG welding of a super duplex stainless steel." Materials and Design. 98, pp. 88-97. 2016.
https://doi.org/10.1016/j.matdes.2016.03.011
[15] Hosseini, V. A., Karlsson, L., Engelberg, D., Wessman, S. "Time-tem- perature-precipitation and property diagrams for super duplex stainless steel weld metals." Welding in the World. 62(3), pp. 517-533. 2018.
https://doi.org/10.1007/s40194-018-0548-z
[16] Fábián, E. R., Dobránszky, J., Csizmazia, J., Ott, R. "Effect of laser beam welding on the microstructure of duplex stainless steels." Materials Sci- ence Forum. 885, pp. 245-250. 2017.
https://doi.org/10.4028/www.scientific.net/MSF.885.245
[17] Deng, B., Wang, Z., Jiang, Y., Sun, T., Xu, J., Li, J. "Effect of thermal cy- cles on the corrosion and mechanical properties of UNS S31803 duplex stainless steel." Corrosion Science. 51(12), pp. 2969-2975. 2009.
https://doi.org/10.1016/j.corsci.2009.08.015
[18] da Fonseca, G., Barbosa, L., Ferreira, E., Xavier, C., de Castro, J. "Mi- crostructural, Mechanical, and Electrochemical Analysis of Duplex and Superduplex Stainless Steels Welded with the Autogenous TIG Process Using Different Heat Input." Metals. 7(12), pp. 538. 2017.
https://doi.org/10.3390/met7120538
[19] Verma, J., Taiwade, R. V. "Effect of welding processes and conditions on the microstructure, mechanical properties and corrosion resistance of duplex stainless steel weldments—A review." Journal of Manufacturing Processes. 25, pp. 134-152. 2017.
https://doi.org/10.1016/j.jmapro.2016.11.003
[20] Forgas Junior, A., Otubo, J., Magnabosco, R. "Ferrite Quantification Methodologies for Duplex Stainless Steel." Journal of Aerospace Tech- nology and Management. 8(3), pp. 357-362. 2016.
https://doi.org/10.5028/jatm.v8i3.653
[21] Berecz, T., Szabó, P. J. "Examination of the orientation relationships be- tween the main phases of duplex stainless steel by EBSD." Materials Science Forum. 537-538, pp. 297-302. 2007.
https://doi.org/10.4028/www.scientific.net/MSF.537-538.297
[22] Karlsson, L., Börjesson, J. "Orientation relationships of intragranular austenite in duplex stainless steel weld metals." Science and Technology of Welding and Joining. 19(4), pp. 318-323. 2014.
https://doi.org/10.1179/1362171813Y.0000000192
[23] Jackson, E. M. L. E. M., Visser, P. E. de, Cornish, L. A. "Distinguishing between Chi and Sigma phases in duplex stainless steels using potentio- static etching." Materials Characterization. 31(4), pp. 185-190. 1993.
https://doi.org/10.1016/1044-5803(93)90061-Y
[24] Llorca-Isern, N., López-Luque, H., López-Jiménez, I., Biezma, M. V.
"Identification of sigma and chi phases in duplex stainless steels." Mate- rials Characterization. 112, pp. 20-29. 2016.
https://doi.org/10.1016/j.matchar.2015.12.004
[25] "Standard Test Method for Determining Volume Fraction by Systematic Manual Point Count." ASTM E562 - 11. (n.d.)
https://doi.org/10.1520/E0562-11.2
[26] Westin, E. M., Johansson, M. M., Bylund, L.-Å. A., Pettersson, R. F. A.
"Effect on microstructure and properties of super duplex stainless steel welds when using backing gas containing nitrogen and hydrogen." Weld- ing in the World. 58(3), pp. 347-354. 2014.
https://doi.org/10.1007/s40194-014-0120-4
[27] Alcantara, A. S., Fábián, E. R., Furkó, M., Fazakas, É., Dobránszky, J., Berecz, T. "Corrosion resistance of TIG welded joints of stainless steels."
Materials Science Forum. 885, pp. 190-195. 2017.
https://doi.org/10.4028/www.scientific.net/MSF.885.190
[28] Ciuffini, A., Barella, S., Di Cecca, C., Gruttadauria, A., Mapelli, C., Mombelli, D. "Isothermal austenite–ferrite phase transformations and microstructural evolution during annealing in super duplex stainless steels." Metals. 7(9), pp. 368. 2017.
https://doi.org/10.3390/met7090368
[29] Vander Voort, G. F., Manilova, E. P. "Hints for Imagining Phases in Steels." Advanced Materials and Processes. pp. 32–33. 2005.
[Online]. Available from: https://www.asminternational.org/docu- ments/10192/1876164/amp16302p032.pdf/3f96696a-ff1b-4980-a12b- 0131d52e9c4e [Accessed: 16th May 2018]
[30] "Standard Test Method for Detecting Detrimental Phases in Lean Duplex Austenitic/ Ferritic Stainless Steels." ASTM A1084 - 15a. (n.d.) https://doi.org/10.1520/A1084
[31] "Standard Test Methods for Detecting Detrimental Intermetallic Phase in Duplex Austenitic/Ferritic Stainless Steels." ASTM A923 - 14. (n.d.) https://doi.org/10.1520/A0923-14.1.6
[32] Friel, J. J. "Practical Guide to Image Analysis." ASM International.
2000.
[33] Migiakis, K., Papadimitriou, G. D. "Effect of nitrogen and nickel on the microstructure and mechanical properties of plasma welded UNS S32760 super-duplex stainless steels." Journal of Materials Science.
44(23), pp. 6372-6383. 2009.
https://doi.org/10.1007/s10853-009-3878-9
[34] Mei He, B. S. "Evaluation of the Susceptibility of Duplex Stainless Steel 2205 to Hydrogen Assisted Cracking in REAC Systems." The Ohio State University. 2016.