This article is published with Open Access at www.akademiai.com DOI: 10.1556/168.2018.19.3.3
Introduction
The Mediterranean basin is one of the most important biodiversity hot-spots in the world, and has been labelled as a climate change hot spot by the Inter-Governmental Panel for Climate Change (IPCC; Loizidou et al. 2016). The distribu- tion of vascular flora in the Mediterranean basin was strongly influenced by a complex geological and climatic history, and especially by the Mediterranean Messinian salinity crisis, and the fluctuation of sea level during the Quaternary glacial peri- ods (Mansion et al. 2008). Climate changes in such a complex ecological context could heavily influence communities com- position, and the most relevant effect could be an increasing occurrence of taxa adapted to more dry and hot conditions (Reid et al. 2007, Vacchi et al. 2001, Walther et al. 2007, 2009), leading to the disappearance of local, endemic taxa, as well as to a reduced resistance and resilience of ecosystems (Jump and Peñuelas 2005).
Among plants, orchids are probably one of the families with more rare and endangered taxa (Brigham and Swartz 2003, Pitman and Jørgensen 2002, Wilcove et al. 1998), and have been targeted by several conservation efforts to prevent the effects of global changes (Sletvold et al. 2013). Out of the
25000-35000 taxa of the family Orchidaceae (Christenhusz and Byng 2016), 529 are known to occur in Europe (Delforge 2006), and one of their biodiversity hotspots is the Sardinia island (Mittermeier et al. 2004), which is known to host 60 taxa (Lai 2009). Thanks to its position, Sardinia has a very diverse climate (Fois et al. 2017), which, coupled with a com- plex geomorphology (Fois et al. 2017), produces a relevant number of different habitats. However, because of climate changes, its ecosystems are changing, and while some spe- cies are disappearing, others are colonising the island, and/
or increasing their distribution. Future climate change scenar- ios (IPCC5 global climate models, RCP 4.5 greenhouse gas emission scenario for 2070) for Sardinia depict a situation in which the average monthly temperatures could increase by 10–20% (even 50% during the cold season) with respect to the means of the 1961–1990 period. Furthermore, precipita- tions could increase by 20–50% during the cold season, and decrease by 20–50% during the rest of the year (Gritti et al.
2006) with respect to the 1961–1990 period. Climate change can affect orchids in several ways. A deficiency of precipita- tion during the coldest months could prevent a correct root development, and limit the storage of nutrients to sustain the vegetative phase of the life cycle (Rasmussen 1995, Wells
Distributional pattern of Sardinian orchids under a climate change scenario
S. Ongaro
1,3, S. Martellos
1, G. Bacaro
1, A. De Agostini
2, A. Cogoni
2and P. Cortis
21 Dipartimento di Scienze della Vita, Università degli Studi di Trieste, Via Licio Giorgieri 10, 34127, Trieste (TS), Italy
2 Dipartimento di Scienze della Vita e dell’Ambiente, Università degli Studi di Cagliari, Sezione Botanica, Viale Sant’Ignazio 1, 09123, Cagliari (CA), Italy
3Corresponding author. Email: silvia.ongaro@phd.units.it
Keywords: Biodiversity, Climatic niche, Conservation, Ensemble modelling, Mediterranean basin.
Abstract: The Mediterranean is one of the major biodiversity hotspots of the world. It has been identified as the “core” of the speciation process for many groups of organisms. It hosts an impressive number of species, many of which are classified as en- dangered taxa. Climate change in such a diverse context could heavily influence community composition, reducing ecosystems resistance and resilience. This study aims at depicting the distribution of nine orchid species in the island of Sardinia (Italy), and at forecasting their future distribution in consequence of climate change. The models were produced by following an “en- semble” approach. We analysed present and future (2070) niche for the nine species, using Land Use and Soil Type, as well as 8 bioclimatic variables as predictors, selected because of their influence on the fitness of these orchids. Climate change in the next years, at Mediterranean latitudes, is predicted to results mainly in an increase of temperature and a decrease of precipitation. In 2070, the general trend for almost all modelled taxa is the widening of the suitable areas. However, not always the newly gained areas have high probability of presence. A correct interpretation of environmental changes is needed for developing effective conservation strategies.
Abbreviations: GAM–Generalized Additive Model, GLM–Generalized Linear Model, GPS–Global Positioning System, HadGEM–Hadley Global Environment Model, IPCC–Inter-Governmental Panel for Climate Change, IUCN–International Union for Conservation of Nature, N–North, NW–North-West/Western, RCP–Representative Concentration Pathway, RF–
Random Forest, SE–South-East, SW–South-West/Western, TSS–True Skill Statistic.
Nomenclature: Cronquist (1981).
and Cox, 1989). An increased temperature seasonality could expose the seedlings to freezing during the cold period, and to heat shock, if the hot season will not be preceded by a mild spring as acclimatization period. Furthermore, too high temperatures during the hottest months could limit several or- chids in closing their seasonal vegetative cycle in an optimal way (Hutchings 2010).
In order to prevent loss of biodiversity, and for develop- ing effective conservation strategies, it is relevant to under- stand the effects of climate change on the future distribution of each species. Climatic niche modelling, which is a use- ful approach for understanding the current distribution of a taxon, and forecasting its future distribution, is often used for developing more effective conservation strategies (Attorre et. al. 2013). Especially when applied in the field of conser- vation ecology, since conservation efforts can be expensive and time consuming, climatic niche modelling can provide a way for optimising resources and better addressing efforts.
An interesting example is the case of the conservation of wild potato relatives, which were lacking from germplasm collec- tions. Hence, species distribution modelling was used to es- tablish high suitability habitats for collecting wild specimens (Castañeda-Álvarez et al. 2015). Niche models have also been used to understand distributional patterns, to forecast fu- ture distribution of species and to plan effective conservation strategies on several groups of organisms. In a study from Wang et al. (2016), they were used not only to assess the nich- es of several forest trees in a climate change scenario, and their shifts, but also to identify species which could be suit- able for reforestation. As far as orchids are concerned, there are several studies which make use of species distribution models. Kolanowska (2013) and Kolanowska and Konowalik (2014) analysed the climatic niches of Epipactis helleborine and Arundina graminifolia, two invasive orchids, and their potential modification in future scenarios both in native and invasive ranges. Other studies aimed at quantifying poten- tial distribution, species richness, and turnover, in specific sites, in order to define which phytogeographical regions are more important for conservation (e.g., Vollering et al. 2015).
The same approach is also used to identify areas which are suitable for a given taxon, but in which the taxon was not reported yet, hence potentially discovering new populations.
Furthermore, since biodiversity also affects human welfare, it is urgent to quantify and understand it loss, in order to adapt to its consequences (habitats and ecosystems loss and frag- mentation, species endangerment and extinction). Since spa- tial and ecological differences across the globe are too wide, and of the number of endangered organisms and ecosystems is increasing steadily, niche modelling can be more useful at regional scale.
In this paper, we applied an ensemble niche modelling approach to occurrence records of nine orchid taxa known to occur in Sardinia, aiming at:
a) depicting their current distribution, and
b) understanding whether and how their distribution will change in future climate scenarios.
These two questions could be the starting point for devel- oping proper conservation strategies.
Materials and methods Study area
The Island of Sardinia has an area of 241,00 km2, with an elevation range from 0 to 1834 m a.s.l. (Punta la Marmora, Gennargentu Massif).
Its geological structure is made of several stratified lay- ers, which are: a) "Hercynian Basement" (schistore rocks variously metamorphosed and refolded during the Hercynian Orogenesis), of sedimentary origin, with an age ranging from Lower Cambrian to Lower Carboniferous (SE Sardinia). b) thick marine carbonatic sediments (dolomites, limestones), from Triassic to Cretaceous (Supramonte); c) a very thick Cenozoic succession made by continental and marine sedi- ments (conglomerates, sandstones, clayes), marles and lime- stones, from Eocene to Pliocene, (area around Cagliari); d) detritic deposits, mostly continental (alluvional, aeolian, la- custric etc) of the Quaternary (conglomerates, grainstones, silt, clay), generally of limited thickness, discontiously cov- ering the previous geological formations (Campidano valley) (Carmignani et al. 2008).
Climate is characterized by two main seasons, hot-dry and a cold-humid (Arrigoni 2006). The former has its higher intensity at high latitudes and altitudes. Annual mean tem- perature rages from 17-18 °C on the coast, to 10-12 °C on the mountains. Annual precipitation varies greatly from the coast to the inland. The average minimum is recorded in the South- West (e.g., Cagliari, 433 mm/y), while the maximum in the montane areas in the North (with a peak in Mount Limbara, 1412 mm/y). In general, Nurra (NW) and Campidano plain (SW) together with the Coghinas basin (N), are the dri- est zones, while the most rainy regions are the central part of Gallura (Mount Limbara), Barbagia and west Ogliastra (Gennargentu massif) (Camarda et al. 2015).
However, a summer period of aridity (at least 3 months), with very low precipitation, characterizes the whole is- land, marking Sardinian climate as typical eutemperate-dry Mediterranean (Rivas-Martinez 2008).
Response variables
For this study, we selected nine taxa for which at least 15 occurrence records were available. Occurrence data were obtained from both herbaria (Detailed list in supplementary materials S1), and field surveys, carried out between 02/2012 and 06/2017. As far as herbarium specimens are concerned, georeferencing was made a posteriori by using QGIS (QGIS 2016) software (2.18.6 “Las Palmas” version 2016). Field ob-“Las Palmas” version 2016). Field ob-). Field ob- servations were georeferenced by means of a portable GPS (Garmin GPS 12CXTM).
The dataset contains data for nine species: Anacamptis longicornu (36 records), A. papilionacea var. grandiflora
(19 records), A. papilionacea var. papilionacea (29 records), Ophrys bombyliflora (17 records), O. morisii (21 records), O. tenthredinifera (27 records), O. speculum (20 records), Serapias lingua (22 records), S. parviflora (16 records). The full dataset is reported as supplementary material (Electronic Supplement, Table S0). To avoid autocorrelation, two records of Ophrys speculum were excluded from the initial dataset.
Predictor variables
19 bioclimatic variables were obtained from the WorldClim dataset (Hijmans et al. 2005, O’Donnel and Ignizio 2012), with a spatial resolution of 30 arcsec (0.83 × 0.83 = 0.69 km2 ca. at our latitude), in the form of raster lay- ers.
Spearman correlation was applied to identify the vari- ables which were significantly correlated (“corrplot” R pack- age, Wei and Simko 2017). Variables were considered col- linear when r > 0.8 with a p-value < 0.01. Thus, they were ranked on the basis of the number of significant correlations, and redundant variables (those correlated with the high- est number of other predictors) were excluded from further computation, in order to avoid multicollinearity in the set of predictors. Furthermore, the selection of redundant variables to exclude was also based upon the expert-based knowledge on the general physiology and ecology of orchids, and on the autecology of the investigated taxa. Thus, the total number of bioclimatic predictors was reduced to 8, in Table 1 codes for bioclimatic variables refer to WorldClim classification (cor- relation plot in Electronic Supplement, Figure S0).
In order to predict the evolution of orchid populations in the future, bioclimatic variables were retrieved also for year 2070. These rasters have been produced by using the global circulation model HadGEM2-ES (Hadley Global Environment Model 2 - Earth System, Collins et al. 2008), with representative concentration pathway (RCPs) 4.5 (Thomson et al. 2011).
Other three predictors were added, namely altitude (ob- tained from WorldClim as well), soil type and land use (both obtained from the Ecopedological Map of Italy; ISPRA 2005). These categoric predictors were transformed into ras-
ters with the same extent and resolution as the bioclimatic predictors starting from the raw data maps, and extracting the corresponding attributes, cell by cell, using the category value of the polygon which occupies the centre of the cell.
The rasters of all predictors were cropped to the study area (“raster” R package, Hijmans and Etten 2012), which extent ranges from 7.691667 to 9.983333 DD longitude, and 38.675 to 41.33333 DD latitude (SR WGS84).
Data analysis
Environmental niche models
The spatial distribution of each species was analysed with three well established algorithms: Random Forest, a regres- sion method which uses classification trees (RF; Cutler et al. 2007), Generalized Linear Model, a classic linear regres- sion model (GLM; Elith et al. 2006, Guisan et al. 2006), and Generalized Additive Model (GAM; Hastie and Tibshirani 1990). Since different algorithms can provide similar predic- tions, with slight (but sometimes relevant) differences, the re- sulting models were combined in an ensemble, which averag- es their results on the basis of individual model performance scores, for obtaining a more reliable prediction (Araújo and New 2007, Merow et al. 2013).
Since the use of presence-only data can bias the analysis and lead to unrealistic predictions, pseudo-absences (i.e., in- ferred absence data based on the information available about the presence locations of the species; Chefaoui and Lobo 2008, Phillips et al. 2009) were generated for informing mod-Phillips et al. 2009) were generated for informing mod-) were generated for informing mod- els about locations in which species do not occur: a simple random sampling was chosen, with a ratio of 10 to 1 pseudo- absence / presence data (Barbet-Massin et al. 2012).
True Skill Statistic (TSS) was adopted as validation met- ric (Allouche et al. 2006). TSS is based on the measures of sensitivity and specificity of the model. Sensitivity is the proportion of real occurrences predicted by the model, while specificity is the proportion of real absences predicted by the model. TSS value (Sensitivity + Specificity – 1) substantially measures the ability of the model to discriminate between oc- currence and non-occurrence of an event. A model is consid- ered good with TSS > 0.6. Models were generated using 80%
of presence data for training, and 20% for testing. Hence, in each of the 20 replication runs which were executed for each model, 80% of presence data were used to develop the mod- el, and 20% for testing its sensitivity. Pseudo-absences ratio was set at 10:1 to presence data (Barbet- Massin et al. 2012).
Beta multiplier was adjusted to 2 (Moreno-Amat et al. 2015, Shcheglovitova and Anderson 2013).
Models were merged by using an ensemble approach (Araújo and New 2007, Merow et al. 2013). Since there are no specific guidelines for selecting the models for the ensem- ble (i.e., which models to exclude from the averaging process in order to obtain a reliable output), the performance thresh- old was used as selection method. All the models with a true skill statistics (TSS) value lower than 0.6 (the threshold sug- Table 1. Predictor variables selected for developing the models
after a Spearman correlation test (correlation plot is shown in Supplementary Materials, Fig. S0).
Variable Description
BIO1 Annual Mean Temperature BIO4 Temperature Seasonality
BIO5 Max Temperature of Warmest Month BIO6 Min Temperature of Coldest Month BIO12 Annual Precipitation
BIO13 Precipitation of Wettest Month BIO15 Precipitation Seasonality BIO19 Precipitation of Coldest Quarter
gested in previous works, e.g., Araújo et al. 2005, Engler et al.
2011) were excluded from further computations.
R software (R Core Team 2016) was used for all analyses.
The final ensemble was obtained by using the Biomod2 R package (Thullier et al. 2016).
Results
The variables, ordered according to the importance score for each taxon, are listed in Table 2.
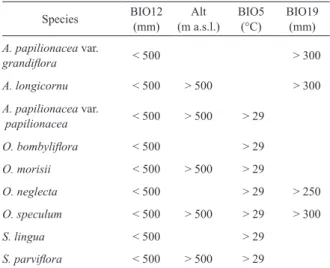
Annual precipitation (BIO12) is the most influencing var- iable for most species (which require a total precipitation of at most 500 mm/year) but Anacamptis papilionacea var. papil- ionacea; altitude scores second, strongly influencing 5 out of nine taxa. The maximum temperature of warmest month (BIO5), and the precipitation of coldest quarter (BIO19) scores third. As detailed in Table 3, these variables depict an environmental limit for the distribution of taxa.
Altitude is a relevant predictor for 5 taxa (Anacamptis longicornu, A. papilionacea var. papilionacea, Ophrys morisii, O. speculum, Serapias parviflora), which seem to have a higher suitability at altitudes higher than 500 meters.
As far as the other 4 taxa are concerned, they are normally restricted to lower altitudes, even if records above 1000 m are reported.
While all the taxa do require high temperature in the sum- mer, Anacamptis papilionacea var. grandiflora, A. longicor- nu, Ophrys tenthredinifera, O. speculum and Serapias lingua differ from the other taxa since they are not much influenced by the maximum temperature of the warmest month; at the same time, they do require an amount of precipitation in the coldest quarter higher than 250-300 mm, while other taxa are not much influenced by this variable.
Explanation of model output
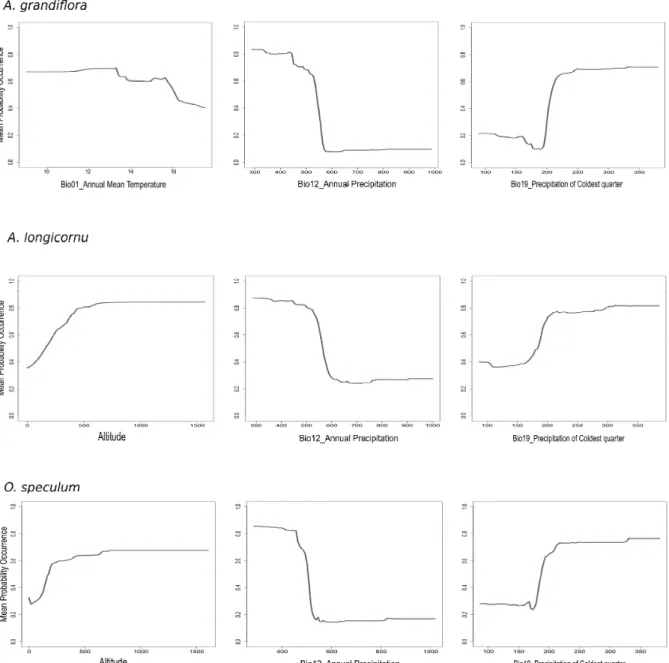
The models for Anacamptis papilionacea var. grandi- flora, A. longicornu and Ophrys speculum project a climatic niche defined by limited precipitations (lower than 600 mm), occurring mostly during the cold season (more than 150 mm).
Anacamptis papilionacea var. grandiflora seems to occur in areas with 13-15°C annual mean temperature, while A. lon- gicornu and Ophrys speculum niche is more influenced by altitude (Figure 1).
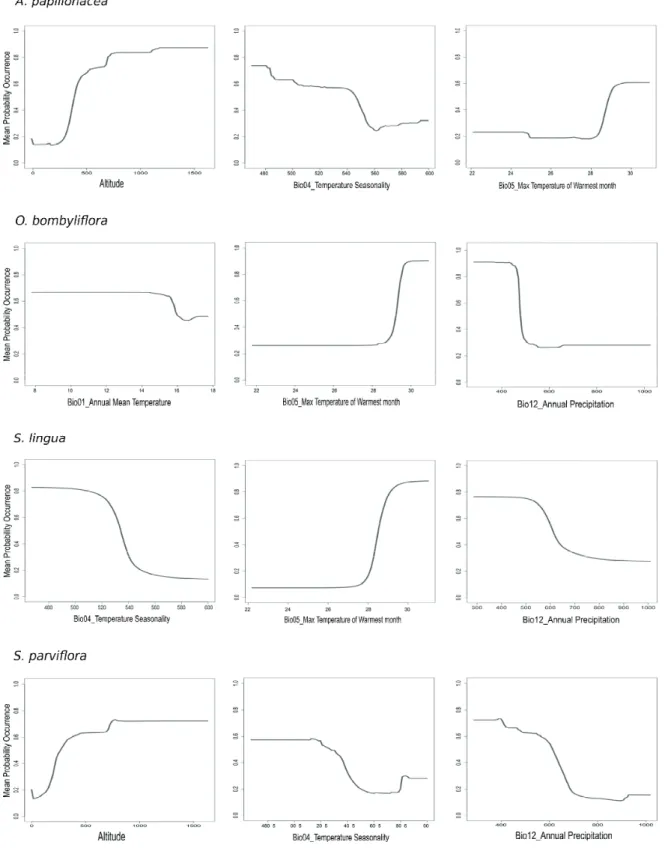
Ophrys bombyliflora and Serapias lingua are projected to require high temperatures in summer (>28°C). However, Ophrys bombyliflora is also related to a mean annual tempera- ture lower than 16°C, and hence differs from Serapias lingua, which does not tolerate high seasonal excursions. Both the Table 2. Predictor variables ordered for importance for each taxon, scored from 1 (more influencing) to 11 (less influencing).
Species BIO12 Alt BIO5 BIO19 BIO1 BIO4 BIO6 BIO13 BIO15 Soil Land use
A. papilionacea var. grandiflora 1 4 9 2 3 7 8 5 6 10 11
A. longicornu 1 3 5 2 6 7 6 4 5 10 11
A. papilionacea var. papilionacea 4 2 3 5 8 1 7 6 9 10 11
O. bombyliflora 1 6 2 5 3 8 7 4 9 11 10
O. morisii 1 3 2 4 8 5 7 6 9 10 11
O. neglecta 1 5 6 3 7 4 2 8 9 11 10
O. speculum 1 3 6 2 4 9 5 8 7 11 10
S. lingua 2 5 1 6 7 3 4 8 9 10 11
S. parviflora 1 2 5 4 8 3 7 6 9 11 10
Table 3. Limits to the distribution of each taxon as depicted by the most influencing predictor variables. These values were ob- tained from response curves built during the modelling proce- dure, they show the probability of presence against the variation of a specific variable.
Table 4. Percentual gain and loss of climatic niche, and net gain, with respect to current conditions.
Species BIO12
(mm) Alt
(m a.s.l.) BIO5
(°C) BIO19 (mm) A. papilionacea var.
grandiflora < 500 > 300
A. longicornu < 500 > 500 > 300 A. papilionacea var.
papilionacea < 500 > 500 > 29
O. bombyliflora < 500 > 29
O. morisii < 500 > 500 > 29
O. neglecta < 500 > 29 > 250
O. speculum < 500 > 500 > 29 > 300
S. lingua < 500 > 29
S. parviflora < 500 > 500 > 29
Species Loss % Gain % Change %
A. papilionacea var.
grandiflora 47.57 67.68 20.12
A. longicornu 13.59 228.05 214.46
A. papilionacea var.
papilionacea 14.68 229.11 214.43
O. bombyliflora 13.00 231.08 218.09
O. morisii 5.54 274.62 269.08
O. neglecta 34.84 129.86 95.02
O. speculum 23.89 132.20 108.31
S. lingua 10.26 222.43 212.17
S. parviflora 20.76 169.66 148.90
species are restricted to areas with a relatively limited amount of annual precipitation, with a maximum of ca. 500 mm.
Anacamptis papilionacea var. papilionacea seems to have the same requirements as far as high temperature in summer is concerned, and has a similar response to temperature sea- sonality as Serapias lingua and S. parviflora. The latter seems to have the same requirement in terms of annual precipitation as Ophrys bombyliflora and Serapias lingua. Furthermore, Serapias parviflora shares with Anacamptis papilionacea var.
papilionacea a reduced distribution at lower altitudes (< 150- 200 m), with an optimum over 800 m (Figure 2).
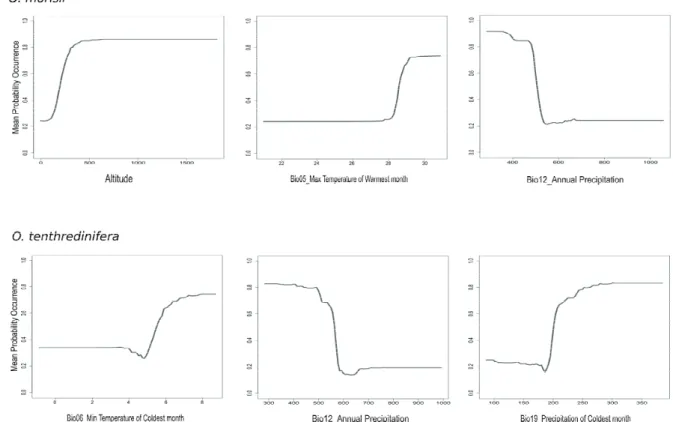
Ophrys morisii is another species that requires high tem- peratures in the warmest months (>28°C), and which has a lim- ited distribution at lower altitudes (<100 m). It has also a lim-
ited fitness when annual precipitation is higher than 500 mm, a feature it shares with the congeneric O. tenthre dinifera. The latter however, does require a warm (mean temperature >7°C) and more rainy (300 mm) cold season (Figure 3).
Distribution under a climate change scenario
The change in habitat suitability is projected to range from ca. 20% up to ca. 270% in future projections (Table 4).
The general trend is an increase of the size of the suit- able area for the majority of the analysed species, even if with different probability of occurrence (see later). Except for Anacamptis papilionacea var. grandiflora, the percentage loss of occupied area is generally 10-fold lower than the gain.
24 473 474 475 476
Figure 1. Response variables graphs for the three most important predictors as far as Anacamptis papilionacea var.
477
grandiflora, A. longicornu and Ophrys speculum are concerned. The y- axis correspond to mean probability of 478
presence, x- axis represent the variables values (mm for precipitation, °C for temperatures, % for seasonality).
479 480
Figure 1. Response variables graphs for the three most important predictors as far as Anacamptis papilionacea var. grandiflora, A.
longicornu and Ophrys speculum are concerned. The y-axis corresponds to mean probability of presence, the x-axis represents the vari- ables values (mm for precipitation, °C for temperature, % for seasonality).
24 473 474 475 476
Figure 1. Response variables graphs for the three most important predictors as far as Anacamptis papilionacea var.
477
grandiflora, A. longicornu and Ophrys speculum are concerned. The y- axis correspond to mean probability of 478
presence, x- axis represent the variables values (mm for precipitation, °C for temperatures, % for seasonality).
479 480
A. papilionacea var. grandiflora is the taxon with lower net gain (ca. 20%) in comparison with the current distribution; O.
morisii is the species with potentially the highest enlargement of climatically suitable area (269%).
Suitability maps
Suitability maps (Supplementary material, Figures S1-3) are reported for current and future (2070) climatic conditions.
Figure 2. Response variables graphs for the three most important predictors as far as Anacamptis papilionacea var. papilionacea, Ophrys bombyliflora, Serapias lingua and S. parviflora are concerned. The y-axis corresponds to mean probability of presence, the x- axis represents the variables values (mm for precipitation, °C for temperature, % for seasonality).
25 481 482
Predicted suitability ranges from 0 (not suitable, blue) to 1 (highly suitable, red).
Anacamptis papilionacea var. grandiflora (Figure S1a) is depicted as occurring with high suitability mostly in the south-east and south westernmost part of the island. Another spot of high suitability is present in the north-western part of the island, immediately north of the town of Alghero. A. lon- gicornu (Figure S1b) has a similar potential distribution, but has a high suitability only in the south-eastern part of the is- land. Serapias lingua (Figure S1c), on the contrary, has a high suitability also along the western coast. In the future scenario, all these species seem to widen their suitable area especially in the west side of the island. However, Anacamptis papil- ionacea var. grandiflora seems to have a reduced probability of occurrence, maintaining limited areas of high suitability only in the southernmost parts of the island.
Anacamptis papilionacea var. papilionacea, Serapias parviflora, Ophrys bombyliflora and O. morisii (Figures S2a- d) are depicted as occurring with high suitability mostly in the south-easternmost part of the island. In the future scenario, all these species are projected to expand their distribution to almost all the island, with high suitability especially in the north-western part.
Ophrys tenthredinifera and O. speculum, currently given as occurring with high suitability in the southern part of the island (Figures S3a,b), are projected to have a widening of the suitable area, but coupled with a decrease of suitability
scores, with areas of high suitability limited to the southern- most parts of the island.
Discussion
From our analysis, all the nine orchid taxa are projected to have an expansion of their distributional range in the island.
However, areas of high suitability (>0.8), indicating areas in which the taxa will almost certainly occur, will decrease for at least two of them.
Most of the species which have a high suitability in areas with low average yearly precipitation, Anacamptis longicor- nu, Ophrys bombyliflora, O. morisii, O. speculum, Serapias lingua and S. parviflora, are projected to have a widening of their areas of high suitability (>0.8).
Anacamptis papilionacea var. papilionacea is also pro- jected to increase its area of high suitability, since it is posi- tively influenced by high temperatures in the warmest month, which will increase in the future scenarios. However, inter- annual variability is foreseen to increase in future scenarios, with a deepening of differences between winter and spring.
In the western parts of Sardinia the humid winds from the Mediterranean could mitigate this effect. Hence, Anacamptis papilionacea var. papilionacea is projected to increase its areas of high suitability in the western part of the island.
Anacamptis papilionacea var. grandiflora is known to occur only in Sardinia and Sicily, and it is normally restricted to lower altitudes, even if records above 1000 m are reported.
Figure 3. Response variables graphs for the three most important predictors as far as Ophrys morisii and O. tenthredinifera are con- cerned. The y-axis corresponds to mean probability of presence, the x-axis represents the variables values (mm for precipitation, °C for temperature, % for seasonality).
26 488 489 490 491 492 493 494 495 496 497 498 499
Figure 3. Response variables graphs for the three most important predictors as far as Ophrys morisii and O.
500
tenthredinifera are concerned. The y- axis correspond to mean probability of presence, x- axis represent the variables 501
values (mm for precipitation, °C for temperatures, % for seasonality).
502 503
Ophrys bombyliflora, O. tenthredinifera and Serapias lingua have a similar ecology, and are known to sporadically occur up to ca. 1000 m, while the latter could sporadically grow up to 1500 m.
Anacamptis papilionacea var. grandiflora and Ophrys tenthredinifera are projected to have a relevant reduction of their areas of higher suitability, in spite of a widening of their potential distribution area in the island. The former is pro- jected to reduce its suitability especially in the north-western part of the island, and, together with the latter, will maintain high suitability values only in the southern part of Sardinia.
Both species are especially limited by the precipitation in the coldest season, if over 200 mm. Anacamptis papilionacea var. grandiflora is also projected to be limited by a general increase in yearly mean temperature, since it is projected to have a higher suitability in areas with an average yearly temperature lower than 16°C. On the contrary, an increase of average temperature should not affect particularly Ophrys tenthredinifera, which is projected to have a higher suitability in areas with warmer winters especially in South Sardinia, where summer is hotter and drier, and a small amount of rain is mostly occurring in autumn and winter. Hence, this area could remain suitable to this species also in future scenarios.
In fact, in future forecasts, climate change will lead to an increase of the average temperature, with an increase of seasonality, and to a decrease of precipitation, especially in the warm season (Giorgi and Lionello 2008). These changes will lead to possible climatic and ecological limitations to the distribution and survival of several orchid taxa.
Some of these limitations might be: a deficiency of pre- cipitation during the coldest months, which can prevent the correct development of the roots, as well as the storage of enough nutrients to sustain the vegetative phase of the life cycle of several orchids (Tatarenko and Kondo 2003); an increased temperature seasonality, which could expose the seedlings to freezing during the cold period, and to heat shock, if the hot season will not be preceded by a mild spring as acclimatization period (Pfeifer et al. 2006); too high tem- peratures during the hottest months, which could limit several orchids in closing their seasonal vegetative cycle in an opti- mal way (Rasmussen 1995, Wells and Cox 1989).
A progressive establishment of such ecological and cli- matic conditions could thus cause a generalized change of distribution of orchid taxa towards areas in which suitable mi- croclimatic conditions do occur. Furthermore, as a response to different climatic conditions, orchids could also anticipate all the phases of their vital cycle (dormancy, vegetative phase, blooming season and fructification). However, since orchids are almost exclusively entomogamous, this could lead to a non-optimal timing between the blooming season and the seasonal activity of pollinators.
Climate change is projected to have a strong influence on distribution and suitability in the Sardinian taxa we investi- gated: some species are projected to have a wider distribu- tion, with increased suitability in several parts of the island, while some others will reduce their suitability, and will be- come restricted to smaller areas.
The effects of these changes are complex to forecast, however. Changes in ecological conditions could affect all those populations which will not be able to escape the new – hostile – ecological conditions. Furthermore, a “mass move- ment” of other orchid's populations following changed eco- logical conditions could eventually lead to a niche overlap in the future, which could lead to: competition among taxa, and the eventuality of the loss of less adapted ones; hybridiza- tion among sympatric taxa. Hybridization could increase lo- cal biodiversity, if it produces new, independent taxonomical entities, while maintaining the “parental taxa”. On the other hand, it could decrease local biodiversity if, in the process that lead to the stabilization of the new hybrid entities, the
“parental taxa” disappear.
The results of this work could be of interest when plan- ning climate change adaptation strategies, especially when protection of biodiversity is concerned. In Italy, a national directive for the protection of plants is missing, while there are 10 orchids listed in the red list of the vascular flora (Rossi et al. 2013).
Nonetheless, analysed species are the commonest in the study area and they have not been evaluated by the IUCN Species Survival Commission. According to the IUCN red list criteria for evaluation of threatened species (mainly relied on expected population size reduction and geographic range compression in the next 10 years; IUCN Red List Categories and Criteria 3.1, 2012), these species are not to be consid- ered as endangered. Despite their conservation status, how- ever, this work represents an important starting point for an effective monitoring of the effect of future environmental disturbances. Sardinia, while being an important hotspot for the family (Mittermeier et al. 2004), is also missing proper directives as far as both flora and fauna are concerned. Since planning proper conservation frameworks require reliable scientific data, studies like the present could allow an optimal evaluation of the current and future status of these taxa, and hence to better address conservation and management efforts.
Acknowledgements: We thank Prof. P. Borges and anony- mous reviewers for valuable comments that improved the manuscript. We want to thank also A. Caredda for the help given in data collection.
References
Allouche, O., A. Tsoar and R. Kadmon. 2006. Assessing the accur- ance of species distribution models: prevalence, kappa, and True Skill Statistic (TSS). J. Appl. Ecol. 43:1223–1232.
Araújo, M.B., R.G. Pearson, W. Thuiller and M. Erhard. 2005.
Validation of species–climate impact models under climate change. Glob. Change Biol. 11:1504–1513.
Araújo, M.B. and M. New. 2007. Ensemble forecasting of species distribution. Trends Ecol. Evol., 22/ 1.
Arrigoni, P.V. 2006. Flora dell'isola di Sardegna (Vol. 1-6). Carlo Delfino Editore, Sassari, IT.
Attorre, F., M. De Sanctis, A. Farcomeni, A. Guillet, E. Scepi, M.
Vitale, F. Pella and M. Fasola. 2013. The use of spatial ecological
modelling as a tool for improving the assessment of geographic range size of threatened species. J. Nat. Conserv. 21:48–55.
Barbet-Massin, M., F. Jiguet, C.H. Albert and W. Thuiller. 2012.
Selecting pseudo-absences for species distribution models: how, where and how many? Methods Ecol. Evol. 3:327–338.
Brigham, C.A. and M.W. Swartz. 2003. Population Viability in Plants: Conservation, Management, and Modeling of Rare Plants. Springer, Berlin.
Camarda, I., L. Laureti, P. Angelini, R. Capogrossi, L. Carta and A. Brunu. 2015. Il Sistema Carta della Natura della Sardegna.
ISPRA- Serie Rapporti: 222.
Carmignani, L., G. Oggiano, A. Funedda, P. Conti, S. Pasci and S.
Barca. 2008. Carta Geologica della Sardegna in scala 1:250.000.
Litografica Artistica Cartografica, Firenze, IT.
Castañeda-Álvarez, N.P., S. De Haan, H. Juárez, C.K. Khoury, H.A.
Achicanoy and C.C. Sosa. 2015. Ex situ conservation priorities for the wild relatives of potato (Solanum L. Section Petota).
PLoS ONE 10(4): e0122599.
Chefaoui, R.M. and J.M. Lobo. 2008. Assessing the effects of pseu- do-absences on predictive distribution model performance. Ecol.
Model. 210(4):478–486.
Collins, W.J., N. Bellouin, M. Doutriaux-Boucher, N. Gedney, T.
Hinton, C.D. Jones, S. Liddicoat, G. Martin, F. O’Connor, J.
Rae, C. Senior, I. Totterdell, S. Woodward, T. Reichler and J.
Kim. 2008. Evaluation of the HadGEM2 model. Hadley Centre Technical note 74, Met Office Hadley Centre, Exter, UK.
Christenhusz, M.J.M. and J.W. Byng. 2016. The number of known plants species in the world and its annual increase. Phytotaxa 261(3):201–217.
Cronquist, A. 1981. An Integrated System of Classification of Flowering Plants. Columbia University Press, New York.
Cutler, D.R., T.C. Edwards, K.H. Beard, A. Cutler, K.T. Hess, J.
Gibson and J.J. Lawler. 2007. Random Forest for a classification in Ecology. Ecology 88 (11):2783–2892.
Delforge, P. 2006. Orchids of Europe, North Africa and the Middle East (Vol. 1–6). A&C Black Ltd. Publishers, London UK.
Elith, J., C.H. Graham, R.P. Anderson, M. Dudik, S. Ferrier, A. Guisan, R.J. Hijmans, F. Huettmann, J.R. Leathwick, A. Lehmann, J. Li, G. Lohmann, B.A. Loiselle, G. Manion, C. Moritz, M.
Nakamura, Y. Nakazawa, J. Mc Overton, A. Townsend Peterson, S.J. Phillips, K. Richardson, R. Scachetti- Pereira, R.E. Schapire, J. Soberón, S. Williams, M.S. Wisz and N.E. Zimmermann.
2006. Novel methods improve prediction of species’ distribu- tions from occurrence data. Ecography 29:129–151.
Engler, R., C.F. Randin, W. Thuiller, S. Dullinger, N.E. Zimmermann, M.B. Araújo, P.B. Pearman, G. Le Lay, C. Piedallu, C.H. Albert, P. Choler, G. Coldea, X. De Lamo, T. Dirnböck, J. Gégout, D.
Gómez-García, J. Grytnes, E. Heegaard, F. Høistad, D. Nogués- Bravo, S. Normand, M. Puşcaş, M. Sebastià, A. Stanisci, J.
Theurillat, M.R. Trivedi, P. Vittoz and A. Guisan. 2011. 21st cen- A. Guisan. 2011. 21st cen-21st cen- tury climate change threatens mountain flora unequally across Europe. Glob. Change Biol. 17:2330–2341.
Fois, M., G. Fenu, E.M. Cañadas and G. Bacchetta. 2017.
Disentangling the influence of environmental and anthropogenic factors on the distribution of endemic vascular plants in Sardinia.
PLoS ONE 12(8):e0182539.
Giorgi, F. and P. Lionello. 2008. Climate change projections for the Mediterranean region. Global Planet. Change 63:90–104.
Gritti, E.S., B. Smith and M.T. Sykes. 2006. Vulnerability of Mediterranean Basin ecosystems to climate change and invasion by exotic plant species. J. Biogeogr. 33:145–157.
Guisan, A., O. Broennimann, R. Engler, M. Vust, N.G. Yoccoz, A.
Lehmann and N.E. Zimmermann. 2006 Using niche-based models to improve the sampling of rare species. Conserv. Biol.
20(2):501–511.
Hastie, T. and R. Tibshirani. 1990. Exploring the nature of co- variate effects in the proportional hazards model. Biometrics 46(4):1005–1016.
Hijmans, R.J., S.E. Cameron, J.L. Parra, P.G. Jones and A. Jarvis.
2005. Very high resolution interpolated climate surfaces for global land areas. Int. J. Climatol. 25:1965–1978.
Hijmans R.J. and J. van Etten. 2012. raster: Geographic and model- ing with raster data. R package version 2.0-12.
Hutchings, M.J. 2010. The population biology of the early spider orchid Ophrys sphegodes Mill. III. Demography over three de-Demography over three de- cades. J. Ecol. 98:867–878.
ISPRA-Geoportale nazionale, Carta ecopedologica d’Italia, Map, 1:250.000, 2005. (http://www.pcn.minambiente.it/geoportal/
catalog/ )
IUCN-International Union for Conservation of Nature. 2012. IUCN Red List Categories and Criteria: Version 3.1, Second edition.
32pp. Gland, Switzerland and Cambridge, UK.
Jump, A.S. and J. Peñuelas. 2005. Running to stand still: adaptation and the response of plants to rapid climate change. Ecol. Lett. 8:
1010–1020.
Kolanowska, M. 2013. Niche Conservatism and the Future Potential Range of Epipactis helleborine (Orchidaceae). PLoS ONE 8(10):e77352.
Kolanowska, M. and K. Konowalik. 2014. Niche conservatism and future changes in the potential area coverage of Arundina graminifolia, an invasive orchid species from Southeast Asia.
BioTropica 46(2):157–165.
Lai, R. 2009. Le orchidee della Sardegna. Tiemme officine grafiche s.r.l., Cagliari, IT.
Loizidou, M., C. Giannakopoulos, M. Bindi and K. Moustakas.
2016. Climate change impacts and adaptation options in the Mediterranean basin. Reg. Environ. Change 16:1859–1861 Mansion, G., G. Rosenbaum, N. Schoenenberger, G. Bacchetta, J.A.
Rosselló and E. Conti. 2008. Phylogenetic analysis informed by geological history supports multiple, sequential invasions of the Mediterranean Basin by the angiosperm family Araceae. Syst.
Biol. 57(2):269–285.
Merow, C., M.J. Smith and J.A. Silander. 2013. A practical guide for modelling species distributions: what it does, and why inputs and settings matter. Ecography 36:1058–1069.
Mittermeier, R.A., P.R. Gil, M. Hoffmann, J. Pilgrim, T. Brooks, C.G.
Mittermeier, J. Lamoreux and G.A.B. Fonseca. 2004. Hotspots revisited: Earth’s biologically richest and most endangered terrestrial ecoregions. Cemex Conservation International and Agrupación Sierra Madre. Mexico City, MEX.
Moreno-Amat, E., R.G. Mateo, D. Nieto-Lugilde, N. Morueta- Holme, J. Svenning and I. García-Amorena. 2015. Impact of model complexity on cross-temporal transferability in Maxent species distribution models: an assessment using paleobotanical data. Ecol. Model. 312:308–317.
O’Donnell, M.S. and D.A. Ignizio. 2012. Bioclimatic predictors for supporting ecological applications in the conterminous United States. U.S. Geological Survey Data Series 691.
Pfeifer, M., K. Wiegand, W. Heinrich and G. Jetschke. 2006. Long- term demographic fluctuations in an orchid species driven by weather: implications for conservation planning. J. Appl. Ecol.
43:313–324.
Phillips, S.J., M. Dudík, J. Elith, C.H. Graham, A. Lehmann, J.
Leathwick and S. Ferrier. 2009. Sample selection bias and pres- ence-only distribution models: implications for background and pseudo-absence data. Ecol. Appl. 19(1):181–197.
Pitman, N.C.A. and P.M. Jørgensen. 2002. Estimating the size of the world's threatened flora. Science 298(5595):989.
QGIS Development Team, 2016, Version “Las Palmas”. QGIS Geographic Information System. Open Source Geospatial Foundation Project.
Rasmussen, H.N. 1995. Terrestrial Orchids from Seed to Mycotrophic Plant. Cambridge University Press, Cambridge, UK.
R Core Team. 2016. R: A language and environment for statisti- cal computing. version 3.3.3. R Foundation for Statistical Computing, Vienna, Austria.
Reid, P.C., D.G. Johns, M. Edwards, M. Starr, M. Poulin and P.
Snoeijs. 2007. A biological consequence of reducing Arctic ice cover: arrival of the Pacific diatom Neodenticula seminae in the North Atlantic for the first time in 800 000 years. Glob. Change Biol. 13:1910–1921.
Rivas-Martinez, S. 2008. Global bioclimatics (Clasificación Bioclimática de la Tierra). http://www.globalbioclimatics.org.
Rossi, G., G. Montagnani, D. Gargano, L. Peruzzi, T. Abeli, S.
Ravera, A. Cogoni, G. Fenu, S. Magrini, M. Gennai, B. Foggi, R.
P. Wagensommer, G. Venturella, C. Blasi, F.M. Raimondo and S.
Orsenigo. 2013. Lista rossa della flora italiana. 1. Policy species e altre specie minacciate. Comitato Italiano IUCN e Ministero dell'Ambiente e della tutela del Territorio e del Mare. Roma, IT.
Shcheglovitova, M. and R.P. Anderson. 2013. Estimating optimal complexity for ecological niche models: A jackknife approach for species with small sample sizes. Ecol. Model. 269:9–17.
Sletvold, N., J. Dahlgren, D. Øien, A. Moen and J. Ehrlén. 2013.
Climate warming alters effects of management on population vi- ability of threatened species: results from a 30-year experimental study on a rare orchid. Glob. Change Biol. 19(9):2729–2738.
Tatarenko, I.V. and K. Kondo. 2003. Seasonal development of annual shoots in some terrestrial orchids from Russia and Japan. Plant Spec. Biol. 18:43–55.
Thomson, A.M., K.V. Calvin, S.J. Smith, G.P. Kyle, A. Volke, P. Patel, S. Delgado-Arias, B. Bond-Lamberty, M.A. Wise, L.E. Clarke and J.A. Edmonds. 2011. RCP4.5: a pathway for stabilization of radiative forcing by 2100. Climatic Change. 109:77–94.
Thuiller W., D. Georges, R. Engler and F. Breiner. 2016. biomod2:
ensemble platform for species distributions modeling- R pack- age version 3.3–7.
Vacchi, M., C. Morri, M. Modena, G. La Mesa and C. Nike Bianchi.
2001. Temperature changes and warm-winter species in the Ligurian sea: the case of the ornate wrasse Thalassoma pavo (Linnaeus, 1758). Arch. Oceanogr. Limnol. 22:149–154.
Vollering, J., A. Schuiteman, E. de Vogel, R. van Vugt and N. Raes.
2015. Phytogeography of New Guinean orchids: patterns of spe- cies richness and turnover. J. Biogeogr. 43(1):204–214.
Walther, G.R., E.S. Gritti, S. Berger, T. Hickler, Z. Tang and M.
T. Sykes. 2007. Palms tracking climate change. Global Ecol.
Biogeogr. 16:801–809.
Walther, G.R., A. Roques, P.E. Hulme, M.T. Sykes, P. Pyšek, I. Kühn, M. Zobel, S. Bacher, Z. Botta-Dukát, H. Bugmann, B. Czúcz, J.
Dauber, T. Hickler, V. Jarošík, M. Kenis, S. Klotz, D. Minchin, M. Moora, W. Nentwig, J. Ott, V.E. Panov, B. Reineking, C.
Robinet, V. Semenchenko, W. Solarz, W. Thuiller, M. Vilà, K.
Vohland and J. Settele. 2009. Alien species in a warmer world:
risks and opportunities. Trends Ecol. Evol. 24(12).
Wang, T., G. Wang, J. Innes, C. Nitschke and H. Kang. 2016.
Climatic niche models and their consensus projections for future climates for four major forest tree species in the Asia–Pacific region. Forest Ecol. Manag. 360:357–366.
Wei T. and V. Simko. 2017. Visualization of a Correlation Matrix-R package version 0.84.
Wells, T.C.E. and R. Cox. 1989. Predicting the probability of the bee orchid (Ophrys apifera) flowering or remaining vegetative from size and number of leaves. In: H. W. Pritchard (ed.), Modern Methods in Orchid Conservation. Cambridge University Press, Cambridge, UK. pp. 127-140.
Wilcove, D.S., D. Rothstein, J. Dubow, A. Phillips and E. Losos.
1998. Quantifying threats to imperiled species in the United States. BioScience 48:607–615.
Received April 12, 2018 Revised June 8, June 22, 2018 Accepted June 23, 2018 Supplementary material
Table S0. Occurrence dataset of the nine species modelled.
Figure S0. Correlation plot of climatic predictor variables, colour intensity indicates high rho values.
Figure S1. Suitability maps for Anacamptis papilionacea var.
grandiflora (a), A. longicornu (b) and Serapias lingua (c).
Figure S2. Suitability maps for Anacamptis papilionacea var.
papilionacea (a), Serapias parviflora (b), Ophrys bombyliflo- ra (c) and O. morisii (d).
Figure S3. Suitability maps for Ophrys tenthredinifera (a) and O. speculum (b).
The files may be downloaded from www.akademiai.com.
Open Access. This article is distributed under the terms of the Creative Commons Attribution 4.0 International License (https://creativecommons.org/licenses/by/4.0/), which permits unrestricted use, distribution, and reproduction in any medium, provided the original author and source are credited, you give a link to the Creative Commons License, and indicate if changes were made.