DOI: 10.1556/606.2018.13.1.11 Vol. 13, No. 1, pp. 125–136 (2018) www.akademiai.com
MODELING OF GROUNDWATER EXTRACTION FROM WELLS TO CONTROL EXCESSIVE WATER
LEVELS
1 Zinaw Dingetu SHENGA, 2 Dana BAROKOVÁ, 3 Andrej ŠOLTÉSZ
Department of Hydraulic Engineering, Faculty of Civil Engineering Slovak University of Technology in Bratislava, Slovakia
1zinaw.shenga@stuba.sk, 2dana.barokova@stuba.sk, 3andrej.soltesz@stuba.sk
Received 31 December 2016; accepted 6 November 2017
Abstract: The overall purpose of this research was to model flow extraction from several groundwater network wells to control the excessive level of groundwater. The study was conducted in the Nitra Industrial Park, which is located in the northern part of the town of Nitra, where the confined groundwater table is situated very close to the terrain. The area of interest is a plain with a mean elevation of 140.0 m a.s.l. The groundwater can rise up to 140.5 and 143.0 m a.s.l. during the dry season, extreme climate conditions, or a flood wave in the Nitra River, respectively. In order to keep the level of the piezometric head below 140.0 m a.s.l. (as requested by the investor), there are already 38 wells realized around the area of interest with the proposed pumping rates.
The numerical groundwater modeling was applied using the TRIWACO simulation package for the given hydrological, geological and hydro-geological conditions. The transient simulation takes into account a Q1000 historical discharge in the Nitra River and its possible impact on the groundwater. The paper will present numerical modeling results on the design of a drawdown system to lower the groundwater level to an acceptable elevation as well as parameters and uncertainties for the design purpose.
Keywords: Groundwater drawdown, Piezometric head, Pumping well system, Transient simulation, TRIWACO
1. Introduction
The level of the groundwater around the town of Nitra has the potential to rise very close to the terrain. For any kind of construction that is going to be implemented around this region, it is essential to consider the impact of the groundwater regime on the
proposed structures. On the other hand, groundwater is a pervasive and vulnerable natural resource. Thus, it is necessary to consider different mitigations in order to protect and sustain this valuable resource and the ecosystems that are dependent on groundwater and to overcome problems due to salinization and pollution.
Nitra Industrial Park is a big project, which is already under construction in the northern part of the town of Nitra. The investor of the park wanted to keep the groundwater level below 140 m a.s.l. everywhere in the vicinity of the park. Hence, the TRIWACO simulation package was used to design a groundwater drawdown and pumping rate from the proposed well systems based on geological, hydrological and hydrogeological data obtained from different companies and institutes. Based on the data obtained, different simulations were performed for both steady-state and transient flow conditions.
At the beginning of the simulations, different parameters of the aquifer and the Nitra River were assumed in order to calculate the groundwater head (i.e., the piezometric head). Then after all the available data about the aquifer and the Nitra River was used to simulate the piezometric heads. The drainage and infiltration coefficients of the aquifer were determined by comparing different simulations under different conditions. Due to the scarcity of data and the heterogeneity of the hydrogeological parameters with time and space, the created model was calibrated through a proper calibration system, where the computed and measured piezometric heads in the observation well systems showed an acceptable match.
For the steady-state simulation, the hydrological condition of the Nitra River was artificially increased by 1.7 m in order to reach the expected water level during the rainy season, i.e., approximately 142 m a.s.l. Consequently, the piezometric heads in the area of interest dramatically increased. Based on the results, the pumping rates from the proposed 38 well systems were designed to maintain the required groundwater level.
For the transient simulation, a design flood wave [1] at a discharge of Q1000 of the Nitra River was considered. The effect of a flood wave on the groundwater level was examined to design the pumping rates from the proposed well systems. The results of the transient simulation verified that the designed discharge for the steady-state flow is also sufficient to maintain the required piezometric head approximately below 140 m a.s.l. during the course of a flood wave.
2. Study area and data specification
2.1. Location and topography
Nitra Industrial Park is located in the northern part of the town of Nitra. It is situated between the villages of Lužianky and Dražovce as shown in Fig. 1. Based on its geomorphology, the area of interest is located on the alluvial plain of the Nitra River.
The Nitra Flood plain creates an uneven wide belt in a northwest to southeast direction, where the width of the area is 2,750 m in the north of Nitra but narrows down to 600 m in the area of the town [2].
As it was mentioned in the final report of the geotechnical investigation, the area of interest is considered a plain with an elevation of the terrain varying from 142.16 m to
142.91 m a.s.l. In general, the whole alluvial plain of the Nitra River is flat with the collective characteristics of geological structures [3].
Fig. 1. Location of study area [3]
2.2. Hydrology
Only data about the Nitra River were considered as the initial internal boundary conditions. In general, the Dobrotka stream is not active. Thus, its influence on the modeling system was not considered. The most necessary data about the Nitra River was obtained from the Slovak Hydro-Meteorological Institute (SHMI). The maximum water level observed for a return period of one hundred years is 143.70 m a.s.l., and the average water level during a normal flow is about 140.75 m a.s.l. [4]. For the steady state flow, the average water level for the normal flow was considered. For the transient flow, a design flood wave with a return period of one thousand years (Q1000) was considered, based on the requirements of the investor.
2.3. Hydrogeology
Hydro-geological studies conducted for the Sony Company proved that the type of aquifer in the locality is confined; the groundwater is under pressure [2]. In Fig. 2 it is possible to see that the Quaternary gravel-sand (the main part of the aquifer, which collects groundwater [5]), is bounded by clay layers from the bottom and the top.
In September 2015, the INGEO Ltd. Company conducted hydrodynamic tests in 12 pumping and 3 observation wells to analyze the hydraulic conductivity k and coefficient of transmissivity T [6].
Fig. 2. Hydro-geological profile 1-1’ across the area of interest [5]
2.4. Mathematical background
A partial differential equation, which was derived from an equation of continuity and Darcy’s law, is the general equation for the simulation of groundwater flow [6], [7].
This general equation for porous media in terms of a piezometric head can be written as follows [6], [8]:
xt S h z k h z y k h y x k h
x x y z s∂
= ∂
¸¹
¨ ·
©
§
∂
∂
∂ + ∂
¸¸¹·
¨¨©§
∂
∂
∂ + ∂
¸¹
¨ ·
©
§
∂
∂
∂
∂ , (1)
where kx, ky and kz are hydraulic conductivities in the x-, y- and z-directions [m.s-1]; Ss is the specific storage [-]; h is piezometric head [m] and t is time [s] [9], [10].
The above equation is a general groundwater flow equation from which any other flow equations can be derived [6].
If the top of the aquifer is fixed and its change over time is zero, the transmissivity coefficient T is independent of the piezometric head h. This coefficient can be given as [8]:
H k
T= ⋅ , (2)
where T is transmissivity coefficient [m2.s-1]; k is hydraulic conductivity [m.s-1]; and H is the thickness of the aquifer [m].
Based on Boussinesq, unsteady-state filtration equation in two-dimension can be written as [8]:
t S h y W
T h y x T h
x
x y s∂
= ∂
¸¸¹ −
¨¨© ·
§
∂
∂
∂ + ∂
¸ ¹
¨ ·
©
§ ∂
∂
∂
∂
, (3)where Tx andTy are transmissivity coefficients [m2.s-1] in x- and y-directions and W is the pumping from/to the point source [m3.s-1.m-2] [8].
There are different computer-based programs used to solve these equations. In this paper, the TRIWACO simulation package is used to simulate the piezometric head for the mentioned area [9], [11]. The program uses the finite element method to carry out a simulation of the groundwater flow or head for a quasi-three-dimensional modeling system [11], [12].
3. Methodology
3.1. Conceptual groundwater model
The TRIWACO program was used to develop the conceptualization process and the modeling of the groundwater for the specified domain. All the physical hydrological, geological and hydrogeological data, which were obtained from different companies and institutions, were used to set the limits of the piezometric head in the domain.
Furthermore, river and hills were used as physical features in setting the boundaries of the model. In general, Dirichlet, Neumann and Cauchy boundary conditions were applied to set out the conceptual boundaries of the domain [12]. However, the Neumann boundary condition was predominantly used to establish the boundaries of the model, whereas Cauchy was applied to set the internal boundaries of the model. The Nitra River was considered as the internal boundary conditions of the model for two reasons.
Firstly, the Nitra River has a huge impact on the groundwater level at the area of the study. Thus, during the simulation it is easier to use the infiltration and drainage resistance of the river as input data if the river is considered as the internal boundaries of the model. Secondly, during the transient simulation, the parameters of the river changed with almost every time step. This situation could be better applied during the simulation if the river was located within the boundaries of the model. For the steady state simulation, the normal water level of (140.75 m a.s.l.) in the Nitra River was used to set the conceptual model.
In the study area, there are also 55 boreholes [3], which were used as check (control) points. The boreholes have assigned codes with corresponding top and bottom elevation data, which was used for the model’s calibration. The hydraulic conductivity of the
aquifer, which was determined by a hydrodynamic test, was used to calculate the transmissivity of the aquifer across the boundaries based on (Eq. 2).
Furthermore, INGEO Ltd. Žilina [5] estimated the coefficient of storativity from twelve observation and three pumping wells. The estimated values ranged from 4.48x10⁻⁵ to 9.28x10⁻² [-] [5]. Those values were used as input data to carry out the transient simulation.
All the parameters were entered using point values, polygons, lines or constants or a combination of them. But some parameters which are dependent on each other were entered using expressions (Eq. 2). Data about the permeability of the aquifer and the width of the river channel were entered as a constant. Additionally, the river activity in the aquifer and the water level in the river were entered as a vector map. However, the rest of the parameters (e.g. the precipitation, recharge, infiltration, etc.) were kept at zero, as the top aquifer of the area is impermeable (a clay layer). Moreover, there is a scarcity of data about those parameters.
3.2. Numerical modeling
After creating the conceptual model, which is associated with the calculation grid, the next step was running the model with its code. The conceptual model was used to compile data which was already known about the hydrological and hydrogeological systems; it then prepared a scheme for designing the numerical models. This conceptual model was taken as the parent dataset, and the calculation grid was taken as the discretization dataset, which had already been created for the given model [13].
Therefore, in order to begin the numerical simulation, the created conceptual model was converted to the numerical model with the help of the TRIWACO program. It uses the finite element method of numerical solutions to model groundwater flow or a groundwater head [9], [11], [12]. Using the numerical models, the piezometric head was simulated by an approximation of the governing equation at specific locations. The head was calculated at discrete points in space and for specific values of time [14]. The initial piezometric heads were displayed as a contour map from the data imported.
3.3. Model calibration
Calibration is a process whereby the simulated and measured piezometric heads are automatically compared. All the parameters mentioned before and the data about the observation wells were used to set up the calibration system. The measured groundwater head in the observation wells (BH1 to BH55) and the results of the simulated piezometric heads were compared. The results match each other with acceptable differences (+0.52 to -0.36).
4. Results and discussions
4.1. Steady state simulation
The conceptual model was taken as the parent dataset and the calculation grid was taken as the discretization dataset, which had already been created for the given model.
In this groundwater modeling, different simulations are created that use different parameters based on different situations. The first simulation was carried out directly from the conceptual model, and the piezometric head, ϕ1 (PHI1) was displayed as a contour map (Fig. 3). All the inherited parameters were not modified at this stage.
However, an approximate initial piezometric head, which was closer to the heads to be simulated, was created to speed up the simulation. In this simulation, the activity of the Nitra River was taken into account. As was mentioned earlier, the Dobrotka stream is inactive, and there is no available data about the stream. Thus, its impact on the simulation was ignored. Moreover, another two sub-simulations were created under this simulation in order to evaluate whether the interpolation methods did or did not have different results. Nevertheless, the results of the simulation, which were calculated using ordinary methods (i.e., the Triangulated Irregular Network, Kriging or Inverse Distance to a Power method) of interpolation, showed similar results. Thus, the methods of interpolation using the TRIWACO simulation package do not show significant differences in their results.
Fig. 3. Simulation results that show the piezometric heads as a contour map, PHI [m a.s.l.]
After the calibration and validation of the input data, the impact of the hydrological situation on the piezometric heads was tested. Therefore, the water level in the Nitra River was artificially increased (as could be expected during the rainy season) by 1.7 m in order to raise the water level to approximately 142.0 m a.s.l. The simulated piezometric heads (Fig. 4) indicate that the groundwater level around the area of interest
increased from 140.60 m to 142.35 m a.s.l. The results after this simulation were used to design the pumping rates, which are sufficient to keep the groundwater level below 140.0 m a.s.l. around the area of the park. Simultaneously, other simulations were carried out using the same concept, but with different values for the infiltration and drainage resistance of the river. However, for all the possible combinations of the infiltration and drainage resistance, the simulated piezometric heads were approximately similar within the model boundaries.
As it can be seen in Fig. 4, where the water level in the Nitra River was raised by 1.7 m, the groundwater elevations around the area of interest were consequently raised from approximately 140.55 to 142.35 m a.s.l. Based on Darcy’s law, the permeability of the river bed and the difference in the heads are directly proportional to the flow rate between the river and the aquifer [15], [16].
Fig. 4. Contour map of the simulated piezometric heads [m a.s.l.] when the water level in the Nitra River was increased by 1.7 m
Therefore, the above results indicate that there is leakage from the river to the aquifer.
However, the investor wanted to keep the elevation of the groundwater below 140 m a.s.l. Hence, it was necessary to design a pumping or drainage system to lower the level of the groundwater to an acceptable depth. Based on these results, several simulations were performed to determine the optimum pumping rates from the wells to maintain the required elevation. The simulation, which was carried out considering a constant pumping rate of 1 l.s-1 from the individual wells, showed that the required piezometric
heads were achieved on the eastern part of the area. However, the piezometric heads along the Nitra River were still above 140 m a.s.l. As a result, another simulation was performed in the opposite direction (i.e., assuming constant piezometric heads of 139.75 m a.s.l. in the wells) to compute the pumping rates from the well systems. The pumping rates computed for the assumed piezometric heads vary between 0.4 l.s-1 and 5.0 l.s-1. Pumping the maximum rate of 5.0 l.s-1 from the well systems would have a negative effect on the quantity of the groundwater around the area as well as on the Nitra River. Moreover, the maximum pumping rate might also result in the collapse of the well systems. Accordingly, the maximum pumping rate of 2.5 l.s-1 and minimum pumping rate of 1 l.s-1 are designed to maintain the groundwater head at the required elevation (Fig. 5). It can be seen from the contour map that the designed pumping rate is satisfactory to assure the required groundwater level in the vicinity of the park.
Fig. 5. Contour map of the simulated piezometric heads [m a.s.l.] after pumping and designed pumping rates from the individual wells [l.s-1]
4.2. Transient simulation
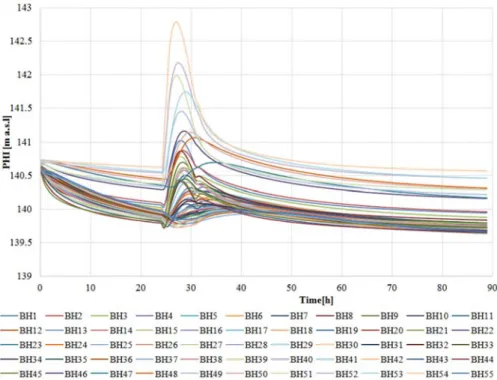
For the transient simulation, the design flood wave in the Nitra River was used. This design flood wave at a return period of one thousand years (Q1000) in the Nitra River was determined by SHMI, where the flood wave had a total duration of 85 hours with a culminating discharge of 514 m3.s-1 [1], [17]. Using the course of this design flood wave and the last simulation of the steady-state conditions as explained above, the transient simulation was carried out to compute the piezometric heads [18]. From the curve of the design flood wave, the Danish Hydraulic Institute (DHI) [19] calculated the course of the water level in the Nitra River with respect to the time and stations (i.e., seven
stations from K0P0 to K6P6), which were used for the simulations of transient flow [20]. Based on this data, different simulations were conducted to simulate the piezometric heads and also to compare the coefficient of storativity, which was determined from the hydrodynamic tests.
Fig. 6 illustrates the piezometric heads in the individual observation wells with respect to time during the course of the flood wave. The graphs indicate that the required elevations of the piezometric heads were achieved in the various observation wells. However, there were just a few wells where the piezometric head was slightly higher than the required level. The graphs show that there was a sudden rise in the water level within 5 days more or less. Then the drawdown to a normal level gradually occurred.
Fig. 6. The piezometric heads in the individual observation wells after pumping during the course of the flood wave
5. Conclusions
The objective of this paper was to design and assess a possible groundwater drawdown system based on the TRIWACO simulation package for the Nitra Industrial Park. Several simulations were carried out to evaluate the different parameters and their
effect on the outputs. In the model’s calibration process, the measured groundwater heads in the observation wells and the results of the simulated piezometric heads were compared, and the results matched with acceptable differences. Different simulations demonstrated that the interpolation methods of the parameters did not affect the output of the TRIWACO model.
Increases in the water level of the Nitra River adversely affect the level of the groundwater around the river. The pumping rates from the wells were therefore designed based on the maximum water level in the Nitra River. The values of the calculated pumping rates varied from 5 l.s-1 to 0.4 l.s-1. However, the optimum pumping rate of 2.5 l.s-1 was designed for 16 wells located along the Nitra River, and a rate of 1 l.s-1 was designed for the remaining 22 wells at the eastern part of the park. Although the calculated pumping rates have been rounded down to 2.5 l.s-1, the elevations of the groundwater heads are still approximately kept to the required elevation of 140 m a.s.l.
The results of the transient simulations, which were carried out by considering a Q1000 flood wave in the Nitra River, indicated that the piezometric heads in the area of interest suddenly increased within a few hours and gradually decreased to the normal position. However, the designed pumping rate for a steady state flow was enough to assure the required groundwater level for the expected course of the flood wave. In order to operate the pumping system efficiently, the observation wells should be used for regular monitoring of the groundwater level. Based on the information from the observation wells, the pumping system can be switched on or off in order to avoid unnecessary drawdowns in the well systems.
Acknowledgements
The contribution was developed within the frame of and based on the financial support of the APVV-14-0735 project ‘New possibilities for the use of drainage channels, taking into account the biodiversity in a landscape’.
The contribution was also developed within the frame and based on the financial support of the APVV-15-0489 project ‘Analysis of droughts by multi-criterial statistical methods and data mining from the viewpoint of preventive structures in a landscape’.
References
[1] Slovak Hydro-Meteorogical Institute (SHMI), Flood wave design for Q1000, Nitra-rkm 65.790, Bratislava, 2015, www.shmu.sk, (last visited 14 May 2016).
[2] Horváth V., Doviþin P., Hudec J., Barát J. Geological task, Final Report, Industrial Park, NR 400, No. 0915, Reg. No. 131/2015, Bratislava, 2015.
[3] Soták J., Vlþko J. Project DARWIN, Detailed engineering-geological survey, Final report, Treuhand Partner Austria (TPA), Ltd, Bratislava, 2015.
[4] Hydrological data on the groundwater and surface water levels from the basic Slovak Hydro-Meteorological Institute observation networks, Bratislava, 2015, www.shmu.sk, (last visited 20 March 2016).
[5] Urbaník J. Graphic evaluation of ascending hydrodynamic tests in the locality of the Nitra Industrial Park (in Slovak), Values of hydraulic conductivity k and transmissivity T, Project report, INGEO Ltd, Žilina, 2015.
[6] Franklin H. Z., Schwartz W. Fundamentals of groundwater flow, The Ohio State University, Hermitage Publishing Service, 2003.
[7] Korkmaz S., Pekkan E., Güney Y. Transient analysis with MODFLOW for developing water-diversion function, Journal of Hydrologic Enineering, Vol. 21, No. 6, 2016, pp. 05016009-1–05016009-11.
[8] Barokova D. Simulation of the impact of selected structures on a groundwater level regime (in Slovak), PhD Thesis, Faculty of Civil Engineering, Slovak University of Technology in Bratislava, 2014.
[9] ýerveĖanská M., Baroková D., Šoltész A. Modeling the groundwater level changes in an area of water resources operations, Pollack Periodica, Vol. 11, No. 3, 2016, pp. 83–92.
[10] Šlezingr M., Marková J., Gernešová L. The effects of selected types of active bank stabilization. Procedia Engineering, Vol. 190, 2017. pp. 653–659.
[11] Haskoning R. Triwaco groundwater modeling software, TRIWACO User’s Manual, The Netherlands, 2004.
[12] Andrássy T., Baroková D. Numerical modeling of groundwater flow close to drinking water resources during flood events, Pollack Periodica, Vol. 11, No. 1, 2016, pp. 43–54.
[13] Sandro R., Louati S., Bendjoudi H., de Marsily G. Modeling of transient groundwater flow, pollutant transport, and biodegradation in an aquifer with large hydraulic head variations, Hydrogeology Journal, Vol. 22, No. 22, 2014, pp. 943−956.
[14] Fendeková M., Fendek M. Groundwater drought in the Nitra river basin - identification and classification, Journal of Hydrology and Hydromechanics, Vol. 60, No. 3, 2012, pp. 185−193.
[15] Obergfell C., Bakker M., Zaadnoordijk W. J., Maas K. Deriving hydrogeological parameters through time series analysis of groundwater head fluctuations around well fields, (in France) Hydrogeology Journal, Vol. 21, No. 5, 2013. pp. 987–999.
[16] Zaadnoordijk W. J. Simulating piecewise-linear surface water and ground water interactions with MODFLOW, Ground Water, Vol. 47, No. 5, 2009. pp. 723–726.
[17] Šoltész A., Baroková D. Hydraulic design of groundwater drawdown, Phase 2 Report, Strategic Park Nitra, Bratislava, 2015.
[18] De Graaf E. M., van Beek R. L. P. H., Gleeson T., Moosdorf N., Schmitz O., Sutanudjaja E. H., Bierkens M. F. P. M. A global-scale two-layer transient groundwater model:
Development and application to groundwater depletion, Advances in water Resources, Vol. 102, 2017, pp. 53−67.
[19] Mišík M. Calculation of mathematical hydrodynamic model with determination of discharge capacity of the Nitra River profile in section rkm 60.000-79.000 and capacities of detention volumes w.r.t flood wave transformation, Danish Hydraulic Institute (DHI), Bratislava Branch, 2016.
[20] Julínek T., ěíha J. Assessing stream water quality influenced by storm overflows from sewers, Pollack Periodica, Vol. 12, No. 2, 2017, pp. 117−128.
![Fig. 1. Location of study area [3]](https://thumb-eu.123doks.com/thumbv2/9dokorg/1422790.120509/3.892.160.669.245.619/fig-location-of-study-area.webp)
![Fig. 2. Hydro-geological profile 1-1’ across the area of interest [5]](https://thumb-eu.123doks.com/thumbv2/9dokorg/1422790.120509/4.892.234.733.281.640/fig-hydro-geological-profile-area.webp)
![Fig. 3. Simulation results that show the piezometric heads as a contour map, PHI [m a.s.l.]](https://thumb-eu.123doks.com/thumbv2/9dokorg/1422790.120509/7.892.211.617.474.853/fig-simulation-results-piezometric-heads-contour-map-phi.webp)
![Fig. 4. Contour map of the simulated piezometric heads [m a.s.l.] when the water level in the Nitra River was increased by 1.7 m](https://thumb-eu.123doks.com/thumbv2/9dokorg/1422790.120509/8.892.284.675.417.797/contour-simulated-piezometric-heads-water-nitra-river-increased.webp)
![Fig. 5. Contour map of the simulated piezometric heads [m a.s.l.] after pumping and designed pumping rates from the individual wells [l.s -1 ]](https://thumb-eu.123doks.com/thumbv2/9dokorg/1422790.120509/9.892.163.668.413.742/contour-simulated-piezometric-heads-pumping-designed-pumping-individual.webp)