Tananyag fejlesztés idegen nyelven
Prevention of the atmosphere
KÖRNYEZETGAZDÁLKODÁSI AGRÁRMÉRNÖKI MSC
(MSc IN AGRO-ENVIRONMENTAL STUDIES)
Place of atmospheric contamination II.
(The state variables)
Lecture 2
Lessons 4-6
Lesson 4
The atmospheric pressure
The state variables of the atmosphere
Assuming that:
• The main constituents (nitrogen and oxygen) are included only
• There is no water vapor in the air
• There is no air motion, the air is quite
Than the properties of the air may be taken into account by the three state variables, where molecules neglect
various intermolecular impact. The variables are - air pressure
- air temperature
- air density (volume)
Atmospheric pressure
The air pressure (P) is a force exerted by the atmosphere on a unit area of Earth surface (A). The balance of forces results as follows:
where z: altitude ρ: air density g: acceleration
Similarly to the distribution of the mass of air, the air
pressure is also a function of altitude. Up to 90% of total mass located in the troposphere.
] 0 )]
( )
(
[P z dz P z A
dzg Vertical distribution of the air pressure depending on the altitude
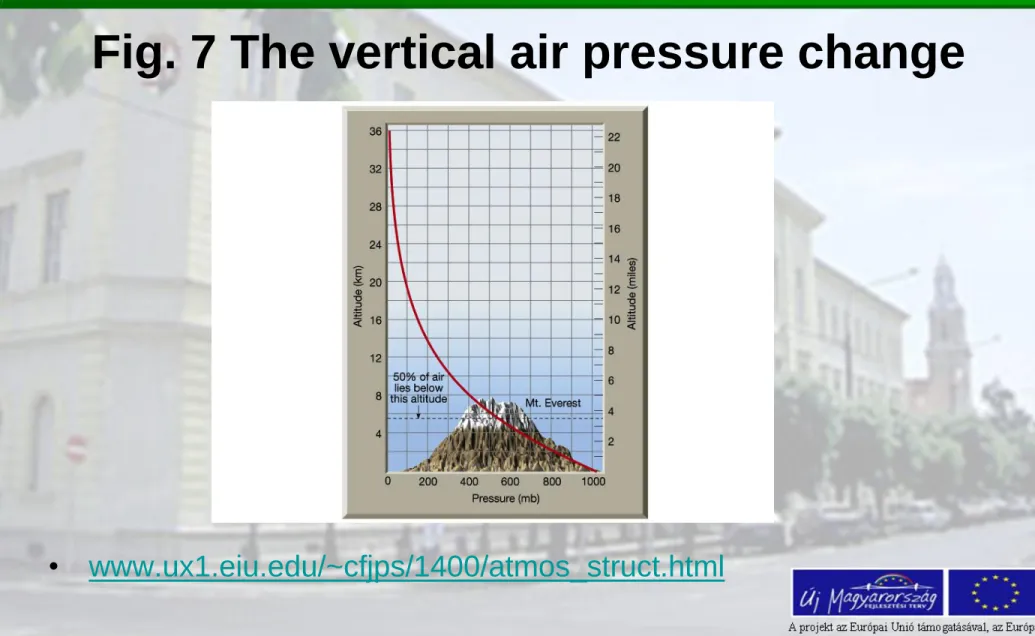
We assume the mean air pressure at close to the Earth surface (sea level) as 1013.2 hPa, than:
- at top of boundary layer (about 2 km above the surface): 760 hPa
- at the top of the troposphere (11 km) 200 hPa
- at the top of the stratosphere (50 km) 1 hPa
Fig. 7 The vertical air pressure change
• www.ux1.eiu.edu/~cfjps/1400/atmos_struct.html
Table 3 The vertical air pressure change in %
Altitude (km) Percent sea level pressure
0 100
5.6 50
16.2 10
31.2 1
48.1 0.1
65.1 0.01
79.2 0.001
100 0.00003
Reference: see at Fig. before
Pressure formations in the atmosphere
Connecting points of the same data results the isolines. In case of air pressure these are the isobars. The isobars of an extended area may provide the two important
pressure systems; the cyclone and anticyclone.
In the middle of cyclone the air pressure is the lowest. The outgoing isobars are increasing -towards the edge of the formation. Here the only possibility for air motion is
upward (there is no other „empty” place). Finally the
lifting air is cooling, becomes saturated and precipitation formation is starting.
In the middle of the anticyclone the air pressure is the
highest. Towards the edge of the anticyclone the isobars are decreasing. The pressure gradient forms a gradient force pointing out outwards the centre of the formation.
The air mass is descending, to the direction of surface, and it’s temperature is warming. In case of anticyclone, no clouds and no precipitation are waited.
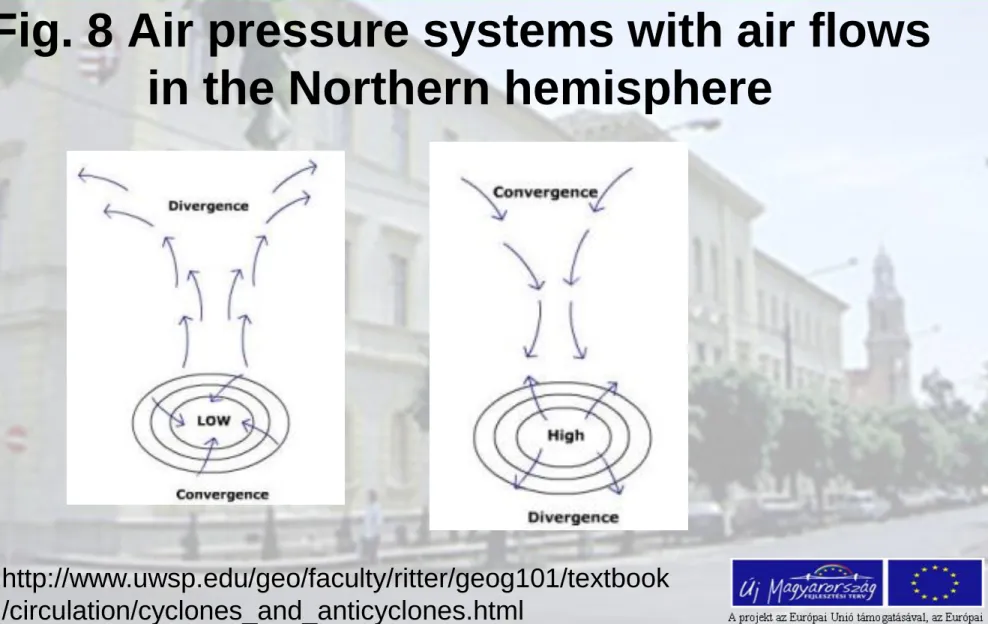
• The Coriolis effect bends the air creating a clockwise rotation around the high pressure centre (Northern hemisphere).
• Counterclockwise rotation around the low pressure
centre (cyclone) and convergence near the center of the system (Northern hemisphere).
Fig. 8 Air pressure systems with air flows in the Northern hemisphere
http://www.uwsp.edu/geo/faculty/ritter/geog101/textbook /circulation/cyclones_and_anticyclones.html
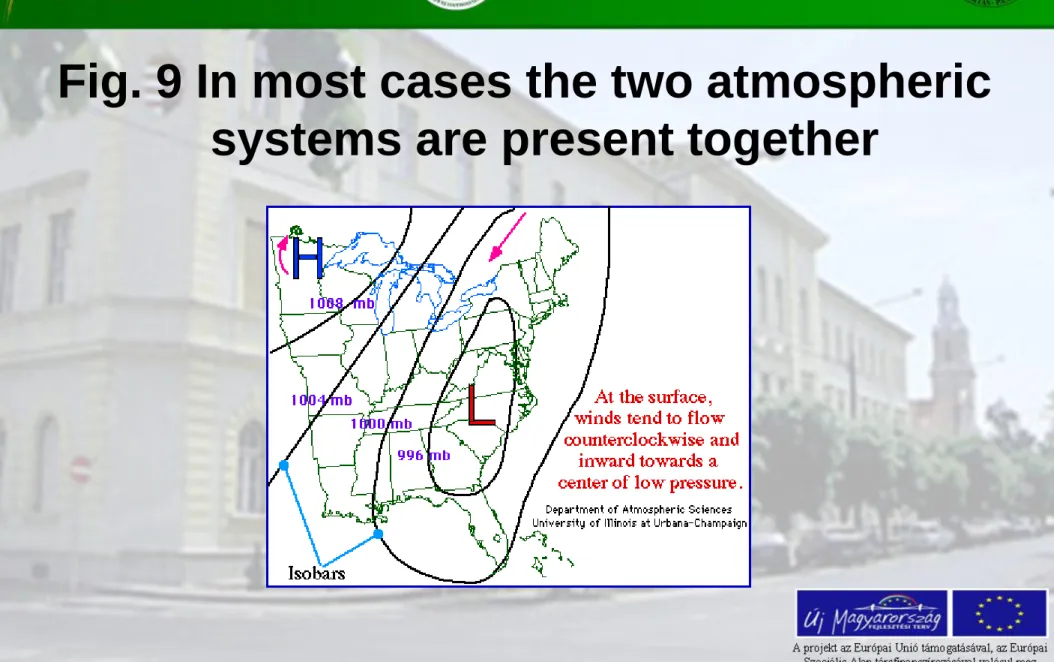
Fig. 9 In most cases the two atmospheric
systems are present together
Other not very frequent air pressure formations:
– lowest pressure near the center is called troughs – highest pressure near the center is called ridges
Due to the Coriolis effect, on the Southern hemisphere the opposite flow directions can be found: around lows are clockwise (rotation inward toward the center) and around highs a diverging, counterclockwise rotation
Lesson 5
Actual weather in cyclone and antycyclone
Drawing an isomap
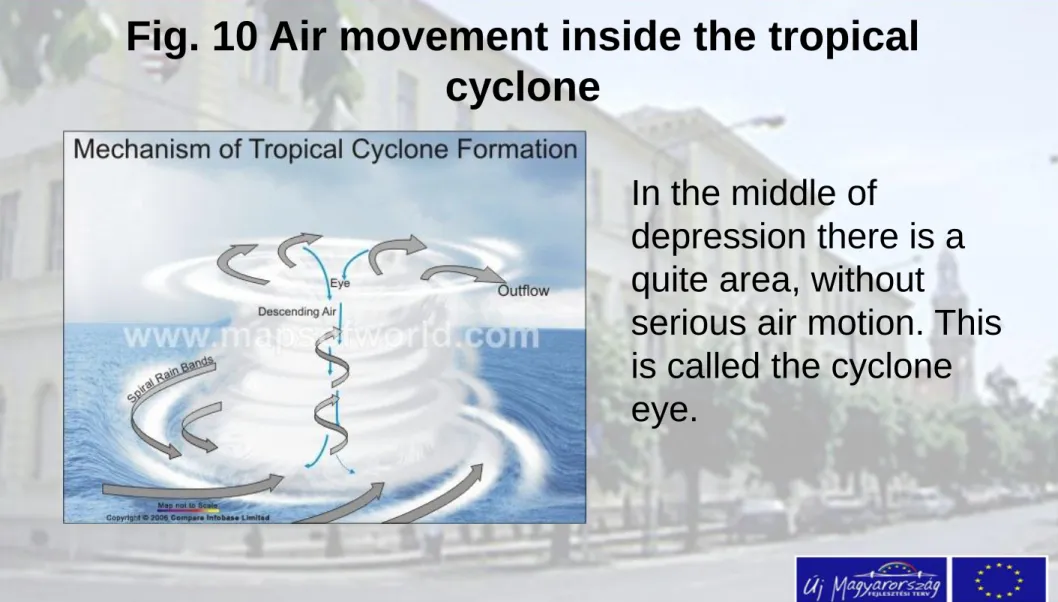
In the middle of
depression there is a quite area, without
serious air motion. This is called the cyclone eye.
Fig. 10 Air movement inside the tropical
cyclone
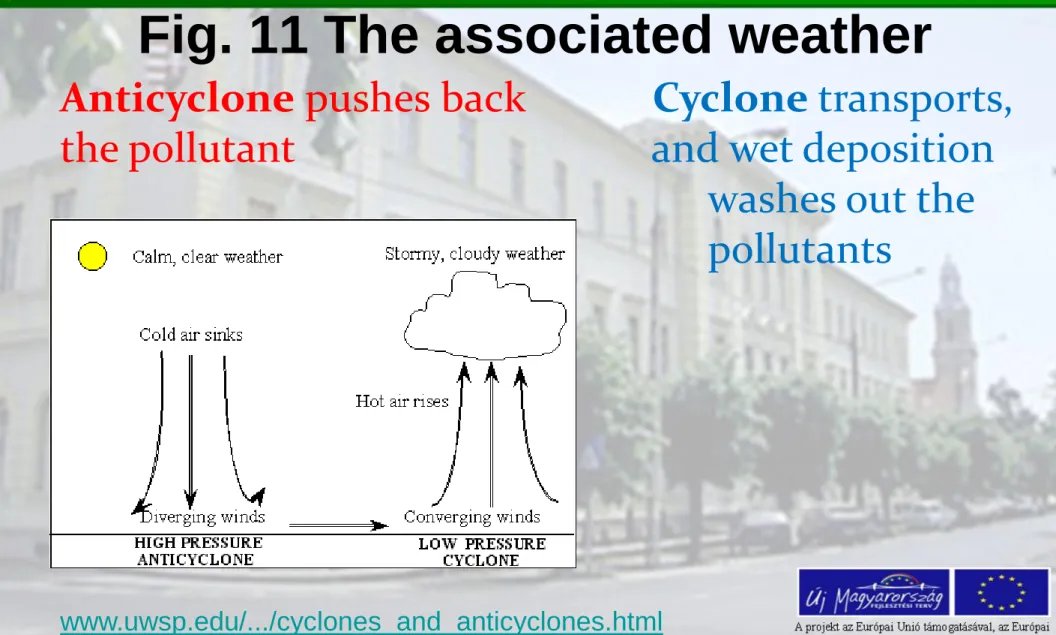
Fig. 11 The associated weather
Anticyclone pushes back Cyclone transports, the pollutant and wet deposition
washes out the pollutants
www.uwsp.edu/.../cyclones_and_anticyclones.html
Let’s draw an isomap and make a prognosis for future weather!
Repetition
• The meaning of isolines – see earlier
• Interpolation - mathematical method of
constructing new data points within the range of a discrete set of known data points.
• Cyclonic and anticyclones weather – their impact
for pollution level
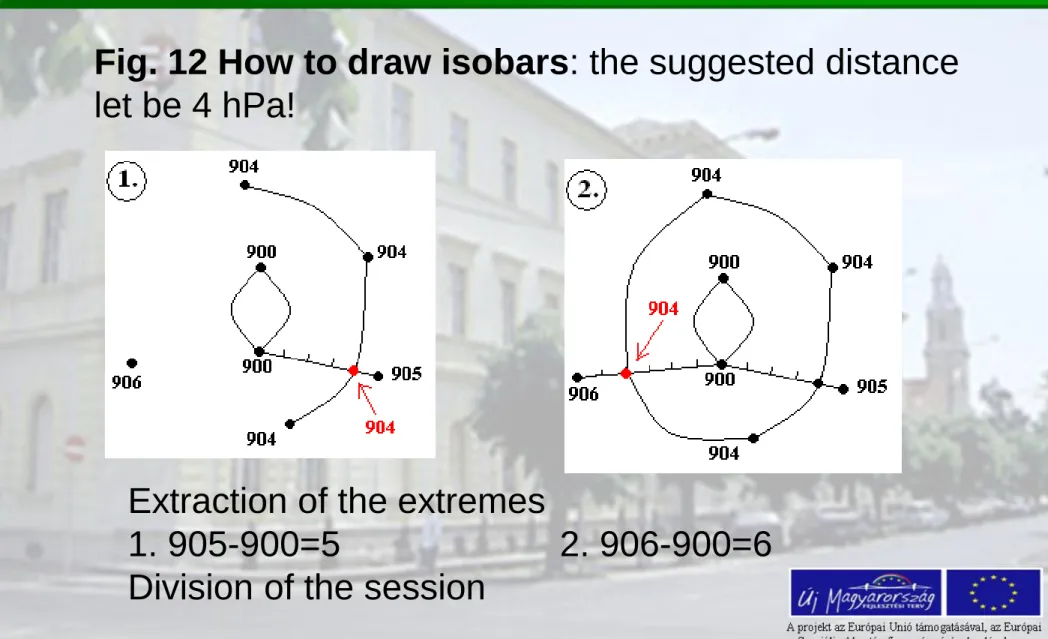
Fig. 12 How to draw isobars: the suggested distance let be 4 hPa!
Extraction of the extremes
1. 905-900=5 2. 906-900=6 Division of the session
Fig. 13 The basic air pressure data for the US
(http://www.le arnearthscien ce.com/pages /For_Teacher s/Labs/isobar andisotherm maplab.pdf)
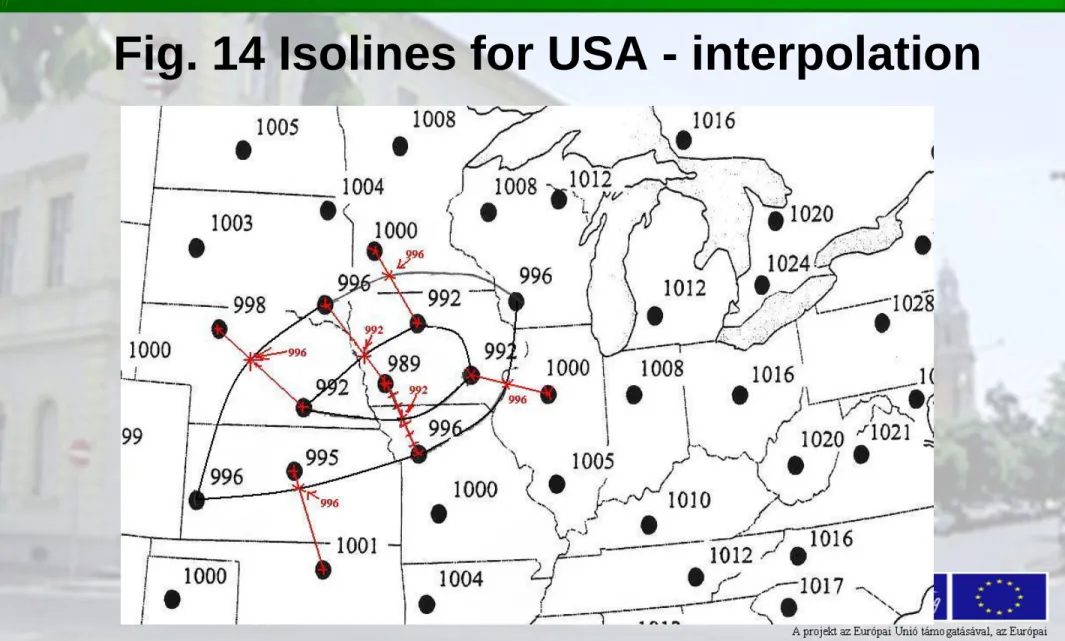
Fig. 14 Isolines for USA - interpolation
Fig. 15 The two pressure systems
Fig. 16 The isotherms for the same area
(http://www .learnearth science.co m/pages/F or_Teacher s/Labs/isob arandisoth ermmaplab .pdf)
• Analyze the two isoline maps and answer for the questions!
- Find the place of the lowest air pressure on the Isobar Map
- Construct the 992 mb isobars around the lowest pressure
- Complete the isobars in increments of 4
mb up to the 1028 mb isobar
- Label the lowest pressure centre with an "L" and the highest pressure with an "H”
- Draw the direction the winds will flow around
each of the two pressure centre - On which side of the low pressure centre would
the winds be the strongest?
- What evidence do you have to support your answer for the previous question?
- In the next two days, what should the people of New York expect to happen to the barometric pressure?
- Underline each of the weather characteristics that people in New York State should expect
with the approaching low pressure centre (1) warmer colder
(2) dry moist
(3) sinking air rising air (4) clouds no clouds
- What will happen to pollutant of New York city’s
air?
Lesson 6
Basics in air temperatures. The gas laws
• Air temperature or surface temperature
The ambient temperature is measured by a thermometer exposed to the open air. The thermometer has to be sheltered from direct solar radiation.
We place the thermometer far from the ground surface to avoid the direct impact of heterogenic soil surfaces. The distance is between 1.8-2.2 m above the ground.
The temperatures are expressed using different scales:
Celsius, Kelvin (physicians), Fahrenheit and Réaumer (French one, rarely used) scales
• The temperature of the atmosphere is a
measure of kinetic energy of the small particle motions, the so called Brownian motion.
• Its value is determined in terms of a standard calibrated thermometer that is in thermal
equilibrium with the surrounding air.
• The actual air temperature values depend on
environmental conditions, mainly on wind speed
and other physical air properties
Table 4 Air temperature scales with their fix points
Grades Melting point of ice on
mean air pressure (1013 hPa)
Steam
temperature above boiling water (mean air pressure)
Celsius (t) 100 0°C 100°C
Kelvin (T) 100 273.15 K 373.15 K
Fahrenheit 180 32°F 212°F
Reummer 80 0°R 80°R
Fig. 17 The absolute zero
http://hu.wikipedia.org/wiki/Gay-Lussac- t%C3%B6rv%C3%A9ny
Lord Kelvin discovered the absolute zero
(-273,15°C), where no movement of
individual molecules. This theory was the
result of application of the
Gay/Lussac law, see also later
Convert the temperatures using different scales!
Signings: t means degrees centigrade (°C) T temperatures in Kelvin
The relationship between Kelvin and centigrade scales:
T [K]= t [°C]+273.15
Relationship between centigrade and Fahrenheit (F) scales
x
CF x
F x
C x
9 32 5 32 5
9
Air density (ρ)
The mass (m) of air in a unit volume (V):
Its reciprocal, the specific volume, is more
frequently applied in atmospheric studies. This is the volume occupied by a unit gas mass:
3
m kg V
m
kg m m
V 3
1
Relationship between the state variables – gas laws (brief overview)
• Boyle-Mariotte law (where k: is constant)
• Gay-Lussac law: the volume, V is constant
• Combined law (combination of the above two laws and Charles law)
k pV
2 2 1
1
T p T
p
2 2 2 1
1 1
T V p T
V p
Ideal gas law
pV = n R T
• This gas law describes the state of a unit amount of ideal gas that is determined by its three state
variables, the pressure, volume, and temperature.
The equation above is the modern form of the ideal gas law
The number of elementary entities in one mole is
always equal to the number of entities of C12 in its
mass of 0.012 kg. This is the Avogadros number. It
is equal to 6.022 10
23pieces
Ideal gas law II.
In another form of ideal gas law (for p, Pa) could be expressed at T temperature:
p = NRT
where R is the universal gas constant
N the mole number per air volume.
The exact number for R = 8.314 Jmol−1 K−1.
Standard thermodynamic conditions of air results:
p= 1.013 ×10⁵ Pa
This is equal to 1013 hPa or 1 atm, yearly mean air pressure on the surface – sea- level when
T = 273.15K
• Calculate the molar mass of dry air on the basis of the largest air constituents!
The main components of the air are: N2, O2 and Ar. Their molar weight as follows:
MN2: 28 gmol−1; MO2: 32 gmol−1; Mar: 40 gmol−1. (Their molar fractions are:
CN2: 0.78 molmol−1; CO2: 0.21 molmol−1, and the abundant argon CAr: 0.0093 molmol−1)
Computation:
The molar mass of Xi components is Mxi
In the air (Mair): Σi CXiMXi , for the mentioned three gases we will get 28.9gmol−1 as the Mair.
• Extension of ideal gas law: the air with moisture
In the air the moisture (water of different states) is a
constant, but highly variable constituent. Its volumetric content is between 1-4%. The moisture has strict
temporal and spatial variability .
The virtual temperature (Tv) is the basis to compute the actual moisture concentration of the air. This
temperature is equal to the temperature of dry air that should have to keep the density and pressure of wet air:
Tv = T (1 + 0.61w)
Wet air properties II.
In the last equation the w is the mixing ratio or humidity ratio, that is the water vapor mass, per kilogram of dry air. Until dew point it is constant, the w depends on temperature variations.
It’s values range from 1 to 10 g/kg.
We often apply the specific humidity, that is the ratio of the water vapor mass to the wet air mass.
We quote the specific humidity with letter q