Tananyag fejlesztés idegen nyelven
Prevention of the atmosphere
KÖRNYEZETGAZDÁLKODÁSI AGRÁRMÉRNÖKI MSC
(MSc IN AGRO-ENVIRONMENTAL STUDIES)
Processes of environmental
pollution (the emission) Pollutant in the air (gases I.)
Lecture 5
Lessons 13-15
Lesson 13
Definition of environmental pollution.The environmental load. Processes of air
contamination.
- emission - transmission
- immission
Environmental pollution: definition
The environmental pollution means special conditions in the atmosphere, when the crops, animals, humans and objects of virtu are harmed or interfere the quality of our life. The pollutant may originate from natural or artificial sources. In the environmental pollution (protection) the contaminant resulted of human activity are only
considered as pollutant.
The pollution of a given site is determined by:
- The relevant emission characteristics
- State of the atmosphere (this subject was discussed in the previous two weeks)
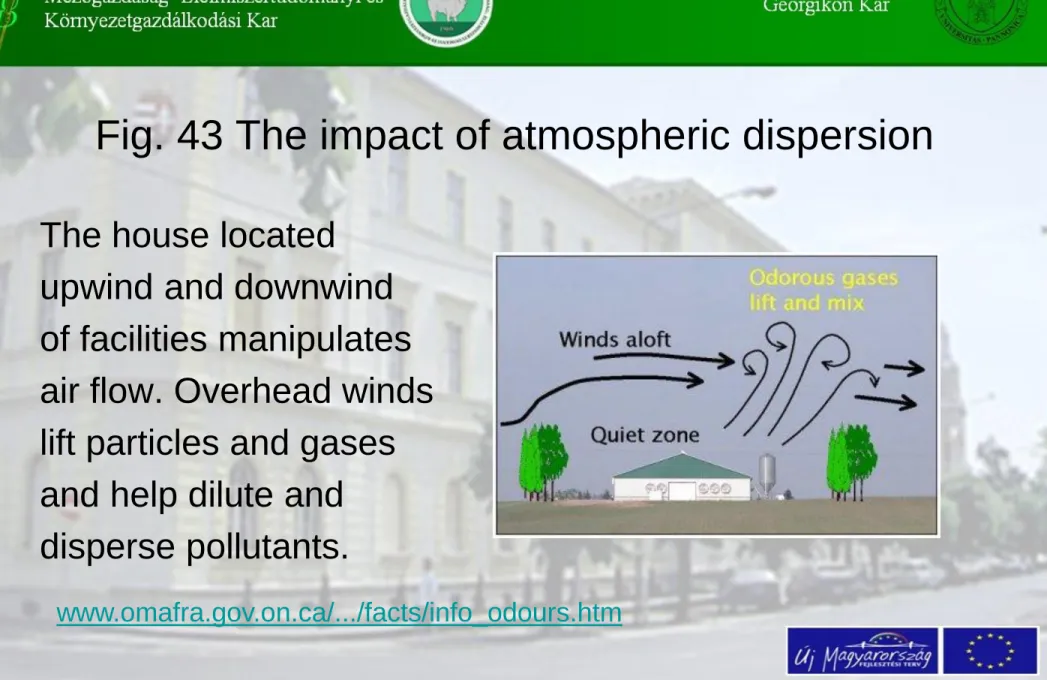
Fig. 43 The impact of atmospheric dispersion
The house located
upwind and downwind of facilities manipulates air flow. Overhead winds lift particles and gases and help dilute and
disperse pollutants.
www.omafra.gov.on.ca/.../facts/info_odours.htm
1. The pollutant release
• The relevant emission has important characteristics - Rate of emission
- Physical and chemical features of environmental load Both of them determine the amount and type of pollution.
The other source factors have also influence on pollution level:
- The properties of emission area - Duration of the contamination
- The height of emission source (the level of contamination injection)
Emission features
• The emission is the pollutant release into the atmosphere (followed by dispersion)
• This process is also regulated by weather circumstances (see earlier):
- air motion transports the contaminant from the sources (crucial point!), causes dilution and dispersion of
pollutant in the air.
- Wind direction determines the pollutant path, what is in close connection with the extent of cross-wind
spreading
- The surface roughness with wind speed determine the mechanical turbulence
Wind is responsible to downwind transports and pollutant dilution (see plume shapes and their content)
- turbulence mixes the contaminants
- temperature stratification determines the stability of the air
Close connection exists between elements of the weather;
air temperature - vertical air motion – convection – buoyancy
2. Transmission of the pollutant
• After pollutant release, the gases and aerosols are
dispersed into the atmosphere. On their pathway in the surrounding two different modifications may happen:
- chemical reactions, and in most cases, they are followed by only one type of physical reaction
(condensation)
The reactions are governed by the weather characteristics:
- Solar radiation - Air temperature
- Air moisture (water vapor and droplets) - Presence of other chemical substances
3. Immission (ambient air quality)
Pollutant after atmospheric transportation and
transformation forms the ambient air quality above a determined geographical place. This called as
immission. Until the emission may be constant, the immission may vary on a very high extent due to capricious weather changes.
Focusing the impacts for human and other living organisms (crops and animals as well as microbes) the monitoring of immission has of primary importance.
It does not have the meaning that the emission could be neglected!
4. Deposition
The contaminant is falling out of the atmosphere in the process of deposition. It depends on the state of the
atmosphere as well. There are two ways of atmospheric deposition:
- dry deposition (without precipitation event) - wet deposition assuming rainfall
The deposition is the process, when the pollutants leave the air, the atmosphere may be cleaned
In the process of deposition the contaminant reaches the surface (ground, oceans, seas). The cleaning is true in the point of view of the atmosphere only. The pollutants may pose problems on the surface.
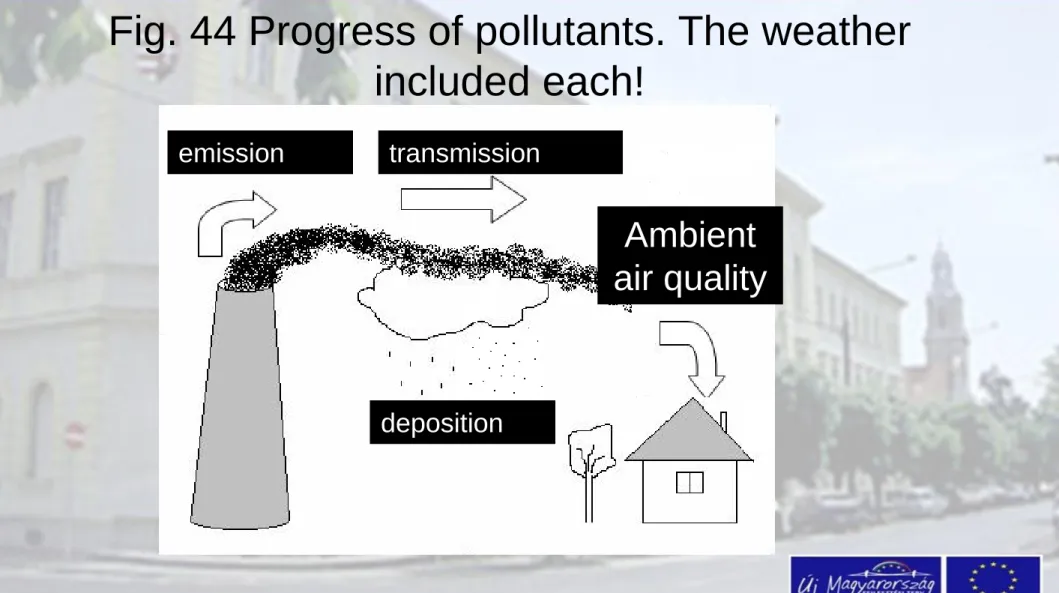
Fig. 44 Progress of pollutants. The weather included each!
emission transmission
deposition
Ambient air quality
• Some natural sources are essential to keep life (carbon- dioxide for photosynthesis; nitrogen compounds to crop metabolism etc.). Every gas of antropogenic origin may become as a pollutant, when its concentration increases above a threshold limit.
• Atmosphere is an excellent substance for dispersal in comparison to soil or water. But after releasing the
contaminant into the air, it is impossible to re-capture it!
In atmospheric pollution we need to protect the release of contaminant into the free air. After emission there is no way the recover the pollutant.
Fig. 45 Scheme of carbon assimilation: the photosynthesis
Carbon dioxide is not a
pollutant, but it is the basic material in assimilation
process
http://www.soulcare.org/images/photos ynthesis_respiration_diagram.gif
Lesson 14
Air pollutant groups: gaseous materials with
their features. SO
2and NO
xI.
• Control of the atmospheric pollution should always be preventive!
The family of the air pollutants 1. Gases
a) The sulfur compounds
SO2: a colorless gas with a disagreeable , suffocating odor. It is a harmful gas due to it’s corrosive impact.
Sulfur content in fossil fuels is very high; its range from 0.1% up to 5% in coal or oil by-products. In natural gas up to 40% (when immediately extracted from the well;
however, the sulfur is efficiently removed during the processing of gas before distribution).
Therefore, natural gas combustion is not the most important source of atmospheric sulfur
The use of coal was the largest sulfur source in the
historical times (two to three decades ago). Mainly in the developed countries the switch from coal to gas declined the rate of SO2 emission
Significant sources of sulfur dioxide emissions are in descending order
• Energy Production
– Electric power generation – Petroleum refining
– Other combustion
• Commercial and residential use
• Combustion for industry use
• Production processes
• Extraction and distribution of fossil fuels
• Transport
– Road transport
– Other transport (such as aviation, ships, trains).
The biggest sulfur dioxide emitters are: US, China and Russia.
Fig. 46 Average SO
2column densities over eastern China (2003)
SCIAMACHY's improved spatial resolution permits to identify localized
emissions due to
anthropogenic activities (Image: M.Van
Roozendael, IASB- BIRA)
http://atmos.caf.dlr.de/projects/scops/sciamachy_book/sciam achy_book_figures/chapter_10/fig_10_5.jpg
The natural sources of sulfur dioxide:
The reduced forms of sulfur compounds are as follows:
- hydrogen sulfide (H
2S) – source is bacterial actions (soil life)
- carbon disulfide (CS
2)
- carbonyl sulfide (COS)
In the organic forms:
- methyl mercaptan (CH
3SH) – very toxic gas
- dimethyl sulfide (DMS) (CH
3SCH
3)
- dimethyl disulfide (DMDS) (CH
3SSCH
3) Most of these gases get oxidized soon into
sulfur dioxide in the atmosphere. Later on
sulfurous (H
2SO
3) and sulfuric acids are
formed.
In the nature: soil and vegetation produce H
2S;
and SO
2is emitted by the volcanoes
The human made emission rate is at about 80%, while the natural source contributes the remaining 20%.
The SO
2is the main reason of producing
acid rains.
b) Nitrogen oxides and ammonia
They are coming from combustion of all
fossil fuels (mainly from coal or gas fired power stations) and from
- transport (motor vehicles)
Oil and coal nitrogen content is about 0.5–
1.5%, the natural gas contains a little less
nitrogen.
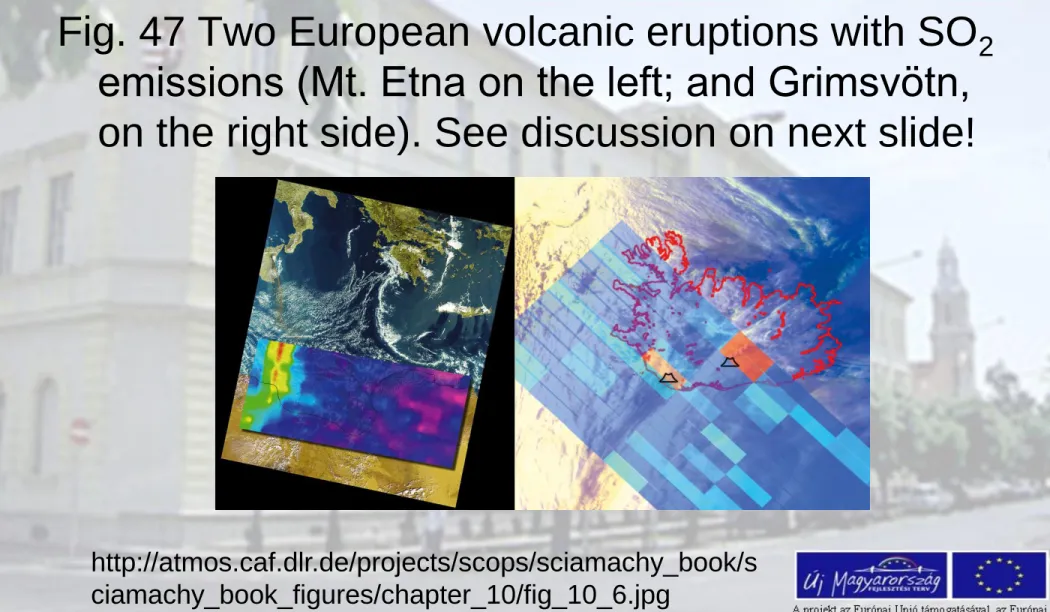
Fig. 47 Two European volcanic eruptions with SO
2emissions (Mt. Etna on the left; and Grimsvötn, on the right side). See discussion on next slide!
http://atmos.caf.dlr.de/projects/scops/sciamachy_book/s ciamachy_book_figures/chapter_10/fig_10_6.jpg
• The SCIAMACHY nadir measurement of Mt. Etna is over layed on a MERIS image showing that the plumes of
SO2 and visible ash match well (Fig. 42).
• In the Iceland image (right) detected SO2 emission at
Grimsvötn is indicated by the red pixel. The second faint SO2 enhancement in the south of Iceland is caused by the Katla volcano. The underlying visible image stems from AVHRR/NOAA-12.
• (Images: Mt. Etna – DLR-IMF, Iceland – DLR-DFD and IUP-IFE, University of Bremen)
Lesson 15
Air pollutant groups: gaseous materials with
their features NO
xII. The ammonia
Most of nitrogen oxides' are the production of the
atmospheric nitrogen (N2) and oxygen (O2) fixation (in the combustion chamber). There are two types of them:
- nitric oxide (NO), or nitrogen monoxide, and - nitrogen dioxide (NO2)
The sum of these two compounds is the NOx.
The NO has no color. The nitrogen dioxide is a yellow- reddish-brown color gas with an irritating odor.
• Fuel combustion always produces both of them, but majority of NOx is in the form of NO. This compound is oxidizing further in the atmosphere soon.
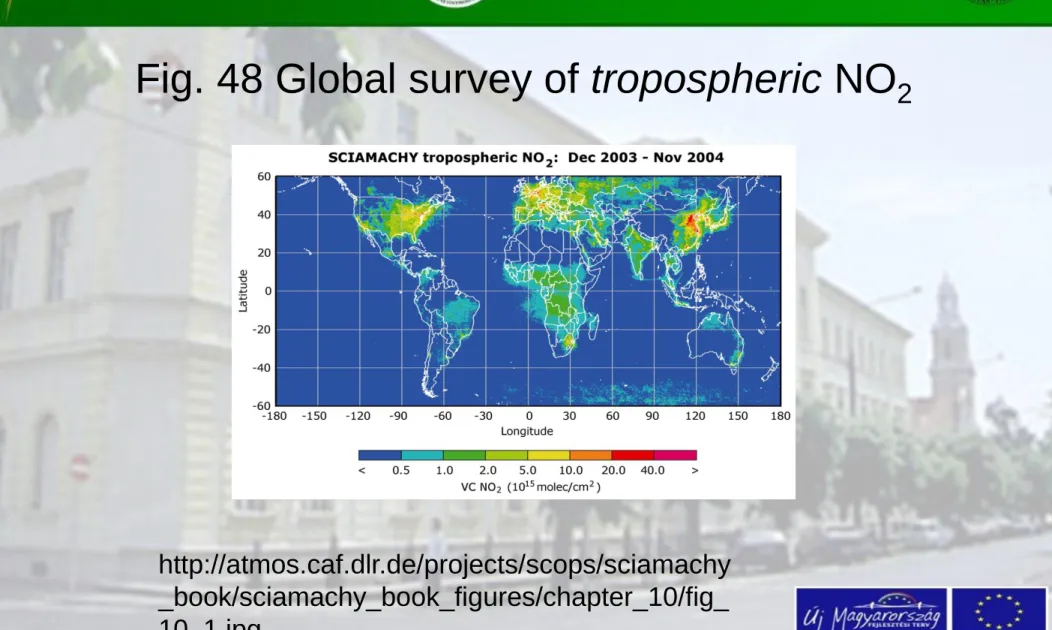
Fig. 48 Global survey of tropospheric NO
2http://atmos.caf.dlr.de/projects/scops/sciamachy _book/sciamachy_book_figures/chapter_10/fig_
10_1.jpg
• Discussion of the previous Fig. (43)
At about yearly mean of NO2 for the whole world were figured on the image
The investigated period was from December 2003 to November 2004
– the industrialised regions in the northern hemisphere and
- regions of biomass burning in the southern hemisphere can be followed sharply
- highest concentrations were observed around Japan (Image taken by A. Richter, IUP-IFE, University of Bremen)
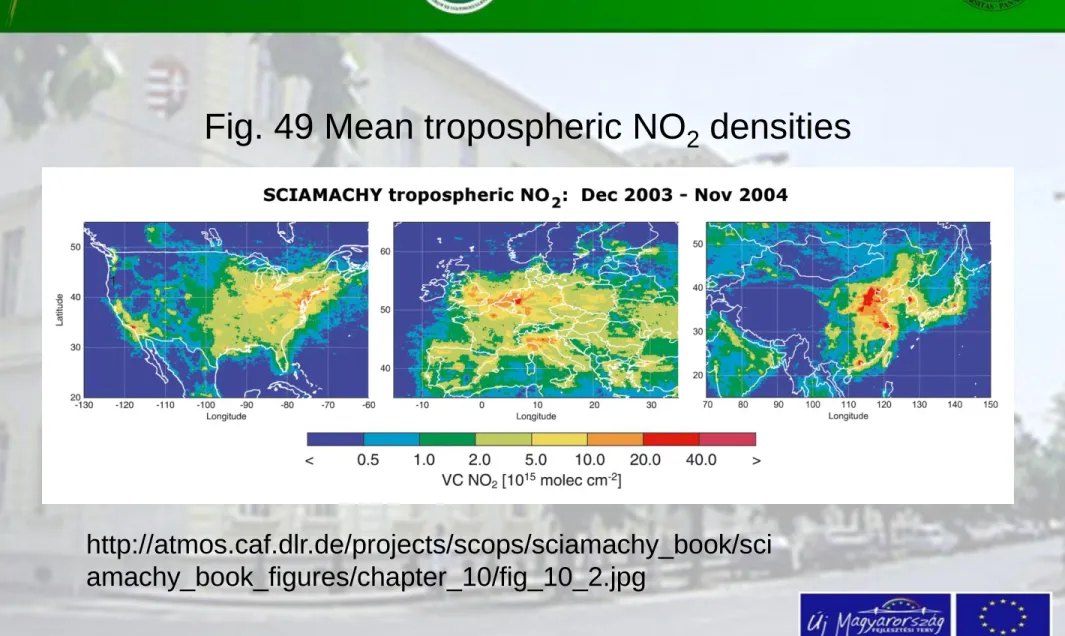
Fig. 49 Mean tropospheric NO2 densities
http://atmos.caf.dlr.de/projects/scops/sciamachy_book/sci amachy_book_figures/chapter_10/fig_10_2.jpg
The image 44 contains NO
2changes for the industrialised part of the world.
The first graph is for the United States;
the second for Europe and the third one for Asia
Increase in data of the United States and China between December 2003 and November 2004 are obvious.
(Image: A. Richter, IUP-IFE, University of Bremen)
Transportation (mainly motor vehicles) is by far the largest contributor of nitrogen emission, in contrast to the earlier discussed sulfur dioxide, where transport contributes
only a small extent to atmospheric contamination.
Antropogenic sources of NOx (for developed countries):
• Road and other transports (combustion under pressure and heat)
• Energy Production
– Electric power generation – Petroleum refining
• Fertilization (small extent)
• Combustion for industry use
• Production processes
• Burning of fossil fuels
Natural sources of NOx
Organic decomposition produces it both in water or land ecosystems. Less information is available on soil
properties as natural source of nitrogen oxides.
The prevailing nitrogen oxide type in soils seems to be the N2O. It acts as a green house gas also.
They contribute to the acid rain and photochemical smog!
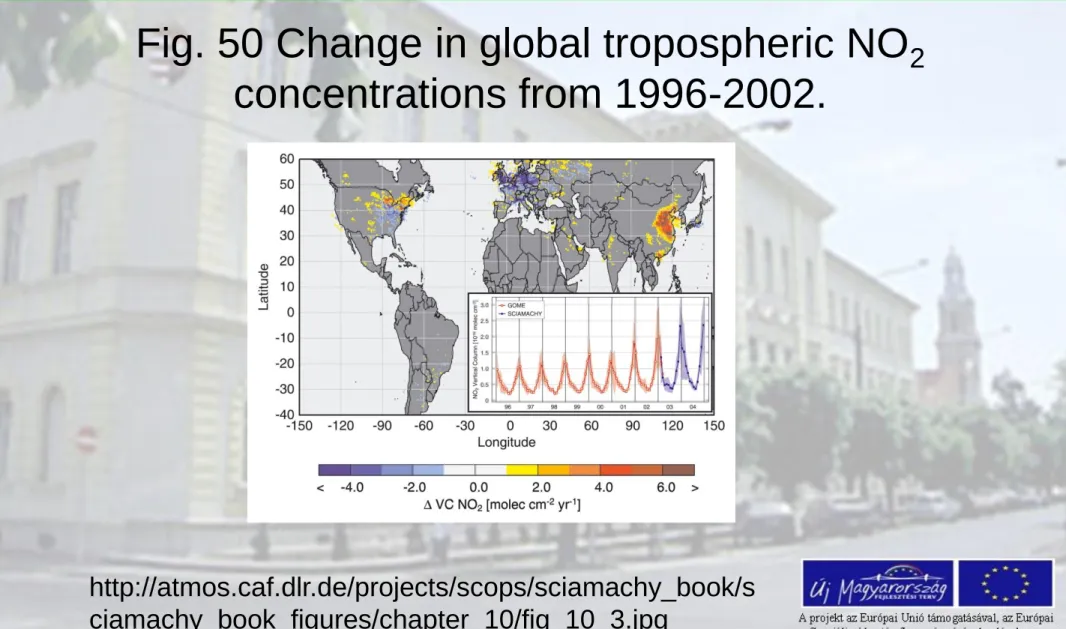
Fig. 50 Change in global tropospheric NO
2concentrations from 1996-2002.
http://atmos.caf.dlr.de/projects/scops/sciamachy_book/s ciamachy_book_figures/chapter_10/fig_10_3.jpg
The inset illustrates how NO
2concentrations have risen in China from 1996-2004. It is almost a
decade period from the close-past.
While 'old'; industrialised countries were able to stop the increase of NO
2emissions, the
economical growth in China turns out to be a strong driver for pollution
(Image: A. Richter, IUP-IFE, University of Bremen)
Ammonia is a colorless irritative gas. Agriculture, in the form of urine of animals is by far the largest antropogen source of ammonia emission.
Antropogen sources are:
- Livestock farming – more than 50% of all ammonia emissions (decomposition of urea from large animal wastes and uric acid from poultry wastes)
- Fertilization process
Natural sources
- water ecosystems (oceans, wetlands etc.) - Vegetation cover
- Biomass and other burnings
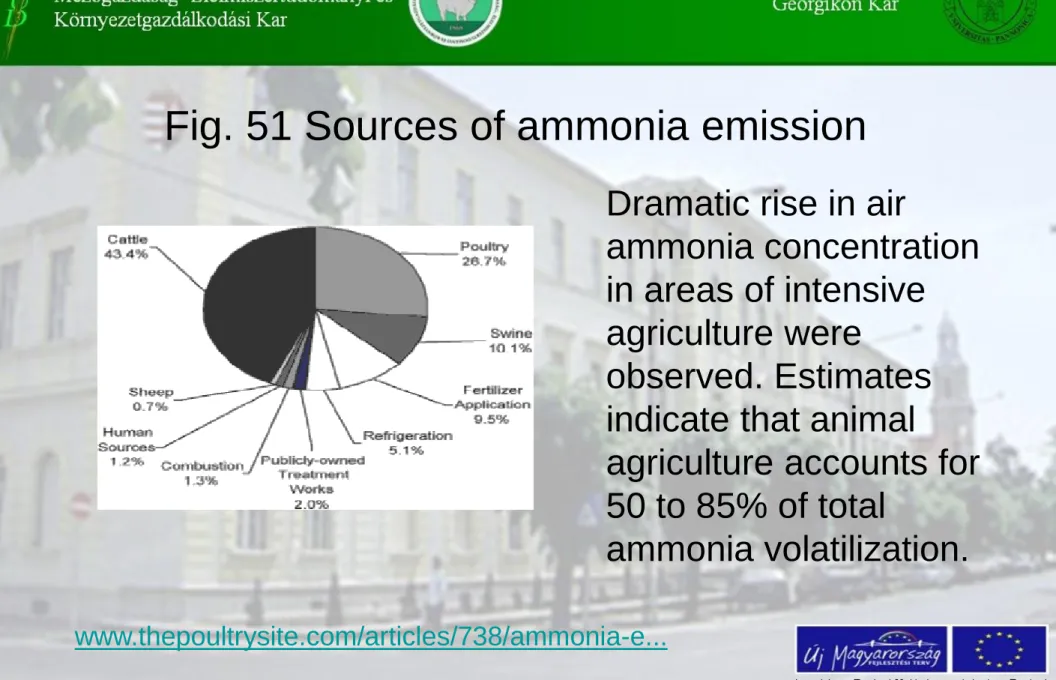
Fig. 51 Sources of ammonia emission
Dramatic rise in air
ammonia concentration in areas of intensive
agriculture were
observed. Estimates indicate that animal
agriculture accounts for 50 to 85% of total
ammonia volatilization.
www.thepoultrysite.com/articles/738/ammonia-e...