Modern analytical techniques in the
pharmaceutical- and bioanalysis
Modern analytical techniques in the pharmaceutical- and bioanalysis
Dr. Istvan Bak
University of Debrecen
Medical and Health Science Center Faculty of Pharmacy
Department of Pharmacology
Pharmacutical- and bioanalytical division
Kiadó • Budapest, 2011
© Dr. Bak István, 2011
Kézirat lezárva: 2011. október 31.
ISBN KIADÓ
A kiadásért felel a:
Felelıs szerkesztı:
Mőszaki szerkesztı:
Terjedelem:
University of Debrecen
Medical and Health Science Center Faculty of Pharmacy
Department of Pharmacology
Pharmacutical- and bioanalytical division
Modern analytical techniques in the pharmaceutical- and bioanalysis
Dr. Istvan Bak assistant professor
Debrecen
2011
Preface
The aim of this lecture note is to help pharmacy students of the University of Debrecen to the successful completion of the pharmaceutical- and bianalytical chemistry course. It was a problem until now, that there was not available a unified book or lecture note, so separated books had to be used for the different topics. My goal was to create a lecture note which includes the latest and most modern methods in order to give competitive knowledge to the students
Currently, the trend in the pharmaceutical industry and bioanalytical measurements is that the analytes of interest in very low concentrations must be measured from lower and lower sample volumes. This note presents various instrumental analytical techniques, sample preparation methods, in vitro and ex vivo systems which are frequently used in the drug R &
D-, production- and quality control-processes and in pharmacokinetic, toxicity and drug metabolism studies. Because the detailed discussion of the techniques is not possible in this note at the ends of the chapters I suggested books which deal with the given technique in detail.
I hope that this lecture note greatly facilitates the preparation of students for examinations and that after graduation they can use it as a reference.
Debrecen, 31/10/2011
István Bak
Contents
I. Introduction 1.
II. Structural analysis of small organic molecules 2.
II.1. Ultraviolet-Visible (UV-VIS) spectrophotometry 2.
II.2. InfraRed (IR) spectroscopy 5.
II.3. Mass spectrometry in the idenfication of small organic molecules 10.
III. Sample preparation and microextraction techniques in the analysis of drugs 23.
III.1. Extraction from solid samples 23.
III.2. Extraction from liquids 26.
III.2.1. Solid Phase Extraction (SPE) 26.
III.2.2. Solid Phase MicroExtraction (SPME) 29.
III.2.3. Liquid Phase MicroExtraction (LPME) 31.
III.2.4. Molecularly Imprinted Polimers (MIPs) 33.
III.2.5. Turbulent Flow Chromatography (TFC) 36.
IV. Chromatographic techniques 40.
IV.1. Gas Chromatography (GC) 47.
IV.1.1. Applied gases 48.
IV.1.2. Sample introduction 49.
IV.1.3. Columns 51.
IV.1.4. Detectors 53.
IV.1.5. Application of GC 54.
IV.2. High-Performance Liquid Chromatography (HPLC) 55.
IV.2.1. Eluents 56.
IV.2.2. Sample introduction 57.
IV.2.3. Columns 58.
IV.2.4. Detectors 59.
IV.2.5. Applications of HPLC 60.
IV.3. Supercriticalfluid Chromatography (SFC) 60.
V. Human drug metabolism 64.
V.1. Phase-I metabolic reactions 65.
V.1.1. The cytochrom P450 enzyme system 67.
V.1.2. Non-microsomal oxidation 74.
V.1.3. Reduction 75.
V.1.4. Hydrolysis 75.
V.2. Phase-II metabolic reactions (conjugation) 76.
V.2.1. Glucuronidation 77.
V.2.2. Glutathione conjugation 79.
V.2.3. Acetylation 80.
V.2.4. Sulphation 81.
V.2.5. methylation 82.
V.2.6. Amino acid conjugation 83.
VI. Biomimetic modell systems in the drug metabolism studies 85.
VI.1. Synthetic porfirines 85.
VI.2. The Fenton-reaction 88.
VI.3. Electrochemical oxidation 90.
VI.4. Experimental setups for the investigation of Phase-I and II reactions 92.
VII. In vitro and ex vivo techniques in the drug metabolism studies 95.
VII.1. Supersomes 96.
VII.2. Human Liver Microsomal, Cytosolic and S9 fractions 97.
(HLM, HLC, HLS9)
VII.3. Immobilized Enzym Reactors (IMER) 99.
VII.4. Liver cell lines 102.
VII.4.1. HepG2 cell line 102.
VII.4.2. Transgenic cell lines 103.
VII.4.3. Hepatocytes 103.
VII.5. Liver slices, isolated perfused liver 104.
VII.6. Integrated discrete Multiple Organ Co-culture system (IdMOC) 108.
I. Introduction
Instrumental analytical chemistry is a scientific field which includes a huge amount of different techniques. These techniques are widely used in different parts of the research, drug developement, quality control, clinical diagnostics, structural analysis and many many more (Figure 1.).
Figure 1.: Application of analytical techniques (PK: pharmacokinetics; PD: pharmacodynamics; TDM:
Therapeutic Drug Monitoring)
In the XXIst century there is an increased demand during the drug research and development process, drug synthesis, and drug therapy, in the analysis of the structure and concentration of different analytes can be found in very low concentrations in the samples. For the sake of this it is necessary the preparation of pure substances, the separation of the analytes of interest from the impurities or the possible elimination of the unnecessary matrix components. So nowadays the “instrumental” analysis involve not simply the measurement itself, but also a complex process including sampling, sample preparation, measurement and evaluation of the results as well. The increasing quality claim on the market requires the analysis of a great number of samples in a short period of time. Thus, improving progress can be observed in reducing the volume of samples, in the development of high-through screening methods and in automation. In order to get accurate and reliable results, it is necessary to know the applied techniques as well as the information they provide, very well.
Analytical techiques
Drug R & D
Life Sciences drug developement
quality control
diagnostics, TDM
forensic science
proteomics, genomics, metabolomics
drug research, toxicology, PK, PD, metabolism, clinical pharmacology
Analytical techiques
Drug R & D
Life Sciences drug developement
quality control
diagnostics, TDM
forensic science
proteomics, genomics, metabolomics
drug research, toxicology, PK, PD, metabolism, clinical pharmacology
II. Structural analysis of small organic molecules
The most of the drugs on the market are synthetic, less part are semi-synthetic or has natural origin. The drug research and development is a very long (5-10 years) process through which screening of thousands of compounds is necessary. Often a well characterized molecule with well known pharmacological effects is modified; however, it is possible the chemical modification of a natural structure (semi-synthetic process) as well. Does not matter which process is applied, in every case necessary the characterization of the newly synthetized or isolated molecule in detail. Beside the physical properties the structure of the molecule is analyzed using different analytical techniques. We can get useful information about the structure if we investigate the ultraviolet-visible (UV-VIS), infrared (IR), mass (MS) and nuclear magnetic resonant (NMR) spectra of the molecules.
II.1. UV-VIS spectrophotometry
Information content of the UV-VIS spectra far less compared to the mentioned above, however, during the structural identification of a compound it is necessary to measure the UV-VIS spectrum because it could give us important information about the possible byproducts, intermediers, or the purity of the reaction products either in the drug research or in the production.
In that case when UV-VIS spectrophotometry is used only for quantitative measurements we can get important information from spectrum-structure relationships, because based on these it is possible to determine the detection wavelength or whether there are any disturbances at the given wavelength and so on. This shows, although the information value of UV-VIS spectrophotometry relatively low but UV-VIS spectra give important supportive information in the structural identification of a molecule.
The 200-780 nm region of the electromagnetic spectrum is the UV-VIS range, which can be found between the X-ray and IR radiations (Figure 2.). Light absorption in this range induces electronic transitions between the highest occupied (HOMO) and lowest unoccupied (LUMO) molecular orbitals. The UV-VIS spectra originate from the excitation of the electrons, therefore UV-VIS spectroscopy often mentioned as electronspectroscopy.
Figure 2.: the electromagnetic spectrum
When atoms become molecule molecular orbitals with higher (antibonding-σ*) and lower energy (bonding-σ) are formed from the atomic orbitals. That kind of molecules in which atoms with non-binding electron pair can be found has non bonding (n) molecular orbital also. The energy of non bonding orbitals is higher than the energy of the bonding, and lower than the energy of the antibonding orbitals (Figure 3.).
Figure 3.: energy of molecular orbitals and electronic transitions
The absorption of UV or VIS radiation corresponds to the excitation of outer electrons.
Possible electronic transitions of σ, π, and n electrons can be seen in Figure 3.
σ → σ* transitions: an electron in a bonding σ orbital is excited to the corresponding antibonding orbital. The energy required is large. Absorption maxima due to these transitions are not seen in typical UV-VIS spectra, it is seen in the vacuum-UV-region.
n → σ* transitions: saturated compounds containing atoms with lone pairs (non-bonding electrons) are capable of these transitions and usually need less energy than σ → σ*
E σ∗
π∗
π σ n
E σ∗
π∗
π σ n
cosmic gamma X-ray UV VIS IR microwave radio waves radiation
λ(m)
cosmic gamma X-ray UV VIS IR microwave radio waves radiation
λ(m)
transitions. These can be initiated by light whose wavelength is in the range 150 - 250 nm.
The number of organic functional groups with n →σ* peaks in the UV region is small.
n→ π* and π → π* transitions: most absorption spectroscopy of organic compounds is based on transitions of n or π electrons to the π* excited state. This is because the absorption peaks for these transitions fall in an experimentally convenient region of the spectrum (200 - 700 nm). These transitions need an unsaturated group in the molecule to provide the π electrons.
That groups which possess absorption alone in the UV-VIS region are called as chromophores, while other functional groups which modify the absorption of a chromophore are the auxochroms.
The absorption of molecules depends on the wavelength of the light applied. If we measure the absorption on each wavelength and plot the absorbance versus the wavelength we get a characteristic curve, so called absorption spectrum of the investigated compound. There are absorption bands and maximums on the spectra. There is strong relationship between the position, intensity and shape of the band and the structure of the molecule. The applied solvent in which the compound of interest is dissolved has a strong effect on the shape and position of the bands. Peaks resulting from n → π* transitions are shifted to shorter wavelengths (blue or hypsochromic shift) with increasing solvent polarity. This arises from increased solvation of the lone pair, which lowers the energy of the n orbital. Often, the reverse (red or batochromic shift) is seen for π → π* transitions (Figure 4.). The increase in the intensity of a spectral band due to substituents or interactions with the molecular environment is called hyperchromic, the opposite of it is referred as hypochromic shift.
Figure 4.: spectral effects
A
λ
bathochromic hypsochromic
hyperchromic
hypochromic
A
λ
bathochromic hypsochromic
hyperchromic
hypochromic
This chapter is a simplified and very brief discussion of UV-VIS spectrophotometry.
There are much more complex situations encountered in practice, because there would be more excited electrons in a relatively simple molecule result in complex, broad, overlapping bands making it difficult the interpretation of the spectra. The detailed discussion of UV-VIS spectroscopy is not possible in this note, especially the description of characteristic spectra of different compounds. Who wants more information about UV-VIS spectrophotometry and its application in the analysis of different compounds I suggest the following book: Michael G.
Gore (Editor), Spectrophotometry and Spectrofluorimetry: A Practical Approach.
II.2. InfraRed (IR) spectroscopy
The infrared range (14000 cm-1-20 cm-1) of electromagnetic spectrum can be found between the UV-VIS and microwave region (Figure 2.). The IR region is divided into three regions far, mid and near. In structural analysis we use the mid IR region, also referred as analytical IR which starts at 4000 and ends at 400 cm-1.
The energy of the IR radiation is enough to excite only the vibrational and rotational transitions of a molecule, however, we get IR spectrum if there is a change in the dipole moment of the molecule. This means that homonuclear diatomic molecules are IR inactive.
There are two types of vibration can be distinguished, the stretching (ν) and bending (β, δ, γ) vibrations. The first one along the bonds, extension or shortening of the bond (Figure 5.), while the other case; the bond angles change (Figure 6.). In the case of polyatomic molecules or groups we can differentiate symmetrical and asymmetrical stretching vibrations. (Figure 5.).
asymmetrical symmetrical
Figure 5.: stretching vibrations
Bending vibrations are classified as in plane and out-of-plane, which would be scissoring and rocking in the case of in-plane vibrations; while in the other case there would be wagging and twisting vibrations (Figure 6.).
β, scissoring β, rocking δ, wagging γ, twisting
ip ip oop oop
Figure 6.: bending vibrations (ip: in plane; oop: out of plane)
Diatomic molecules have only stretching vibrations while polyatomic molecules have a diverse range of vibrations result in a more complex IR spectrum. Polyatomic molecules containing many (N) atoms will have 3N degrees of freedom (translational, rotational, and vibrational). Subtracting the rotational and translational motions from 3N, there are 3N−5 degrees of freedom for any linear molecule (for example: CO2) and 3N−6 for any non-linear molecule (for example: H2O). N in both examples is three, and so CO2 has four vibrational modes and water has three. The degrees of freedom for polyatomic molecules are summarized in Table 1.
Table 1.: Degrees of freedom for polyatomic molecules.
type of degrees of freedom non linear molecules linear molecules
translational 3 3
rotational 3 2
vibrational 3*n-6 3*n-5
total 3*n 3*n
From this simple equation it is easy to calculate the numbers of vibrations of a polyatomic molecule, theoretically how many bands can be seen in the spectrum but it is not true in the practice. The reasons are that the complex vibrations of polyatomic molecules originated from fundamental vibrations. Furthermore, there are other factors that may complicate the interpretation of infrared spectra. These factors should be considered when studying spectra as
these can result in important changes to the spectra and may result in the misinterpretation of bands. The number, place, shape and intensity of the bands are influenced by the appearance of overtone and combination bands. Overtones are analogous and are multiples of the fundamental frequency. The energy required for the first overtone is twice the fundamental, assuming evenly spaced energy levels. Since the energy is proportional to the frequency absorbed and this is proportional to the wavenumber, the first overtone will appear in the spectrum at twice the wavenumber of the fundamental vibration. Combined bands arise when two fundamental bands absorbing at ν1 and ν2 absorb energy simultaneously. The resulting band will appear at (ν1 + ν2) wavenumbers. There are further influencing factors e.g. the Fermi resonance and different couplings. There are other problems which further complicate the interpretation of the IR spectra. Some of the vibrations IR inactive while others have the same vibrational frequency also called degenerate. Let’s see a simple example the CO2. It is a linear molecule containing 3 atoms, which has 4 vibrations (Figure 7.) as calculated from the equation mentioned above.
Figure 7.: vibrations of the CO2 molecule
Despite if the calculation above, the IR spectrum of CO2 contains only 2 bands in practice.
For a vibration to give rise to the absorption of infrared radiation, it must cause a change in the dipole moment of the molecule. The larger the change the more intense will be the band.
The asymmetrical stretching vibration of CO2 gives a strong band in the spectrum at about 2350 cm–1. The symmetrical stretching vibration is inactive in the IR because the net change in the dipole moment of the molecule is 0 after absorption. The in plane and out of plane bending vibrations have the same frequency (degenerated) and this is why result in only one band. In summary, in the case of CO2, two bands are degenerate, and one vibration does not cause a change in dipole moment.
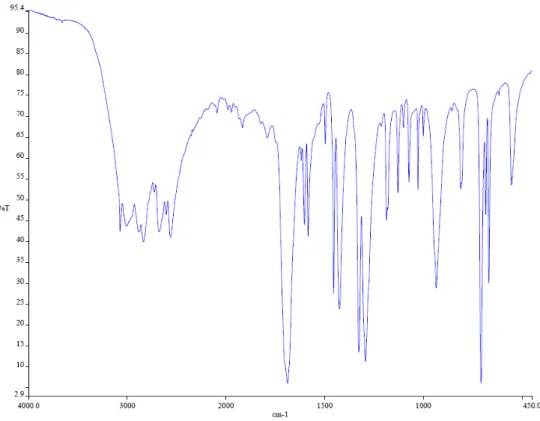
From the above it is clear that the spectral interpretation is not so easy. Generally speaking that the bands originated from stretching vibrations can be found at higher, while bands corresponds to the bending vibrations can be found at lower frequencies. This is right for the bond strength also; the stronger the bond the higher will be the vibrational frequency. It can be seen that in the case of IR spectroscopy we use wave numbers or frequency (ν), in practice, in contrast to UV-VIS where wavelength is used. IR spectra are plotted as percentage of transmittance (T%) vs ν (cm−1) (Figure 8.).
Figure 8.: IR spectrum of benzoic acid
An IR spectrum of a given compound is divided in two. Functional group (~ 4000 cm-1-1000 cm-1) and fingerprint (~ 1000 cm-1>) regions are distinguished. The former contains fewer bands in comparison to the latter one. If the fingerprint region of two molecules are completely overlap this means that the two substances are identical. The functional group region, as the name suggest, contains bands correspond to functional groups, specific bonds and groups of atoms, which are called characteristic group frequencies. These can arise in the spectrum in the case of X-Y endgroups where the mass of the X and Y atoms are significantly different. For example the stretching vibration of X-H (X: O, N, C) (Figure 9.).
500 1000
1500 2000
2500 3000
3500
4000 cm-1
X-H X≡Y X=Y X-Y
Figure 9.: characteristic frequencies: X–H stretching , the triple-bond and the double-bond region
The O-H bands can be found at the highest while the C-H at the lowest frequencies in the X-H region. The different X-H bands easily distinguished, however, take into account the various inter- and intramolecular effects can significantly influence the shape, position and intensity of the bands. Characteristic frequencies may appear in that cases when the force constant of a given group is significantly higher than the neighborings, for example multiple bonds (C=C, C=O, C=N, C≡C, C≡N). The bands corresponding to the X-Y single bond can be found between 500 and 1500 cm-1. Usually it is difficult to identify these bands because many bending vibrational bands can be seen in this region also. The 1500-2000 cm-1 region is the double, while the 2000-2500 cm-1 region is the triple-bond region (Figure 9.).
Because the vibrational frequencies of a given bond or group of atoms are near the same in different chemical environment making it possible spectral interpretation. However, since the bond or group only partially independent from the rest of the molecule the bands will not appear at distinct wavenumbers but in frequency ranges within which the characteristic absorption bands are likely to occur. If we can identify one or more bands of a bond or group during spectral interpretation it confirms its presence, however lack of bands will not evidence the contrary because the place, shape, intensity of a band is influenced by many intra- and intermolecular factors, steric and electronic effects, appearance of combined and overtone bands, etc..
Despite the interpretational difficulties IR spectra can provide more structural information, compared to UV-VIS, since the presence of specific bonds or groups can be evidenced. However, the complete structural identification can not be done by IR spectroscopy alone but complement other spectroscopic methods (MS, NMR, UV-VIS) may help us in the designation or identification of the possible structure. The detailed discussion of IR spectroscopy is not possible in this note, especially the description of characteristic spectra
of different compounds. For further, detailed information see: Barbara Stuart: Infrared Spectroscopy: Fundamentals and Applications.
II.3. Mass spectrometry in the identification of small organic molecules
The characteristics of mass spectrometry (unique sensitivity, speed, specificity, broad applicability) stand out as a result of the analytical techniques. The first mass spectrometer (MS) was created by J. J. Thomson in 1912. The development of MSs has been continuous since then. Earlier it was used for the measurement of pure samples containing only one component, however, combining with different separation techniques extensive use was made possible as qualitative and quantitative measurements of complex samples are easy to carry out. A schematic block diagram of MS equipments can be seen in Figure 10. The sample introduction could happen directly or with the application of a separation technique (GC, HPLC, CE, etc.). After this the analytes of interest introduced into the ion source where charged particles are formed than transferred to the analyzer. The analyzer separates the charged particles by their mass/charge (m/z) ratio and the intensity of the separated ions is detected. The ion intensities plotted vs m/z result in the mass spectrum, which provides qualitative information. The ion source, analyzer and detector can be found in ultra high vacuum, except those equipments which apply atmospheric pressure ion sources (API).
Figure 10.: schematic block diagram of an MS equipment
Vacuum system
Io n s o u rc e
Analyzer
D et ec to r
Data handling system, computer
S a m p le in tr o d u ct io n
Vacuum system
Io n s o u rc e
Analyzer
D et ec to r
Vacuum system
Io n s o u rc e
Analyzer
D et ec to r
Data handling system, computer
S a m p le in tr o d u ct io n
We can differentiate the ion sources based on the applied energy used for ionization. One of the most frequently used is the electron ionization (EI) formerly called electron impact ion source (Figure 11.). The sample is evaporated into the ionization chamber. This also means that this is suitable for the ionization of that kind of compounds which can be evaporated without any decomposition. Otherwise, other ionization techniques should be used.
Figure 11.: the EI ion source
The EI source contains a heated filament giving off electrons which are accelerated towards an anode and “collide” with the molecules of the injected sample. If the electrons have enough energy one electron is expelled from the molecule formed a charged particle called molecular ion (M+.) in this case. The formed charged particles are repelled by the repeller, which has the same charge as the formed charged particles, from the ionization chamber than a series of lenses accelerate, focus and transfer the ions to the analyzer. During ionization beside the molecular ion two slow electrons are also formed. If the slow electrons are captured by a molecule negatively charged molecular ion will be formed:
In most cases the molecular ion undergoes fragmentations. Because this is a radical cation with an odd number of electrons there can be formed either a radical (R.) and a cation with an
+ 2 e
-M: + e
-M: + e
-M M - .
+ . + 2 e
-M: + e
-M: + e
-M M - .
+ .
analyzer sample
e-
heated filament repeller electrode
anode
analyzer sample
e-
heated filament repeller electrode
anode
even number of electrons (EE+), or a neutral molecule (N) and a new radical cation with odd number of electrons (OE+.) during fragmentation (Figure 12.).
Figure 12.: fragmentation of the molecular ion
(EE: even electron number, OE: odd electron number, R: radical, N: neutral molecule)
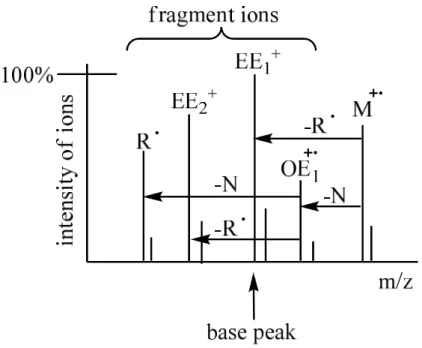
The product ions derived from the molecular ion (also called parent ion) can undergo further fragmentation, and so on. The formed ions are separated by the analyzer according to their mass/charge (m/z) ratio, and are detected in proportion to their abundance. The abundance or intensity of the ions plotted vs. the m/z result in the mass spectrum (Figure 13.).
Figure 13.: a mass spectrum and fragmentation
The most intense peak is called base peak and is arbitrarily assigned the relative abundance or intensity of 100%. The abundances of all the other peaks are expressed as the percentages of the base peak. The molecular ion, if it can be identified, can be analyzed as the most intense peak in the highest m/z area. If the charge is 1 this gives the relative molecular mass of the
molecule. Usually 70 eV of ionization energy is used for ionization which is adequate for the formation of the molecular and fragment ions either. In general, the spectra measured at this energy are the most informative. Unfortunately very often the molecular ion can not be identified. In these cases the reduction of the ionization energy result in the increased stability of the molecular ion, consequently we can identify easier, but the number of the fragment ions will decrease giving less information from the structure of the molecule. Another possibility for the determination of the molecular weight is the application of alternative ion sources. The EI ion source is also called as hard source. A gentle method is the chemical ionization (CI), which is a soft ionization technique. The construction of the CI sources nearly the same as the EI sources. The only difference is a side capillary for the introduction of the reagent gas. The first step is the ionization of the molecules of the reagent gas, applied in excess, according to the EI method. This ion will then mostly collide with other reagent gas molecules creating a ionization “plasma”. This plasma will ionize the molecules of interest through ion-molecule reactions, charge transfer, proton transfer, adduct formation, etc. The most frequently used reagent gas is the methane but we can use isobuthane or ammonia as well. A very simplified mechanism of the methane as an example is illustrated by the following equations (M: sample molecule):
It can be seen that in contrast to the EI ionization not a “simple” molecular ion is formed but so called pseudo or quasi molecular ion ([M+H]+) which is usually the protonated form of the molecule, however other adducts could be formed also. In the case of CI ionization the resulted spectra are simpler in comparison with the EI-MS spectra, because these contain less fragment ions; however the main advantage is that we can determine the molecular mass of the molecule. The disadvantage of this source is the same as the EI ion source, only heat- stable compounds can be investigated. Otherwise, other ionization techniques must be used (FAB/FIB, MALDI, etc.).
CH
4+ e
-CH
4+ CH
4+. CH
3++ CH
4CH
5++ M C
2H
5++ M
CH
4+. + 2 e
-CH
3. + CH
5+C
2H
5++ H
2CH
4+ [M+H]
+[M+C
2H
5]
+The most important part of the MS spectra is the molecular ion because it gets the relative molecular weight of the molecule. Furthermore, the elemental composition of the molecule could be determined by the application of high resolution equipments. There are some simple rules which help us in the identification of the target molecule.
The first one is the nitrogen rule. It states that a compound that has no nitrogen in it or an even number of nitrogen atoms will have an even mass number and an odd number of nitrogen atoms cause an odd mass number. This can be seen in the examples in Figure 14.
The next one is corresponds to the rings and multiple bonds or the degree of unsaturation (US). The degree of unsaturation should also be considered. This is applied for elements with rings and double bonds. In a molecule with the formula AyQnRzTx (A = H, Hlg;
Q = O, S; R = N, P; T = C, Si) the sum of all the rings and multiple bonds can be calculated using the following equation:
Unsaturation (US) = X - 1/2Y + 1/2Z + 1
If the result ends in ½, this indicates an even electron (EE+) ion and leaving the ½ yields the correct value.
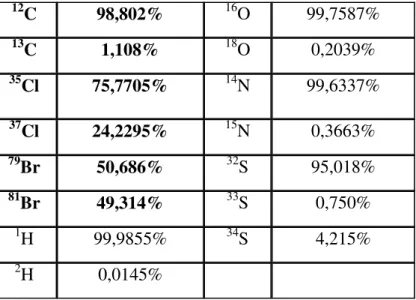
The third help in the interpretation of MS spectra is the isotopic pattern of the elements because elements are mixtures of isotopes except some monoisotopic elements. The presence and number of elements such as bromine, chlorine, silicon and sulphur are easily recognized from the isotopic structures produced in the spectrum. Table 2. lists some elements and the abundances of their natural isotopes. Depending on the isotopes we can differentiate so called “A”, “A+1” and “A+2” elements. The “A” elements are monoisotopic (19F, 127I, H).
Although H has a natural isotope (deuterium) its abundance so small this is why H is considered as monoisotopic element. The “A+1” elements have one isotope that is 1 unit heavier than the most abundant isotope (12C, 13C, 14N, 15N). The “A+2” elements have one isotope that is 2 units heavier than the most abundant isotope (35Cl, 37Cl, 79Br, 81Br).
Figure 14.: EI-MS spectra of benzoic acid, 3-amino-benzamide and 3-amino-benzoic acid m/z M+.
m/z M+.
m/z M+.
m/z M+.
m/z M+.
m/z M+.
m/z M+.
m/z M+.
m/z M+.
Table 2.: relative abundances of atoms and their natural isotopes
12C 98,802% 16O 99,7587%
13C 1,108% 18O 0,2039%
35Cl 75,7705% 14N 99,6337%
37Cl 24,2295% 15N 0,3663%
79Br 50,686% 32S 95,018%
81Br 49,314% 33S 0,750%
1H 99,9855% 34S 4,215%
2H 0,0145%
The presence of chlorine and bromine atoms is the easiest to recognize. The abundances of chlorine isotopes are ~3:1. If the molecule contains one chlorine atom the ratio of the M and M+2 ion intensities is 3:1 in the spectrum because each contain one chlorine atom - but the chlorine can be either of the two chlorine isotopes, 35Cl and 37Cl. So, if you look at the molecular ion region, and find two peaks separated by 2 m/z units and with a ratio of 3:1 in the peak heights, this tells you that the molecule contains 1 chlorine atom. This 3:1 ratio can be seen at the fragment ions until the fragment contains the chlorine atom. In the case of bromine the ratio of the M and M+2 peak intensities is ~ 1:1. When the molecule contains 2 chlorine atoms an M+4 peak is appear because the detected particles are the followings:
R-35Cl35Cl R-35Cl37Cl R-37Cl37Cl
M M+2 M+4
The intensities of the observed peaks can be calculated using a simple equation:
(a+b)n
where a and b the abundances of the isotopes, and n the number of these in the molecule. For example in the case of two chlorine atoms: (3+1)2 = 9+6+1, consequently the peak intensities are: M:M+2:M+4=9:6:1.
If the molecule contains different atoms the corresponding polynoms multiplied give the connexion corresponds to the isotopic ratios:
(a+b)n x (c+d)m x ...
In the spectra we can find a small line 1 m/z unit to the right of the main molecular ion peak.
This small peak is called the M+1 peak. The M+1 peak is caused by the presence of the 13C isotope in the molecule and makes up 1.11% of all carbon atoms. The M+1 peak in a mass spectrum can be used to estimate the number of carbon atoms in an organic compound using the following equation:
These simple or seemingly simple rules can help us in the interpretation of mass spectra. There are more possibilities for the identification of a given structure. On the one hand the measured spectrum can be compared to that ones can be found in spectral libraries.
Unfortunately these databases are so expensive depending on their size. After comparison the computer gives a similarity index (SI). But frequently occur that despite the high SI the compounds are not the same or there are more spectra in the library which has high SI. In these cases we must decide which is the appropriate. In order to do this it is necessary to know that processes by which the structure of the molecule can be identified. This is not possible in detail in this note only the very basic processes will be presented. Who wants more information I suggest the following books: Jürgen H. Gross, Mass Spectrometry, A textbook and Edmond de Hoffmann and Vincent Stroobant, Mass Spectrometry, Principles and Applications. In the followings some typical fragmentation reaction will be presented.
The fragmentation of the molecular ion is a very fast process including a series of parallel reactions and can occur via cleavage of bonds or molecular rearrangements. Bond cleavage would be homolytic when the electrons forming the bond shared between the generated fragments or heterolytic when both electrons can be found on one fragment. The simplest fragmentation reaction is the σ-bond cleavage or direct dissociation (Figure 15.).
After ionization through cleavage of the bond one of the fragments keeps the charge and form a carbocation, while the other is a radical. That which group leaves out as a radical determined by the stability conditions.
Figure 15.: σ-cleavage
n I
c M
I
M
=
×
+1×
1 1 100
n I ,
c M
I
M
=
×
+1×
1 1 100
,
R
3-C:C-R
3e
-R
3-C
+. C-R
3σ R
3-C . +
+C-R
R
3-C:C-R
3e
-R
3-C
+. C-R
3σ R
3-C . +
+C-R
3 3The stability of carbocations is decreasing in the following order: tertiary, secondary, primary.
In the case of branched carbon-chain the cleavage right next to the branch is preferred.
Cleavages that lead to the formation of more stable carbocations are favored. When the elimination of more than one radical is possible the largest alkyl radical will be lost preferentially (Stevenson-Audier rule). This does not mean that only that bond is cleaved.
There are other peaks in the spectrum corresponding to other fragments but the intensities of these will be much lower.
The cleavage of the bond at the alpha position to the charge-carrying atom is called αα-αα cleavage (Figure 16.), which is very typical of heteroatom (N, O, S) containing molecules.
Figure 16.: α-cleavage
(half arrows indicate the displacement of a single electron while full arrows the displacement of an electron pair)
In this process a radical and EE+ ion are formed via homolytic bond cleavage. After initial ionization at a heteroatom or a group that can act like a heteroatom, bond breaking occurs by moving one of the electrons from a σ-bond to the C atom that is α (i.e., adjacent) to the heteroatom or group. Molecules containing heteroatoms usually undergo initial ionization at the heteroatom through loss of a nonbonding (n) electron. If X is an aromatic ring or double bond, a π-electron may be lost during initial ionization. Similar fragmentation reaction can be induced by unsaturated bonds. In the case of olefins this process is called allylic- while in the case of aromatics it is called benzylic-cleaveage (Figure 17.). After bond cleavage the ion formed from the olefin is stabilized by cyclization. The benzyl ion presumably stabilized via rearrangement and forms the so called tropylium ion which is very stable and has diagnostic significance (Figure 17.).
Figure 17.: allylic-, benzylic-cleavage
In the previously discussed fragmentation reactions a radical loss occurred by simple cleavages. In the followings some relatively simple but important rearrangement reaction is presented. The best known rearrangement is the so called McLafferty-rearrangement (Figure 18.). This consists of the transfer of a H atom to a radical cation site using a six-atom ring as an intermediate. The occurrence of the McLafferty-rearrangement is limited to molecular ions possessing at least one γ-hydrogen for transfer to the acceptor atom. This rearrangement yields a neutral olefin and a new radical cation.
Figure 18.: McLafferty-rearrangement
The ions produced via McLafferty-rearrangement are relatively easy to identify and have diagnostic value. These are characteristic for carboxylic acids, esters, oximes, amides, ethers, etc. In the case of aliphatic and aromatic esters, there is a parallel rearrangement the McLafferty + 1, in which 2 H transfer is occurred (Figure 19.). The rearrangement is a two step process but the details are not fully elucidated yet.
Figure 19.: McLafferty+1 rearrangement
The ions formed in McLafferty and McLafferty + 1 rearrangements can be identified in the spectra of carboxylic acid esters.
The rearrangement of nitro group has diagnostic significance also. Nitroarenes are recognized from their characteristic neutral losses due to the NO2 group. The molecular ion may rearrange prior to loss of NO•. It has two possible mechanisms (Figure 20.). The formed ions than eliminate NO• and the remaining phenol-type ion can decompose further by elimination of CO.
N O O
N O O
e-
N O O
O N O
-NO O -NO
Figure 20.: possible mechanisms of nitro-group rearrangement
The ortho effect or ortho elimination (Figure 21.) gives us important information about the substitution pattern of an aromatic ring. This also involves the transfer of a H atom. The existance of a suitably 1,2-disubstituted cis-double bond presents an essential structural requirement for this fragmentation. Usually this double bond is part of an aromatic ring, hence the name. The ortho elimination requires a substituent (Y) to bear a hydrogen-accepting leaving group (Z) and another substituent (X) to be the hydrogen donor (OH, NH2, SH). After the rearrangement a neutral molecule is eliminated (ZH). Because of steric problems this neutral loss is absent in the spectra of meta or para isomers.
Figure 21.: general mechanism of ortho-effect
In this chapter the basics of the structural analysis of small organic compounds by MS have been discussed. It is important to note that not only the mentioned reactions can occur.
The more complex a molecule is the more complicated its spectrum and more difficult the structural identification. Of course it is very rare when absolutely unknown samples must be analyzed without any supporting information (elemental composition, possible structure, etc.).
In any other cases, however, should comply with the following steps when analyzing EI-MS spectra:
1. identification of the molecular ion (M+.), if possible
2. determination of elemental composition, rings and double bonds 3. looking forward characteristic ions, ion series
4. possible loss of neutral fragments 5. possible rearrangements
6. purpose of possible structure
The detailed discussion of mass spectrometry is not possible in this note, especially the description of characteristic EI-MS spectra of different compounds. For further, detailed information see: Jürgen H. Gross, Mass Spectrometry: A textbook; R. Martin Smith, Understanding Mass Spectra: A basic approach; and Edmond de Hoffmann and Vincent Stroobant, Mass Spectrometry, Principles and Applications.
III. Sample preparation and microextraction techniques in the analysis of drugs
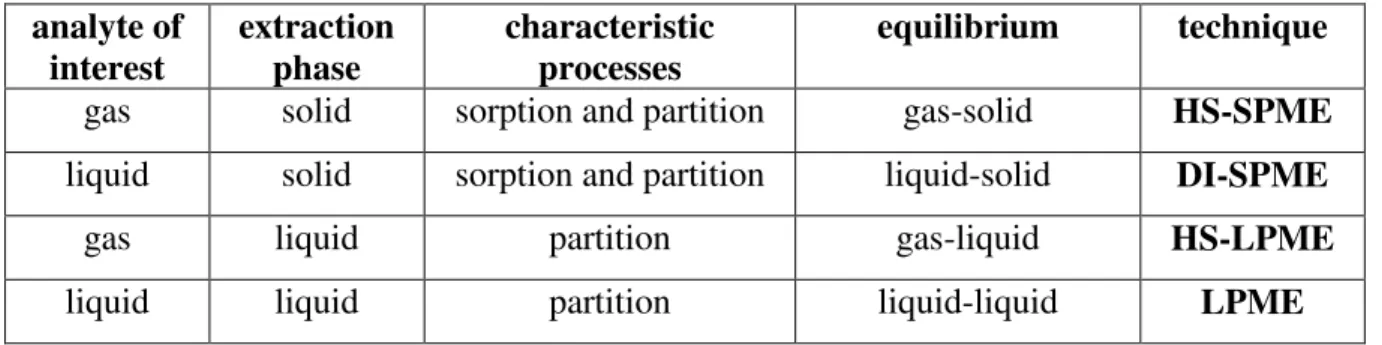
Often the samples can not be analyzed directly. Before analysis there must be carry out some kind of sample pretreatment or sample preparation process(es). The bottleneck of analytical measurements is the sample preparation because if we make mistakes during this process the result will be wrong whether we have the most sensitive, specific or the most expensive equipment. The choice of the applied technique depends on the analyte characteristics, the matrix and the sample volume. There are techniques which extract the total amount of analytes (liquid-liquid extraction-LLE, solid phase extraction-SPE) while others based on the establishment of a dynamic equilibrium between the sample and an extracting phase (solid- and liquid-phase microextraction-SPME, LPME). There was an intensive develepment in the extraction techniques in the last few decades. A good technique is fast enough, precise and has good reproducibility and low solvent consumption. Nowadays the most frequently applied extraction technique uses very small volume (some ml-s) of organic solvents or there is no solvent consumption either (so called solvent free extraction).
III.1. Extraction from solid samples
The simplest way to extract analytes from solid samples is that if the sample (e.g. a tablet) is put into a flask then adequate solvent is poured in the necessary volume into the flask than heat up and stir during extraction. The evaporation of the solvent is prevented by a condenser. The disadvantages of this technique are the followings: time and energy consuming, the applied glassware is easily broken but the main disadvantage is the application of “huge” amount (10-1000 ml) of organic solvents. The remaining solid material must be filtered and the solvent must be evaporated. This process can be speed up by the application of the so called Soxhlet-extractor. The main advantage of this is that always fresh solvent is used for the extraction. The disadvantages are the same as mentioned above. The extraction can be significantly speed up by the application of some kind of “instrumental”
accelerated technique. These include, among others, the Accelerated Solvent Extraction (ASE), the Microwave Assisted Extraction and the Supercritical Extraction (SFE). Although these techniques have high cost of investment, but the costs of operation (cost/sample) more profitable than the classical techniques mentioned above. The main advantage is the volume of the solvent significantly less (0-40 ml) compared to the “classical” techniques. This is not only an economical advantage. The low solvent consumption is a very important
environmental protection aspect as well. The utilization of elevated pressure and temperature increases the speed and effectiveness of the extraction in each case and reduces the extraction time. Another advantage is that the design of the equipments makes the possibility for the extraction of more than one sample in the same time.
The SFE has another advantage namely it applies gas as extraction solvent above its critical pressure and temperature. A compound becomes a supercritical fluid when maintained at a temperature and pressure above its critical point (Figure 22.). Under these conditions the compound is neither a gas nor a liquid. Supercritical fluids have similar solvent properties of liquids yet can be transported like gases.
Figure 22.: phase diagram of a pure substance (TP: triple point; CP: critical point)
The solvating power of the supercritical fluid can be adjusted by changing the pressure or temperature, or by adding a solvent modifier (e.g. MeOH). Two operation modes of extraction are used, dynamic and static. In the dynamic mode fresh supercritical fluid is supplied continuously; in the static mode the sample is extracted with a fixed amount of extraction fluid contained in a closed vessel. Usually the analytes extracted are isolated in a solvent after depressurization. The most frequently used extraction fluid is the CO2, because it has low critical temperature (31.1 oC) and its critical pressure is 72.9 atm but other gases are also used.
CO2 as the extraction fluid is proper for the extraction of apolar analytes only, because CO2 is absolutely apolar, however the polarity can be increased using different modifiers. The most frequently used modifier is the MeOH. SFE using CO2 modified with methanol is widely used in analytical toxicology, several SFE methods have been developed for analysis of drugs. The main advantage of SFE is the elimination of hazardous organic solvents because after depressurization only non-toxic (in the applied volume) gases are emitted into the air.
p
T
solid liquid
gas
supercritical liquid
TP CP p
T
solid liquid
gas
supercritical liquid
CP p
T
solid liquid
gas
supercritical liquid
TP CP
The microwave extraction method is the process of heating solid sample-solvent mixtures in a sealed (closed) vessel with microwave energy under temperature controlled conditions. Although used less frequently, the extraction also can be performed in an open vessel at atmospheric pressure also called microwave assisted Soxhlet extraction. The closed system provides significant temperature elevation above the atmospheric boiling point of the solvent consequently accelerates the extraction process. The microwave energy provides very rapid heating of the sample directly, which shortens the extraction time to 10–20 min per batch. After the heating cycle is complete, the samples are cooled and the sample is filtered to separate the sample from the extract for the analytical step. The use of microwave energy for heating up the samples, offers many advantages over traditional heating methods. The closed- vessel MAE allows extraction solvents to be rapidly heated to 2-3 times higher than their atmospheric boiling points resulting in shorter extraction times (10-30 minutes). The amount of solvent consumed is considerably less (20-30 ml). However, MAE has some drawbacks also. A compound will absorb microwave energy roughly in proportion to its dielectric constant, i.e., the higher the value of the constant the higher the amount of energy absorbed.
Because organic extractions typically involve non-polar solvents with very small, if any, dielectric constants, a polar co-solvent often had to be used to assist in heating the solution.
Use of a polar co-solvent led to the extraction of a broader spectrum of compounds in addition to the analytes of interest, creating potential interference problems during analysis. Another disadvantage is that MAE also does not overcome the traditional processing steps of filtration and evaporation.
In ASE, rapid extraction of solid matrices is performed using organic solvents by applying high temperatures (up to 200 oC) as well as applying high pressures (up to 20,000 kPa). The utilization of elevated pressures allows solvents to be used above their atmospheric boiling points to increase solvation power and extraction kinetics. Increased temperatures can also disrupt the frequently strong solute–matrix interactions. This increases the extraction efficiency and rate as well as simultaneously reduces the consumption of organic solvents and the extraction time. Both static and flow-through designs may be used. In the latter, fresh solvent is continuously introduced to the sample, improving the extraction but diluting the sample. Because of the above mentioned characteristics, extraction procedures which would have taken many hours of “classical” techniques can be carried out in minutes on a smaller sample. The extracts are usually concentrated and no evaporation is necessary. ASE has advantages over other extraction techniques including the reduced use of solvent and reduced time for extraction. Its disadvantages are related to thermal stability and extraction selectivity.
As ASE is used only with solid samples, in bio-analysis it could be applied to the analysis of different tissues or blood. However, in bio-analysis extraction is typically conducted on fluids, such as urine, serum, blood and plasma. Therefore, ASE is definitely not routinely applied in bio-analytical laboratories but a good choice in the pharmaceutical laboratories.
III.2. Extraction from liquid samples III.2.1. Solid Phase Extraction: SPE
The oldest method for the extraction of analytes from liquids is the liquid-liquid extraction (LLE). The simplest way to carry out this extraction is the application separating funnels. In this case the sample containing the analyte is shaken with an appropriate solvent. It is important that the sample must not be immiscible in the solvent. After separation of the phases that one which contains the analytes must be concentrated and analyzed. There are many disadvantages of the LLE. This technique is solvent and time consuming, because it is necessary to carry out extraction minimum three times in the practice. Further problems are that the applied glassware easily broken and often emulsion are formed which have to be broken. There is a continuous form of LLE (CLLE). In this case, depending on the properties of the sample different set ups must be used. The solvent consumption can be reduced if LLE is carried out in micro-volumes of course only in that case if the sample volume makes it possible, however, a more frequently used technique is the solid phase extraction (SPE).
In the case of SPE the liquid or gaseous sample passes through a solid sorbent on wich ultimately occurs the extraction process. Several implementation techniques are known, so we can talk about selective extraction, selective washing and selective elution depending on that after sample indroduction what is bound to the sorbent (extracted) and that after binding what can be eluted from the sorbent by changing the solvents, pH or the ionic strength. There are different forms of SPE sorbents (syringe, cartridge, disc, 96 well plate) on the market (Figure 23.). The weight of the packing is varied on a wide scale. Furthermore, there are a huge amount of different sorbents (normal- or reverse-phase, ion exchange, size exclusion and others developed for special purposes) commercially available.
Figure 23.: types of SPE sorbents
The choice of sorbent type and weight is depends on the sample volume and the physico- chemical properties of the analytes. A simplified method for the selection of the sorbent can be seen in Figure 24.
Figure 24.: selection of SPE sorbent
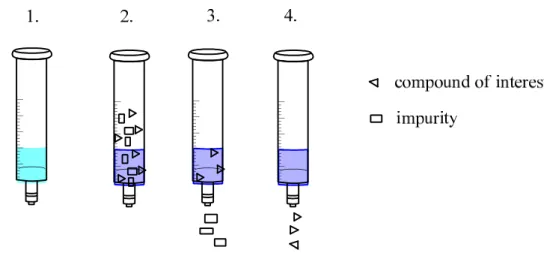
There are more SPE methods. The simplest is the so called 4 step SPE (Figure 25.). The first step is the conditioning the sorbent with appropriate solvent. After that the sample is loaded into the cartridge. The next step is the washing. The purpose of this is the elimination of the impurities and the last step is the elution of the analyte of interest.
compound of interest
ionic non ionic
polar semi-polar polar semi-polar apolar
RP-SPE C-18 pH adjustment
RP-SPE C-8; C-18 RP-SPE
C-18 NP-SPE
SDB IE-SPE
Ion exchange
compound of interest
ionic non ionic
polar semi-polar polar semi-polar apolar
RP-SPE C-18 pH adjustment
RP-SPE C-8; C-18 RP-SPE
C-18 NP-SPE
SDB IE-SPE
Ion exchange
Figure 25.: four step SPE (1.: conditioning; 2.: sample introduction; 3.: washing; 4.: elution)
The sample is transferred through the sorbent by the application of pressure or vacuum, however, in the case of small volume samples the gravitation or centrifugal forces also can be used. SPE is a favored sample preparation technique either in the diagnostic, pharmaceutical or research laboratories. Its main advantage is the low solvent consumption consequently it is not necessary the evaporation of the solvent. Furthermore it is relatively cheap, fast and easy the automation. Nowadays one of the most important factors is the time in the different processes. The throughput of SPE can be increased by the application of typically 12- or 24- port vacuum manifolds (Figure 26.). Generally speaking that SPE is very frequently used technique in the bioanalytical experiments because usually only very small volume of sample is used in this processes.
Figure 26.: vacuum manifold for SPE
The above discussed techniques have high sample needs and solvent consumption. Now that kind of techniques will be discussed which have very low or no solvent consumption and can be used with small sample volumes.
III.2.2. Solid Phase MicroExtraction: SPME
SPME is considered as a solvent free extraction technique based on equilibrium between the sample and the extraction phase. In comparison with SPE where the extracted amount of analyst more then 90%, here it is only 2-30%, however, the total amount is introduced into the analytical equipment. The extraction is carried out by a thin polymer coated silica fiber (Figure 27.). The analytes of interest are adsorbed on it than desorbed by heat (GC) or some µl-s of solvent (HPLC) and injected into the equipment. The silica fiber is typically 1 cm long and very easily broken so after extraction/desorption it must be withdrawn into a stainless steel needle (septum piercing needle, Figure 27.) and only in this position could be pierced the septum of the sampling vial or the injector port. The fiber lifting can be carried out by a manual device (Figure 27.) or an auto-sampler. The most frequently used polymer coatings are the poly-dimethyl-syloxane (PDMS), divinyl-benzene (DVB), poly- acrilate (PA), carbowax (CW) and carboxen (CAR), or the combination of these. The different coatings are color coded as well. The thickness of the fiber is varied and one fiber is suitable for the extraction of at about 200 samples.
Figure 27.: manual SPME device and SPME fibers
Septum piercing needle
Coated fused silica fiber Barrel and Z slot
Septum piercing needle
Coated fused silica fiber Barrel and Z slot
Depending on the place of the sampling we can differentiate head-space-SPME (HS-SPME) and direct-immersion-SPME (DI-SPME). In the first case (Figure 28.) the sample is placed into a vial than heat up, consequently the volatile analytes are diffused into the head-space of the vial. In order to reach the equilibrium faster the sample can be stirred as well. Then the SPME fiber is introduced into the head-space where adsorption occurs. The time of sampling is between 5-30 minutes. In the second case (Figure 28.) the SPME fiber is immersed directly into the liquid sample and the dissolved analytes will be adsorbed on the fiber. In this case the equilibrium is reached slower compared to HS-SPME.
Figure 28.: HS-SPME and DI-SPME
The SPME was introduced in 1989. There is an intensive development until now and it will further develop. Today the so-called solid phase dynamic extraction (SDME) syringes are commercially available where the extraction material can be found on the inner surface of a micro-syringe needle or it is packed into a small capsule and introduced into the syringe needle. Furthermore, SPME can be carried out in a short (typically 60 cm) capillary, for example in a GC capillary segment (in-tube extraction) as well. The throughput of SPME is not so good but it can be increased by the application with industrial robots. There has been developed an analytical sampler for 96 well plates. In this case 96 sampling occur in the same time. Furthermore, there is a special MALDI mass spectrometer with a 16 SPME fiber containing target plate, or SPME fiber containing pipette tips (in-tip SPME) are commercially available also.
In summary, SPME is a relatively cheap and good technique which is widely applied either in the pharmaceutical industry or in bioanalytical experiments.
III.2.3. Liquid Phase MicroExtraction: LPME
Based on the SPME there was developed the liquid phase microextraction (LPME) also. LPME has more types but common characteristic of these that the extraction phase is some kind of liquid in contrast to SPME. The first type of this is the so called Single-Drop Microextraction (SDME). In this case a small solvent drop is introduced into the sample from a microsyringe but the drop must not be broke down. After partitioning of the analyte between the sample and solvent drop the drop is withdrawn into the syringe and the sample can be directly injected into the equipment. Sampling would be from the head-space (HS-SDME), or directly from the liquid sample (DI-SDME) (Figure 29.). The main disadvantage of SDME is that the drop is not stable, easily breaking down. To eliminate this problem LPME had been further developed and other technical methods were introduced including the Hollow Fiber MicroExtraction (HFME).
microsyringe
solvent drop stirring bar
sample
HS-SDME DI-SDME
Figure 29.: HS- and DI-SDME
In this case the extraction process occurs in the pores of a hollow fiber in an immobilized organic solvent. This is easily accomplished by immersing the hollow fibre into the solvent for a few seconds, which immediately flows into the pores by capillary forces. The lumen of the hollow fiber is then filled with some µl of so called acceptor solution and the set-up is introduced into the sample. The analytes of interest are extracted from the sample (aqueous)
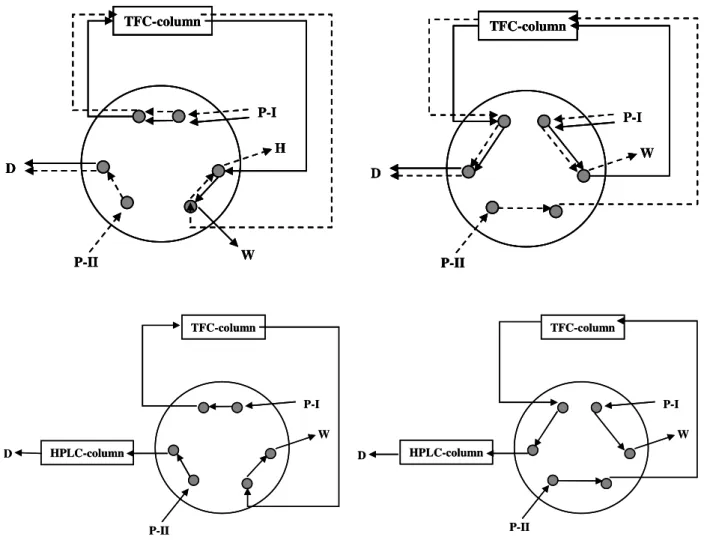
through a supported liquid membrane and then trapped in the acceptor solution (aqueous or organic) in the lumen of the hollow fiber (Figure 30.). After extraction, the acceptor solution can be injected directly into the equipment. When the acceptor solution is an organic solvent, HFME is called two-phase HFME (LLPME) sampling mode, which is directly compatible with GC. Alternatively, in three-phase sampling mode (LLLPME), the analytes are extracted into an organic layer, which fills the pores of the hollow fiber and is then back-extracted into an aqueous acceptor phase. Thus the acceptor solution is aqueous, which is compatible with HPLC or CE. The sample-to-acceptor ratio is very high, so analyte enrichments are also very high; consequently it is not necessary to carry out evaporation and reconstitution. The volume of the sample in LPME ranges between 50 µl and 1 l, whereas the volume of acceptor solution in most cases is in the range 2–30 µl. The volume of the extraction phase is typically 5–30 µl, resulting in an extremely low consumption of organic solvent per extraction which is beneficial from economical, health and environmental point of view.
Figure 30.: two- and three-phase HFME
This technique is a very efficient technique for sample clean-up, reducing or eliminating potential problems originated from matrix components. Especially the 3-phase mode is very efficient for the extraction from complex biological samples. Furthermore, LPME may easily be automated in commercially available industrial robot systems, providing a fully automated approach to sample preparation.