Heavy-particle induced secondary electrons in capacitive radio frequency discharges driven by tailored voltage waveforms
Cite as: J. Appl. Phys.126, 043303 (2019);doi: 10.1063/1.5100508
View Online Export Citation CrossMark
Submitted: 17 April 2019 · Accepted: 27 June 2019 · Published Online: 29 July 2019
A. Derzsi,1,2,a) B. Horváth,2 I. Korolov,3 Z. Donkó,2 and J. Schulze1,3 AFFILIATIONS
1Department of Physics, West Virginia University, Morgantown, West Virginia 26506, USA
2Institute for Solid State Physics and Optics, Wigner Research Centre for Physics, Hungarian Academy of Sciences, 1121 Budapest, Hungary
3Institute of Electrical Engineering and Plasma Technology, Ruhr-University Bochum, 44780 Bochum, Germany
a)derzsi.aranka@wigner.mta.hu
ABSTRACT
Particle-in-Cell/Monte Carlo Collision simulations are performed to investigate the effects of heavy-particle induced secondary electrons (SEs) on the ionization dynamics and on the control of ion properties at the electrodes in geometrically symmetric capacitively coupled argon discharges driven by tailored voltage waveforms. The driving voltage waveform is composed of a maximum of four (1!N!4) consecutive harmonics of the fundamental frequency of 13.56 MHz and is tailored by adjusting the identical phases of the even harmonics,θ. The simula- tions are carried out at neutral gas pressures of 3 Pa (nearly collisionless low-pressure regime) and 100 Pa (collisional high-pressure regime).
Different approaches are used in the simulations to describe the secondary electron emission (SEE) at the electrodes: we adopt (i) constant ion-induced secondary electron emission coefficients (SEECs),γ, and (ii) realistic, energy-dependent SE yields for ions and fast neutrals. The mean ion energy at the electrodes,hEii, can be controlled byθat both pressures, for both approaches adopted to describe the SEE in the sim- ulations. At a low pressure of 3 Pa, we obtain largely different dependencies of the ionflux at the electrodes,Γi, onθ, depending on the value of theγ-coefficient. Forγ¼0:2,Γiremains nearly constant as a function ofθ, independently of the choice ofN, i.e., the mean ion energy can be controlled separately from the ionflux by adjustingθ. However, for values ofγdifferent from 0.2, the quality of the separate control of the ion properties changes significantly. At a high pressure of 100 Pa, independently of the choice ofγ, for a givenN#2, the ionflux varies as a function ofθ. At both pressures, the surface conditions affect the plasma parameters and the quality of the separate control of ion properties at the electrodes. Adopting realistic, energy-dependent SE yields for heavy particles in the simulations can lead to significantly different results compared to those obtained by assuming constant SEECs.
Published under license by AIP Publishing.https://doi.org/10.1063/1.5100508
I. INTRODUCTION
Low-pressure capacitively coupled plasmas (CCPs) are basic tools in a variety of plasma processing applications.1–3In such appli- cations, which are based on the interactions of plasma particles with the boundary surfaces, the control of particle properties at the sur- faces is of key importance. The application of tailored voltage wave- forms (TVWs) to generate CCPs offers advanced control of various particleflux-energy distribution functions in technological plasmas.
Such waveforms have a nonsinusoidal shape and can be generated as a sum of sinusoidal signals with a fundamental frequency and a
number of its higher harmonics with defined phase shifts between them. The waveform shape can be changed by individually varying the harmonics’amplitudes and phases. This affects the sheath volt- ages at both electrodes and, therefore, the energy of ions arriving at the two electrodes. This type of excitation allows the ion energy to be tuned by the phase angles between the driving harmonics due to the varying dc self-bias that is caused by the electrically asymmetric excitation waveform, i.e., the electrical asymmetry effect (EAE).4–11
Particle-in-Cell simulations combined with Monte Carlo type treatment of the collision processes (PIC/MCC method)12–19 are
widely used to study the electron power absorption and ionization dynamics, the discharge characteristics, and the possibilities to control the particle flux-energy distribution functions relevant for plasma processing applications in low-pressure CCPs, including dis- charges excited by multiple driving frequencies. Such simulations usually adopt several assumptions related to the description of the interaction of plasma particles with the boundary surfaces. Surface coefficients, describing, e.g., the secondary electron emission (SEE), are required as input parameters, which are often unavailable in the literature for different combinations of the discharge gas and the electrode material (with different surface properties) under various discharge conditions. However, the assumptions made on the surface processes, implemented in PIC/MCC simulations of CCPs, have a strong effect on the calculated discharge characteristics.20–27
In previous simulation studies of CCPs, the ion-induced sec- ondary electron emission coefficient (SEEC),γ, was found to affect the electron power absorption and ionization dynamics, i.e., the dis- charge operation mode. Increasing the value of the γ-coefficient (which was assumed not to depend on the particle energies, surface properties, and the discharge conditions) was found to result in a transition of the discharge operation mode from theα-mode28–34to theγ-mode.28,35–40In the former case, ionization by electrons accel- erated by the expanding sheaths dominates, while in the latter case ionization due to secondary electrons (SEs) in the sheaths is the dominant source of ionization. The value of theγ-coefficient used in the simulations was found to largely influence the calculated dis- charge characteristics as well as the control of ion properties at the electrodes in dual-frequency CCPs.35,36,41–43Due to these effects, the importance of the realistic description of the SEE process in kinetic simulations of CCPs was already emphasized.20,26,44,45
In order to describe the SEE realistically in PIC/MCC studies of CCPs, the contributions of various plasma particles [ions, fast neu- trals, metastables, and vacuum ultraviolet (VUV) photons] to the SEE have to be described on the basis of the energy-dependent sec- ondary yields of all these different particles.46This approach allows to derive so-called“apparent”or“effective”γ* SEECs.47,48Alternatively, SEECs determinedin situby computationally assisted spectroscopic techniques50or SEECs obtained based on theoretical models of the SEE51can be used in the simulations of CCPs.
The effects of adopting realistic energy-dependent heavy- particle induced SEECs and taking into account the properties of the electrode surfaces on the control of ion properties at the elec- trodes have previously been studied by PIC/MCC simulations in
“classical” dual-frequency discharges (i.e., when two, significantly different driving frequencies are applied).44 Simulations in argon were performed by assuming“clean”and“dirty”metal electrodes46 in the model, and the effective SEECs,γ*, corresponding to these surface conditions were calculated self-consistently.44It was found thatγ* changes significantly by changing the control parameter for the mean ion energy (the low-frequency voltage amplitude), which negatively influences the quality of the separate control of ion prop- erties at the electrodes. The effects of describing the SEE realisti- cally in PIC/MCC simulations of multifrequency CCPs driven by TVWs on the discharge characteristics have not been investigated so far. In previous studies, (different) constant values for the ion- induced SEEC, γ, were assumed in electrically asymmetric dual- frequency discharges36and multifrequency discharges.51
Here, PIC/MCC simulations are performed at argon gas pres- sures of 3 Pa (nearly collisionless low-pressure regime) with a total driving voltage amplitude offtot¼800 V and at 100 Pa (col- lisional high-pressure regime) with ftot¼120 V. At both pres- sures, a maximum number of four consecutive harmonics are used to excite the discharge. The phases of the even harmonics are varied from 0$to 180$, while the phases of the odd harmonics are set to 0$. These conditions are the same as those covered in our previous study in Ref.51. However, in Ref. 51, only constant ion- induced SEECs were used in the simulations (γ¼0:2 at 3 Pa and γ¼0:4 at 100 Pa). Here, at both pressures, different (constant) values ofγbetween 0.0 and 0.4 are used, and effective heavy-particle induced SEECs,γ*, are calculated self-consistently for “dirty” and
“clean” surface conditions. This way, a more complete picture on the effects of SEs on the discharge characteristics and on the quality of the separate control of the ion properties at the elec- trodes in multifrequency discharges driven by TVWs is obtained, and the conclusions drawn in Ref.51are amended.
The paper is structured in the following way: in Sec. II, we describe the discharge model used in the PIC/MCC simulations and introduce the studied discharge conditions. The simulation results are presented and discussed in Sec.III. The conclusions are drawn in Sec.IV.
II. SIMULATION METHOD AND DISCHARGE CONDITIONS
The simulations are based on our one-dimensional in space and three-dimensional in velocity space (1d3v) bounded plasma Particle-in-Cell code complemented with Monte Carlo treatment of collision processes (PIC/MCC).18,19The PIC method is widely used for the kinetic description of CCPs. In the frame of this method,“superparticles”(which represent a large number of real plasma particles) are traced and their interactions are considered via a computational mesh. This way the number of particles traced in the simulations can be reduced to a tractable order of magni- tude and the immense computational efforts required by the description of their pairwise interactions can be avoided. In the simulations, the particle trajectories (between collisions) are deter- mined based on the solution of the equation of motion and the col- lisions are described in a stochastic manner (i.e., by the Monte Carlo approach that is based on random numbers which have specific probability distributions according to physical principles).
In the present study, the discharge gas is argon. The particles included in the discharge model are electrons, Arþ ions, and fast Ar neutrals (Arf, created in charge exchange collisions between Arþ ions and atoms of the background gas, with kinetic energy above the threshold value of 23 eV—this energy value is close to the threshold energy for the excitation of Ar atoms by fast neu- trals). The ions are traced in the discharge gap until they arrive at the electrodes. The tracing of electrons is executed in a similar way as for ions, except that these particles can be reflected from the sur- faces. The fast neutrals are traced until their energy drops below the threshold energy value of 23 eV or until they reach one of the electrodes. The cross sections for the elementary collision processes included in the model are taken from Refs. 52–54. A detailed description of the model can be found in Ref.20.
The electrode gap is L¼3 cm for all conditions investigated here and we consider geometrically symmetric discharges with plane, parallel, and infinite electrodes. One of the electrodes is grounded, while the other one is driven by the following multifre- quency voltage waveform, composed ofN harmonics of the fun- damental frequency,f¼13:56 MHz:
f(t)¼XN
k¼1
fkcos(2πkftþθk), (1)
with
ftot¼XN
k¼1
fk: (2)
In the above equations, fk is the amplitude and θk is the fixed, but adjustable phase shift of the k-th individual harmonic
(k¼1,. . .,N), andftotis the total applied voltage amplitude. The
amplitudes of the individual harmonics are set in a way to maxi- mize the electrical generation of the dc self-bias,55
fk¼f0N&kþ1
N , (3)
where
f0¼ 2ftot
Nþ1: (4)
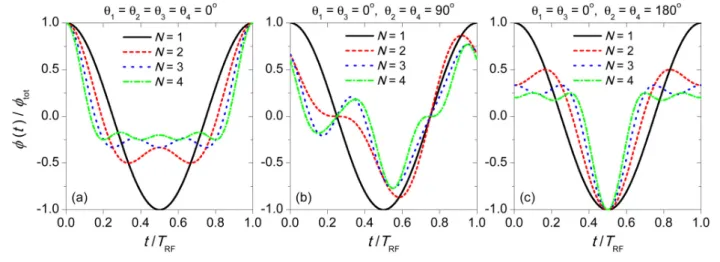
So-called“peaks”-type voltage waveforms can be generated by setting allθk phase angles to zero in Eq. (1), while“valleys”- type waveforms can be obtained by changing the phase angles of all the even harmonics to 180$. InFig. 1, examples of the normal- ized driving voltage waveform, f(t)=ftot, are shown for specific values ofNandθk.
In PIC/MCC simulations of CCPs, the interactions of various plasma particles with the boundary surfaces have to be described. This can be done by adopting simple approaches (by defining constant surface coefficients for the different surface processes as input parameters to the simulation) or by realistic approaches (where the surface properties as well as the depen- dence of the surface processes on the energy of the particles are taken into account). Here, we assume that the electrodes are made of the same (metal) material with identical surface conditions.
The electron reflection probability is set to 0.2 for all conditions (simple approach),56 independently of the electrons’ energy and their angle of incidence. Other types of electron-surface processes, e.g., the emission of SEs due to electron impact, are neglected. We note that recent studies have found considerable effects of the elec- tron induced SEs on the plasma parameters at specific discharge conditions57,58, i.e., at very low pressures (p' 3 Pa) and high voltage amplitudes, for dielectric surfaces. However, in the present study, metal electrodes are assumed (compared to dielectric sur- faces, the maximum of the electron induced SE yield is much lower for metal surfaces), and the discharge conditions covered here are significantly different (higher pressures, lowerftot) com- pared to those in Refs.57and58.
SEE induced by heavy particles (Arþions and Arf neutrals) is taken into account in the simulations. Both simple and realistic approaches are used to describe the SEE processes induced by these particles at the electrodes: (i) constant ion-induced SEECs,γ, taking values between 0.0 and 0.4 are used (simple approach) and (ii) the SE yield of the individual Arþions and Arf neutrals hitting the elec- trodes,γi and γa, respectively, are considered as a function of the incident particle energy (realistic approach). For argon ions and neu- trals,γi andγa are given in Refs.46and 59for“dirty”metal elec- trodes as well as “clean” surface conditions. “Clean” electrodes represent atomically clean surface conditions (e.g., sputtered surfaces in the high vacuum environment), while“dirty”electrodes represent surfaces under typical laboratory conditions (treated by the standard
FIG. 1. Normalized driving voltage waveforms for exemplary choices ofNandθk, shown for one period of the fundamental frequency (TRF¼1=f).
chemical and mechanical cleaning procedures, contaminated or oxi- dized samples).46Here, simulations are run by assuming both“dirty”
and“clean”surface conditions.
For“dirty”electrodes, the following formulas, given in Ref.46 and corrected in Ref. 59, are used to compute the SE yield of the individual ions (γi) and fast neutrals (γa) hitting the electrodes as a function of their energy,ϵ(given in electron volt),
γi(ϵ)¼ 0:006ϵ
1þ(ϵ=10)þ1:05(10&4(ϵ&80)1:2
1þ(ϵ=8000)1:5 , (5) γa(ϵ)¼1(10&4(ϵ&90)1:2
1þ(ϵ=8000)1:5 þ7(10&5(ϵ&32)1:2 1þ(ϵ=2800)1:5 : (6) To calculateγiandγafor“clean”surfaces, the formulas given in Ref.46are used,
γi(ϵ)¼0:07þ1(10&5(ϵ&500)1:2=[1þ(ϵ=70000)0:7], (7) γa(ϵ)¼1(10&5(ϵ&500)1:2=[1þ(ϵ=70000)0:7]: (8) Based on the energy-dependent SE yields of the individual heavy particles, calculated according to the above formulas (shown also in Fig. 2 as a function of the incident particle energy for different surface conditions), the effective SEEC, γ*, can be com- puted as proposed in Refs.47and48,
γ*¼ XNi
k¼1
γi(ϵk)þXNa
k¼1
γa(ϵk)
Ni , (9)
whereϵkis the energy of thek-th ion or atom traced in the simula- tion (upon arrival at the electrode) andNiandNa are respectively, the total number of Arþ ions and Arf atoms reaching a given electrode during a RF period. Under the conditions investigated here, mainly these plasma species contribute to SEE; therefore, the contributions of other plasma species are neglected in Eq.(9).
In the simulations performed for “dirty” surface conditions, Eqs.(5),(6), and(9)are used to calculate the effective SEEC,γ*d. In the simulations performed for “clean” surface conditions, the effective SEEC,γ*c, is obtained based on Eqs.(7)–(9).
The simulations are performed at neutral gas pressures of 3 Pa (nearly collisionless low-pressure regime) withftot¼800 V and at 100 Pa (collisional high-pressure regime) withftot¼120 V. For these values of the total voltage amplitudes, convergence of the simulations could be reached for all values of N, θ, and even for the highest values ofγassumed in the simulations. A maximum number of four consecutive harmonics are used at both pressures, to excite the dis- charge (1!N!4). The phases of the even harmonics (θ2¼θ4¼θ) are varied from 0$to 180$, while the phases of the odd harmonics are kept constant at 0$(θ1¼θ3¼0$).
In the simulations, the background gas density and the gas temperature are constant in space and time. The energy transfer to the background gas atoms, i.e., the heating of the discharge gas, is not calculated directly in the simulations. However, at the studied discharge conditions, the gas temperature is expected to be signifi- cantly higher than the room temperature, especially at high total voltage amplitudes. Therefore, a constant neutral gas temperature of 400 K is assumed in the present study.
In the simulations where constantγcoefficients are used, the traced particles are electrons and Arþ ions, while in the simula- tions where the SE yields are calculated realistically fast neutrals (Arf) are also traced.
III. RESULTS
A. Low-pressure regime (3 Pa)
In this section, PIC/MCC simulation results obtained for 3 Pa and ftot¼800 V are presented. Firstly, results obtained by using constant values for the SEEC,γ, are discussed.γ¼0.0, 0.2, and 0.3 are set in the simulations for N¼ 1, 2, and 4. γ¼0:3 was the highest possible value for which convergence of the simulations could be achieved in the whole 0$–180$domain ofθunder the dis- charge conditions studied here. Secondly, the discharge characteristics resulting from simulations with energy-dependent heavy-particle induced SEECs for “dirty” and “clean” surface conditions are presented.
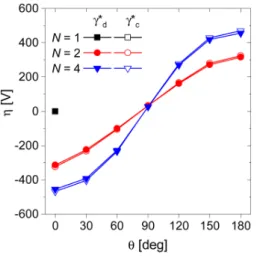
1. Constant heavy-particle induced SEECs,γ, at 3 Pa InFig. 3, the dc self-bias voltage,η, is shown as a function of the identical phase angle of the even harmonics,θ¼θ2¼θ4, for different numbers of applied harmonics,N, and different (constant) values of theγ-coefficient (γ¼0.0, 0.2, 0.3). By changingθ, the dc self-bias voltage can be tuned efficiently, while adding more consec- utive harmonics to the driving voltage waveform, i.e., increasingN, enlarges the interval over whichηcan be controlled. AtN¼2,j jη reaches a maximum value of about 330 V (j jη=ftot¼41%), while at FIG. 2. Secondary electron yields on“dirty”(dashed lines) and“clean”(solid
lines) metal surfaces due to Arþions and fast Ar neutrals (Arf) as a function of the incident particle energy. The secondary electron yields are calculated based on formulas from Refs.46and59.
N¼4 the dc self-bias voltage can be tuned from about&475 V to 475 V (j jη=ftot¼59%) by changingθfrom 0$to 180$. Almost the same values of η (max. 5% difference) as a function of θ are obtained for all three different values ofγ, i.e., the choice ofγdoes not affect significantly the dc self-bias voltage.
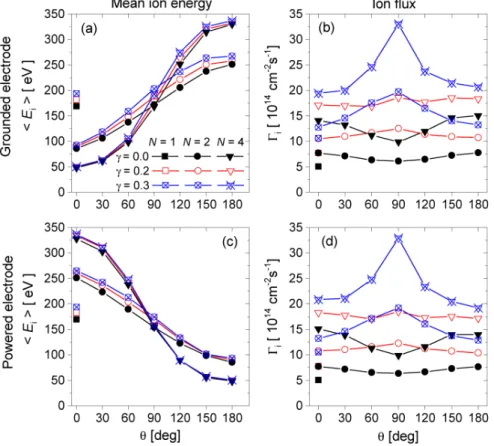
By changingηvia the phase angles, the mean ion energy at the electrodes can be controlled. This can be seen in panels (a) and (c) of Fig. 4, where the mean ion energies, hEii, at the grounded and powered electrodes are shown as a function of θ for different numbers of applied harmonics and different values ofγ.hEiican be increased by a factor of about 7 atN¼4 at the grounded electrode (from about 50 eV up to about 330 eV) and decreased at the powered electrode by changing θfrom 0$ to 180$. The mean ion energies at both electrodes are slightly affected by the value of the γ-coefficient assumed in the simulations. At a givenN andθ, the lowest mean ion energies are obtained for γ¼0:0. Compared to these results, by usingγ¼0:3 in the simulations, an increase of the mean ion energy by a maximum of 18% can be observed, at a given N andθ. This can be explained by the effects of SEs on the ioniza- tion dynamics, the plasma density, and the sheath length. At higher values of γ, more SEs are emitted from the electrodes, which are accelerated in the sheaths and induce significant ionization. This leads to an increase of the plasma density and a decrease of the sheath lengths at both electrodes (see the effects ofγon the ioniza- tion dynamics and the length of the sheaths forN¼4 and different phase angles inFig. 5). The narrow and weakly collisional sheaths under low-pressure conditions causehEiito slightly increase at both electrodes by increasingγ.
In our previous study performed at the same discharge condi- tions (3 Pa pressure, 3 cm electrode gap, and total voltage amplitude offtot¼800 V) withγ¼0:2, we found that the mean ion energy can be controlled separately from the ionflux by adjusting θ:51 it
was demonstrated that the ionflux,Γi, remains essentially constant as a function ofθ, independently of the choice ofN, at both elec- trodes, while the mean ion energy can be controlled byθ. This can also be seen inFig. 4[the ionfluxes at the grounded and powered electrodes are shown in panels (b) and (d), respectively], where the results obtained forγ¼0:2 are shown as open symbols. Compared to these results, for values ofγ different from 0.2 the quality of the separate control of the ion properties changes significantly.
Forγ¼0:0 (filled symbols),Γi first decreases, then increases by changingθfrom 0$ to 180$. The lowest ion fluxes are found at θ¼90$, for allN#2. AtN¼2,Γidecreases by a maximum of 22%, while atN¼4 a decrease by a maximum of 35% is found by tuningθfrom 0$to 90$. Under such conditions, the separate control ofhEiiandΓicannot be realized. Similarly, by assuming a high SE yield of γ¼0:3 in the simulations (results shown with open crossed symbols inFig. 4),Γidoes not remain constant as a function of θ. However, as opposed to the results for γ¼0:0, here the highest ion fluxes are obtained at θ¼90$, i.e., for all N#2, Γi first increases, then decreases by changing θ from 0$to 180$. AtN¼2,Γiincreases by a maximum of 55%, while at N¼4 an increase by a maximum of 70% is obtained as θ is increased from 0$to 90$.
These results show that the quality of the separate control of the ion properties at the electrodes is largely influenced by the emis- sion of SEs in low-pressure discharges excited by multifrequency TVWs. Depending on the value ofγ assumed in the simulations, largely different dependencies ofΓion the control parameter for the mean ion energy,θ, are obtained. While at γ¼0:2 the separate control of ion properties seems to be achievable, using lower/higher values forγin the simulations results in varying ionfluxes as a func- tion ofθ, i.e., both Γi andhEii change by tuningθ. The decrease/
increase ofΓi by tuning θfrom 0$to 90$ at low/high values ofγ (0.0 and 0.3, respectively) is much stronger atN¼4 compared to N¼2. The quality of the separate control of ion properties is more affected (reduced) by SEs at higher numbers of applied harmonics.
Strong effects of SEs on the quality of the control of ion properties at the electrodes have previously been demonstrated in classical dual- frequency discharges,35,44as well as in electrically asymmetric dual- frequency discharges36at somewhat different discharge conditions.
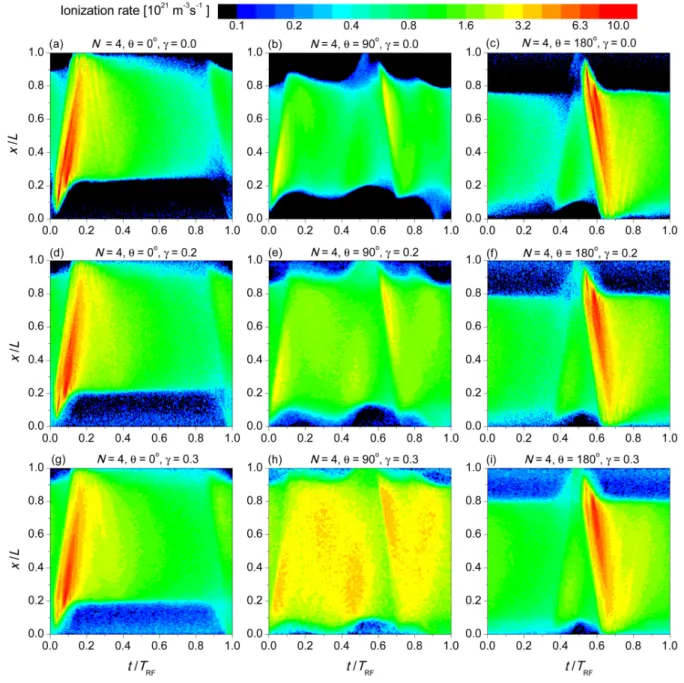
The influence of SEs on the discharge characteristics, especially the different dependence of theΓi ionflux onθat different values of γ, can be understood based on an analysis of the ionization dynamics.Figure 5shows the spatio-temporal plots of the ionization rate for N¼4 applied harmonics, for different phase angles (θ¼0$, 90$, and 180$), and for different values of theγ-coefficient (γ¼0.0, 0.2, and 0.3). In all cases, the discharge operates in the α-mode, tuning θ or varying γ does not change the dominant power absorption mode in the discharge. However, the symmetry of the ionization dynamics is influenced by the phase angle,θ, and this affects the ionization induced by SEs. At θ¼0$/θ¼180$, strong α-mode ionization, enhanced by nonlinear electron resonance heating (NERH),60–64 is found at the powered/grounded electrode, respectively, for allγ. Atθ¼90$, the spatio-temporal ionization is symmetric, without NERH. At γ¼0:0 (top row in Fig. 5), the ionization maxima at θ¼90$ are significantly weaker than those obtained forθ¼0$and θ¼180$, and less ionization is produced on time and space average at this phase angle compared toθ¼0$ FIG. 3. Dependence of the dc self-bias voltage, η, on the identical phase
angles of the even harmonics, θ¼θ2¼θ4 (θ1¼θ3¼0$), for different numbers of applied harmonics,N, and different values of theγ-coefficient (γ¼0.0, 0.2, 0.3). Discharge conditions:p¼3 Pa,ftot¼800 V. Note that the symbols completely overlap in some cases, e.g., atN¼1.
and 180$. This is caused by the slower sheath expansion velocity at 90$. As a consequence of this, the ionflux reaches its minimum at θ¼90$, where it is about 35% lower than those at 0$ and 180$ [Figs. 4(b)and4(d),Γishown with solid triangles forN¼4].
Atγ¼0:2 (center row in Fig. 5), the SEs emitted from the electrodes and accelerated in the sheath induce ionization, which enhances the plasma density and leads to an increase of the ionflux at both electrodes, at allθ. Compared to the ionfluxes obtained for γ¼0:0, by assumingγ¼0:2 in the simulations,Γi increases by a factor of about 1.2 atθ¼0$andθ¼180$. However, at these phase angles, poor confinement of SEs is found. The SEs created at the powered/grounded electrode at θ¼180$=0$ during the time of sheath expansion at a given electrode are mainly lost at the other (grounded/powered) electrode where the sheath is collapsed for a long fraction of one period of the fundamental frequency,TRF. For values of θaround 90$, good confinement of SEs is found due to the high sheath voltages at both electrodes during a long fraction of TRF. This leads to an increase of the ionflux at both electrodes. At θ¼90$, the ionflux is about 1.8 times higher than that atγ¼0:0.
At values ofθaround 90$, the ionization induced by SEs compen- sates the weaker α-mode ionization, resulting in ionfluxes similar to those obtained atθ¼0$and 180$, where the strongα-mode ion- ization is further enhanced by NERH. Under these conditions, on time and space average, the ionization rates are similar, indepen- dently of θ; therefore, the ion fluxes remain nearly constant as a function ofθat both electrodes.
Compared to theγ¼0:2 case, more SEs are emitted from the electrodes atγ¼0:3, which further enhance the ionization in the discharge (bottom row inFig. 5). Atθ¼0$and 180$, this effect results in an additional increase of the ionfluxes by about 15%.
This moderate increase of the ionfluxes, besides the poor confine- ment of SEs at these phase angles, is also related to the longer mean free paths and the less efficient multiplication of SEs at low- pressure conditions. However, atθ¼90$, the high number of SEs as a result of the highγin combination with the good confinement of SEs results in highly efficient multiplication of SEs in the bulk region (due to their multiple reflections between the sheaths) [Fig. 5(h)] despite the low pressure of 3 Pa of the discharge gas. As a result, the ionflux increases by about 80% atθ¼90$compared toΓiobtained forγ¼0:2 at the same phase angle.
The effects of heavy-particle induced SEs on the quality of the separate control of the ion properties at the electrodes (via the control parameter,θ) seen here for TVWs are similar to the scenario found previously in classical dual-frequency discharges driven by two significantly different frequencies.35,36In classical dual-frequency discharges (where the control parameter of the mean ion energy is the low-frequency voltage amplitude, while the ionflux is tuned by the high-frequency voltage amplitude), the separate control of the ion properties at the electrodes can be realized only for specific choices ofγ. Low values ofγcause a decrease ofΓi and high values ofγcause an increase ofΓias a function of the control parameter of the mean ion energy, i.e., the low-frequency voltage amplitude.
FIG. 4. Mean ion energy (panels on the left),hEii, and ionflux (panels on the right), Γi, at the grounded and powered electrodes (top and bottom panels, respectively) as a function of θ¼θ2¼θ4 (θ1¼θ3¼0$) for dif- ferent numbers of applied harmonics,N, and different values of theγ-coefficient (γ¼0:0, 0.2, 0.3). Discharge condi- tions:p¼3 Pa,ftot¼800 V. Note that the symbols completely overlap in some cases.
2. Realistic heavy-particle induced SEECs,γ*, at 3 Pa In the following, the results of simulations in which the SE yields, as a result of heavy particle bombardment of the electrodes, were calculated as a function of the particle energy, are presented.
The discharge conditions are the same as above (3 cm electrode
gap, 3 Pa, andftot¼800 V). Both“dirty”and“clean”surface con- ditions are covered in this study. The effective SEECs for these surface conditions,γ*dandγ*c, are calculated as described in Sec.II.
Figure 6shows the dc self-bias voltage,η, as a function of the identical phase angles of the even harmonics, θ¼θ2¼θ4, for different numbers of applied harmonics,N, for“dirty”and“clean”
FIG. 5. Spatio-temporal plots of the ionization rate forN¼4 applied harmonics, for different phase angles:θ¼0$(left column),θ¼90$(center column), andθ¼180$ (right column), and for different values of theγ-coefficient:γ¼0:0 (top row),γ¼0:2 (center row), andγ¼0:3 (bottom row). The powered electrode is atx=L¼0, while the grounded electrode is atx=L¼1.TRFindicates one period of the fundamental frequency. Discharge conditions:L¼3 cm,p¼3 Pa,ftot¼800 V,θ¼θ2¼θ4, θ1¼θ3¼0$. The color scale is logarithmic.
surface conditions. Similar to the results shown in Fig. 3 for constant ion-induced SEECs, by changing θ the dc self-bias voltage can be tuned efficiently. There is no significant difference between the results obtained for“dirty”and“clean”surfaces (the surface conditions do not affect significantly the dc self-bias voltage under these conditions, the differences are always below 3%
at a givenN andθ), and thej jη values at bothN¼2 andN¼4 are close to those obtained by assuming constant γ-coefficients (Fig. 6compared toFig. 3): atN¼2,ηcan be tuned within about +315 V, while atN¼4 it can be changed within about+455 V by tuningθfrom 0$to 180$.
Figure 7shows the mean ion energy,hEii, and the ionflux,Γi, at the grounded and powered electrodes as a function ofθ¼θ2¼θ4
for different N, for “dirty” (filled symbols) and “clean” (open symbols) surface conditions. By changingθ, the mean ion energy at the electrodes can be controlled [panels (a) and (c)], similar to the results of simulations with constantγ-coefficients. For both surface conditions, hEii can be increased/decreased by a factor of about 2.5 atN¼2 and by a factor of about 7 atN¼4 at the grounded/
powered electrode by changingθfrom 0$to 180$. While the mean ion energies are almost the same for both“dirty”and“clean”surface conditions at a given N and θ, the ion fluxes are affected by the surface conditions at both electrodes, as it can be seen in panels (b) FIG. 6. Dependence of the dc self-bias voltage,η, on the identical phase angle
of the even harmonics,θ¼θ2¼θ4(θ1¼θ3¼0$), for different numbers of applied harmonics,N, obtained from simulations where the effective SEECs for
“dirty”(filled symbols) and“clean”(open symbols) surface conditions,γ)dand γ)c, respectively, are calculated self-consistently. Discharge conditions: p¼3 Pa,ftot¼800 V. Note that the symbols completely overlap in some cases.
FIG. 7. Mean ion energy (panels on the left),hEii, and ionflux (panels on the right), Γi, at the grounded and powered electrodes (top and bottom panels, respectively) as a function of θ¼θ2¼θ4 (θ1¼θ3¼0$) for dif- ferent numbers of applied harmonics, N, obtained from simulations with self- consistently calculated effective SEECs, γ)d andγ)c, for “dirty”(filled symbols)
and “clean” (open symbols) surface
conditions, respectively. Discharge con- ditions: p¼3 Pa, ftot¼800 V. Note that the symbols completely overlap in some cases.
and (d) ofFig. 7. For“dirty”surfaces, higher (up to 10%) ionfluxes are obtained at allθandN, and the difference between thefluxes at different surface conditions slightly increases with increasing number of applied harmonics.
AtN¼2, Γi changes by up to 12% by tuningθfrom 0$to 180$ for both “dirty” and “clean” surfaces, with the lowest ion fluxes obtained atθ¼90$. AtN¼4, the ionflux changes by up to about 45% for“dirty” surfaces and up to about 37% for “clean”
surfaces, by changingθfrom 0$to 180$. These simulations show that by describing the SEE realistically in the simulations via a self- consistent calculation of the SEECs,γ*dandγ*c, a different depen- dence ofΓi onθis obtained compared to those obtained for cons- tantγ-coefficients [seeFigs. 7(b)and7(d)compared toFigs. 4(b) and4(d)]. Here, at both surface conditions,Γi exhibits maxima at θ¼0$and 180$, and a minimum value atθ¼90$, independently ofN. This behavior of the ionflux as a function ofθcan be under- stood based on the analysis of the self-consistently calculated effective SEECs shown in Fig. 8, the flux-energy distributions of ions and fast neutrals at the electrodes (Fig. 9), and the spatio- temporal ionization dynamics (Fig. 10).
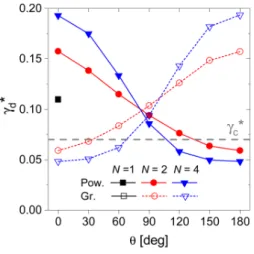
For“dirty” surface conditions the self-consistently calculated effective SEEC,γ*d, changes as a function ofθ at both electrodes (Fig. 8). By tuningθfrom 0$to 180$,γ*dincreases at the grounded electrode (from about 0.06 to about 0.16 atN¼2, and from about FIG. 8. Self-consistently calculated effective SEEC for“dirty”surface conditions,
γ)d, at the powered and grounded electrodes (filled and open symbols, respec- tively) as a function ofθ¼θ2¼θ4(θ1¼θ3¼0$) for different numbers of applied harmonics,N. The dashed line shows the value of the effective SEEC for“clean”surface conditions,γ)c, which is 0.07 for allθandNat both elec- trodes. Discharge conditions:p¼3 Pa, ftot¼800 V. Note that the symbols completely overlap atN¼1.
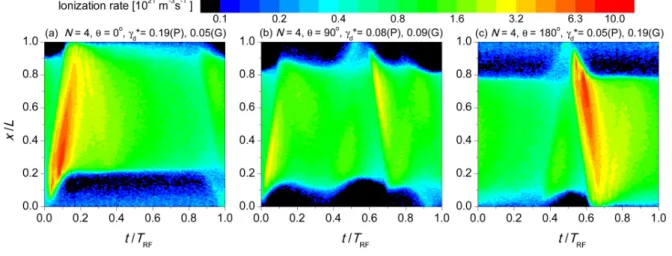
FIG. 9. Flux-energy distributions of ions (left panels) and fast atoms (right panels) at the powered electrode (solid lines, left axes) and the SE flux induced by these particles (dashed lines, right axes) as a function of the ion/atom energy for “dirty” metal sur- faces, for N¼4 harmonics, θ¼0$ (top panels) and θ¼90$ (bottom panels). γ)d¼0:19 at θ¼0$, and γ)d¼0:08 at θ¼90$. The dashed vertical lines in panels (b) and (d) indi- cate the threshold energy (23 eV) for fast neutrals. Discharge conditions:
p¼3 Pa,ftot¼800 V,θ¼θ2¼θ4, θ1¼θ3¼0$.
0.05 to about 0.2 atN¼4) and decreases at the powered electrode.
The γ*d values found at the powered and grounded electrodes at θ¼0$are reversed atθ¼180$.
The variation of the effectiveγ*dwithθis a result of the var- iation of the heavy-particle energies, and, consequently, the vari- ation of the energy-dependent SE yields as a function ofθdue to these particles (see Fig. 2). This is illustrated in Fig. 9, which shows theflux-energy distributions of ions and fast atoms at the powered electrode and the SE flux induced by these particles from “dirty” surfaces as a function of the ion/atom energy for N¼4 harmonics, at θ¼0$ and θ¼90$. The relatively high value of γ*d¼0:19 at the powered electrode obtained for N¼4 atθ¼0$ (Fig. 8) is the result of the high SE yield due to ions hitting the electrode at high energies [Fig. 9(a)], aided by the contribution of energetic neutrals to the SEE [Fig. 9(b)]. At the grounded electrode, the heavy-particle energies are significantly lower [the mean ion energy is about 50 eV at the grounded elec- trode compared to 325 eV at the powered electrode, as it can be seen in Figs. 7(a) and 7(c)]. These particles induce less SEs at the grounded electrode, which explains the lower value of γ*d¼ 0:048 at the grounded electrode side.
Compared toθ¼0$, the ions and fast neutrals reach the elec- trodes at lower energies at θ¼90$ [the particle energies are below 250 eV, see the flux-energy distributions at the powered electrode in Figs. 9(c)and9(d)]. This leads to lower SE yields based on formulas (5)and(6)for the individual heavy particles hitting the electrodes and to effectiveγ*dwith values of 0.08–0.09 at both electrodes.
For“clean”surface conditions, the self-consistently calculated effective SEEC,γ*c, is 0.07 (marked as a dashed line inFig. 8) for all N andθat both electrodes. This can be explained by the energy distributions of ions and atoms bombarding the electrodes and the corresponding SE yields of these particles on “clean” surfaces.
Under the conditions investigated here, the ions and atoms reach
the electrodes with energies below 600 eV. At such energies, the SE yield is 0.07 for ions (Fig. 2), while even lower yields are obtained for fast neutrals based on formulas(7)and(8).
Figure 10shows the spatio-temporal plots of the ionization rate forN¼4, for different phase angles,θ¼0$, 90$, and 180$, obtained by assuming“dirty” surface conditions in the simula- tions and calculating the effective SEEC, γ*d, self-consistently.
Atθ¼0$,γ*dis high at the powered electrode (γ*d¼0:19), while it is low at the grounded electrode (γ*d¼0:05), see Fig. 8.
Atθ¼180$, the role of the electrodes is reversed, i.e.,γ*dis low at the powered electrode while it is high at the grounded elec- trode side. Atθ¼90$, similar values ofγ*dare obtained for both electrodes,γ*dis 0.08 and 0.09 at the powered and grounded elec- trodes, respectively. At all phase angles, the discharge operates in theα-mode. Similar to the ionization dynamics found by assum- ing constant γ-coefficients in the simulations (Fig. 5), at θ¼0$ and 180$strong ionization at the expanding sheath edge, further enhancement by NERH is found. TheΓi ionfluxes at these phase angles (Fig. 7) as well as the spatio-temporal distributions of the ionization rates [Figs. 10(a) and 10(c)], are similar to those obtained by assuming a constantγ¼0:2 (at both electrodes) in the simulations (see for comparisonFigs. 4and5). Atθ¼0$/θ¼180$, the sheath is collapsed for a long fraction of the period of the funda- mental frequency (TRF) at the grounded/powered electrode; there- fore, the SEs emitted at this electrode are accelerated by the sheath electricfield only during a short fraction ofTRF and they cannot affect significantly the ionization dynamics and the plasma density.
On the other hand, the sheath is expanded for a long fraction of TRF at the opposing (powered/grounded) electrode, and the SEs emitted there contribute to the ionization; however, they also have only a limited effect on the plasma density and the ionflux at the electrodes due to the low gas pressure and their poor confinement under such conditions.
FIG. 10. Spatio-temporal plots of the ionization rate forN¼4 harmonics, for different phase angles:θ¼0$(a),θ¼90$(b), andθ¼180$(c), obtained by assuming
“dirty”surface conditions in the simulations and calculating the effective SEEC,γ)d, self-consistently. The values ofγ)dat the powered (P) and grounded (G) electrodes are shown in each panel’s title. The powered electrode is atx=L¼0, while the grounded electrode is atx=L¼1.TRFindicates one period of the fundamental frequency.
Discharge conditions:L¼3 cm,p¼3 Pa,ftot¼800 V,θ¼θ2¼θ4,θ1¼θ3¼0$. The color scale is logarithmic.
At θ¼90$, the self-consistently calculated values of γ*d are much lower than 0.2 (0.08 and 0.09 at the powered and grounded electrode, respectively). The confinement of SEs is guaranteed due to the specific waveform shape at N¼4. However, under these conditions, less SEs are emitted (indicated by the low values ofγ*d) and the ionization is less efficient in the bulk region [see the ioniza- tion dynamics in Fig. 10(b) compared to Fig. 5(e)], leading to a lower plasma density and ionflux than those obtained by assuming γ¼0:2 in the simulations. While in the latter case a nearly cons- tantflux of ions at the electrodes is found as a function ofθ(and the mean ion energy can be tuned byθ, i.e., the separate control of ion properties is possible), this is not the case when the SEE is described realistically in the simulations and the SEEC for dirty surface conditions,γ*d, is calculated self-consistently in the simula- tions. (The same can be stated for clean surfaces too.)
The results presented in this section confirmed that the surface conditions affect significantly the quality of the separate control of ion properties at the electrodes in low-pressure dis- charges driven by TVWs. Important differences from the results obtained by assuming constant values for the ion-induced SEEC,γ, are found by taking into account the surface conditions and the energy dependence of the SE yield due to heavy-particle impact in the simulations. For specific values ofγ, the simulations predict a good quality of the separate control of ion properties at the elec- trodes by tuning the control parameter for the mean ion energy,θ, while the simulations which operate with energy-dependent SE yields for heavy particles show that the separate control of the ion properties is not possible under the conditions studied here.
B. High-pressure regime (100 Pa)
In this section, the results obtained for 100 Pa andftot¼120 V are presented. Similar to Sec. III Aon low pressures (3 Pa), results obtained by using constant values for the ion-induced SEEC,γ, are presentedfirst, followed by results based on simulations with a self- consistent calculation of the effective SEECs, γ*dand γ*c, for“dirty”
and“clean”surfaces.
1. Constant heavy-particle induced SEECs,γ, at 100 Pa Figure 11shows the dc self-bias voltage, η, as a function of θ, forN¼1, 2, and 4 harmonics, assumingγ¼0.0, 0.2, and 0.4 as ion-induced SE yield.ηcan be tuned efficiently by changing θ, and increasing N enlarges its control interval. This is similar to the scenario seen at the low pressure of 3 Pa (Fig. 3). However, at 3 Pa almost the same values of η were obtained for the different values of γ at a given θ (max. 5%
difference). Here, the choice of γ affects significantly the dc self-bias voltage. AtN¼2, forγ¼0:0,j jη reaches a maximum value of about 30 V, while at γ¼0:4 the maximum of j jη is about 20 V (a decrease ofj jη by about 33%). (This corresponds to a decrease of the relative amplitude of the dc self-bias,η=ftot from 25% to about 17%.) AtN¼4, the dc self-bias voltage can be tuned from about &40Vto 40 V atγ¼0:0 and from&30V to 30 V at γ¼0:4 by changing θ from 0$ to 180$, i.e., j jη decreases by about 25% (η=ftot decreases from 33% to 25%).
These trends can be explained based on the ionization dynamics and operation of the discharge in the hybrid α-γ mode or
γ-mode at high values of γ instead of the pure α-mode at γ¼0:0, see later in this section.
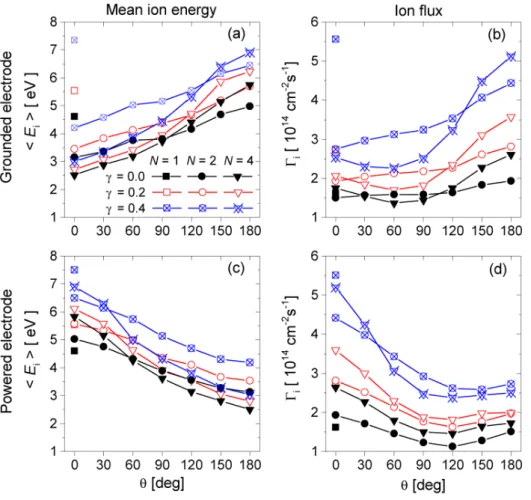
Figure 12shows the mean ion energy [panels (a) and (c)] and the ionfluxes [panels (b) and (d)] at the grounded and powered elec- trodes for different numbers of applied harmonics and different values of theγ-coefficient. For a givenN#2 andγ,hEiican be con- trolled efficiently by tuningθ. AtN¼2,hEiican be changed by a factor of about 1.6 at both electrodes by changingθ, while by adding more harmonics to the driving voltage waveform the control range is slightly enhanced, and at N¼4 a change of hEii by a factor of maximum 2.3 can be achieved [Figs. 12(a)and12(c)]. Independently of the choice ofγ, for a givenN#2, the ionflux does not remain constant as a function ofθunder these conditions:Γi decreases at the powered electrode [Fig. 12(d)], while it increases at the grounded electrode [Fig. 12(b)]. For a givenθ and N, higher ion fluxes are obtained for higher values ofγ. However, the choice ofγ does not change the quality of the separate control of ion properties,Γi and hEii are coupled at such high pressures for allγ. This is different compared to the results obtained for 3 Pa (Fig. 4), where for specific choices of γ, hEii can be tuned by θ independently of Γi, and changes of theγ-coefficient affect this control significantly. A detailed analysis of the ionization dynamics for the same discharge conditions, for γ¼0:4. was performed previously in Ref. 51—that study has pointed out that these differences are caused by the different electron power absorption and ionization modes present at 3 Pa and at 100 Pa.
In theα-mode operation at 3 Pa, the ionization dynamics is non- local (Fig. 5), while at 100 Pa, whereγ-mode operation develops, the ionization is localized at the sheath edges (seeFig. 13) and both the ionflux and the mean ion energy depend on the sheath voltage. Due to the waveform shape at a high number of applied harmonics (Fig. 1), the sheath voltage is maximum at the powered electrode side for a long fraction ofTRF. This results in FIG. 11. Dependence of the dc self-bias voltage, η, on the identical phase angle of the even harmonics, θ¼θ2¼θ4 (θ1¼θ3¼0$), for different numbers of applied harmonics,N, and different values of theγ-coefficient (γ¼0.0, 0.2, 0.4). Discharge conditions:p¼100 Pa,ftot¼120 V. Note that the symbols completely overlap in some cases, e.g., atN¼1.
ionization induced by SEs at the powered electrode during a longer fraction of TRFcompared to the grounded electrode side, which finally leads to an asymmetric ionization profile and a higher plasma density at the powered electrode compared to the grounded one. This is the reason whyΓiis higher at the powered electrode compared to the grounded electrode at θ¼0$ and higher at the grounded electrode at θ¼180$ compared to the powered electrode [Figs. 12(b) and12(d)]. As tuning θchanges the symmetry of the spatio-temporal distribution of the ioniza- tion, mainly concentrated in the sheath regions (see Fig. 13 for N¼4), the ionflux does not remain constant as a function ofθ at both electrodes. This effect is most pronounced at high numbers of applied harmonics and high values of the γ-coefficient. For N¼2,Γi changes by a factor of about 1.3 and 1.6 at the electrodes by changing θfrom 0$to 180$, for γ¼0:0 and γ¼0:4, respectively. For N¼4, Γi changes by a factor of about 1.5 and 2 at the electrodes by changingθfrom 0$to 180$, forγ¼0:0 andγ¼0:4, respectively.
2. Realistic heavy-particle induced SEECs,γ*, at 100 Pa The results of the simulations in which the SE yields were cal- culated as a function of the heavy-particle energies at 3 cm, 100 Pa,
andftot¼120 V, are presented below. Similar to the study for the low-pressure regime, both “dirty” and “clean” surface conditions are covered here, and theγ*dandγ*ceffective SEECs are calculated self-consistently for these surface conditions.
Figure 14shows the dc self-bias voltage,η, as a function of the identical phase angle of the even harmonics, θ¼θ2¼θ4, for different numbers of applied harmonics,N, for“dirty”and“clean”
surface conditions. The dc self-bias voltages obtained for“dirty”
surfaces agree with those obtained for“clean” surfaces, as it was found also at the low pressure of 3 Pa (Fig. 6). Similar to the results shown inFig. 11for constantγion-induced SEECs, the dc self-bias voltage can be tuned efficiently by changingθ, and thej jη values at bothN¼2 andN¼4 are close to those obtained by assuming a constant γ-coefficient of 0.0 in the simulations (this can be explained by the relatively low values ofγ*dandγ*cunder these con- ditions, see later inFig. 16). AtN¼2,ηcan be tuned within about +28 V, while at N¼4 the dc self-bias voltage can be changed within about+40 V by tuningθfrom 0$to 180$.
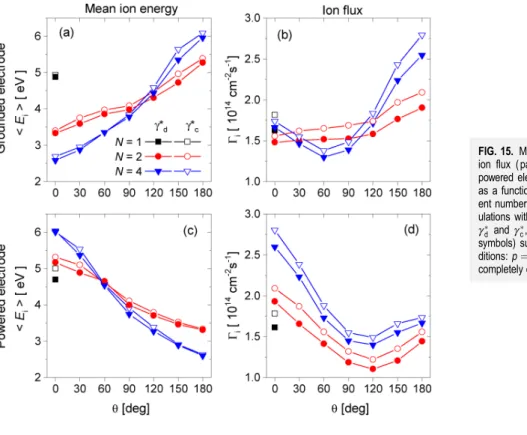
Figure 15shows the mean ion energy,hEii, and the ionflux,Γi, at the grounded and powered electrodes as a function of θ for differentN, for “dirty”(filled symbols) and“clean”(open symbols) surface conditions. For both conditions, hEii can be increased/
decreased by a factor of about 1.6 atN¼2 and by a factor of about FIG. 12. Mean ion energy (panels on the left),hEii, and ionflux (panels on the right), Γi, at the grounded and powered electrodes (top and bottom panels, respectively) as a function of θ¼θ2¼θ4 (θ1¼θ3¼0$) for different numbers of applied har- monics, N, and different values of theγ-coefficient (γ¼0:0, 0.2, 0.4).
Discharge conditions: p¼100 Pa, ftot¼120 V. Note that the symbols completely overlap in some cases.
2.3 atN¼4 at the grounded/powered electrode by changingθfrom 0$to 180$ [these results agree with those obtained forγ¼0:0, see Figs. 15(a)and 15(c)compared toFigs. 12(a)and12(c)]. The hEii energy values for“clean”surfaces are slightly higher (a maximum
difference of 5% can be seen). The ionflux changes by tuningθat both electrodes, coupled to the mean ion energy, for both“dirty”
and“clean”surfaces [Figs. 15(b)and15(d)]. AtN¼2,Γichanges by about 30%, while it changes by about 60% atN¼4 by tuning FIG. 13. Spatio-temporal plots of the ionization rate forN¼4 harmonics, for different phase angles:θ¼0$(left column),θ¼90$(center column), andθ¼180$(right column) and for different values of theγ-coefficient:γ¼0:0 (top row),γ¼0:2 (center row), andγ¼0:4 (bottom row). The powered electrode is atx=L¼0, while the grounded electrode is atx=L¼1.TRFindicates one period of the fundamental frequency. Discharge conditions:L¼3 cm,p¼100 Pa,ftot¼120 V,θ¼θ2¼θ4, θ1¼θ3¼0$). The color scale is logarithmic.
θ from 0$ to 180$, for both“dirty”and “clean” surfaces (these results also agree with those obtained for γ¼0:0). For “clean”
surfaces, higher (up to 12%) ionfluxes are obtained for a givenθ and N compared to “dirty” surfaces (this is different from the
scenario at low pressure, where higher ionfluxes were obtained for“dirty” surfaces compared to“clean” surfaces). This can be explained based on the self-consistently calculated values of the effective SEECs,γ*dandγ*c.
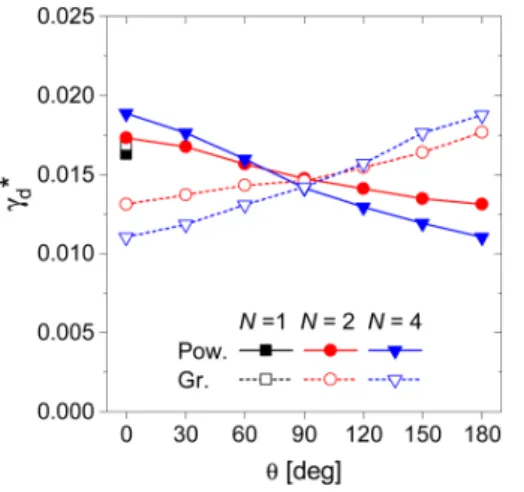
In the case of “clean” surfaces, γ*c¼0:07 for all N and θ, while in the case of“dirty”surfaces even smaller effective SEECs are obtained. γ*d changes as a function of θ at both electrodes (Fig. 16). By tuningθfrom 0$to 180$,γ*dincreases at the grounded electrode (from about 0.013 to about 0.17 at N¼2 and from about 0.011 to about 0.018 atN¼4) and decreases at the powered electrode. Theγ*dvalues found at the powered and grounded elec- trodes atθ¼0$are reversed atθ¼180$. As explained above for the low-pressure case, the dependence ofγ*d onθarises from the dependence of the SE yields on the energies of the heavy particles bombarding the electrodes (seeFig. 2). However, the particle ener- gies are low under high-pressure conditions atftot¼120 V [the maximum of the mean ion energy is about 6 eV at both electrodes, seeFigs. 15(a)and15(c)], resulting in small values of the effective SEECs for both“dirty”and“clean”surface conditions.
The simulations performed at 100 Pa with constant ion- induced SEECs, as well as with realistic self-consistently calcu- lated SEECs, result in the same trends of the ion properties at the electrodes as a function of the control parameter for the mean ion energy, θ. All simulations show that the mean ion energy and the ionflux are coupled asθchanges, i.e., the sepa- rate control of the ion properties cannot be achieved under the conditions studied here. For “dirty” surfaces, γ*d changes as a function of θ at both electrodes, while in the case of “clean”
FIG. 14.Dependence of the dc self-bias voltage, η, on the identical phase angle of the even harmonics, θ¼θ2¼θ4 (θ1¼θ3¼0$), for different numbers of applied harmonics, N, obtained from simulations with self- consistently calculated effective SEECs,γ)dandγ)c, for“dirty”(filled symbols) and“clean”(open symbols) surface conditions, respectively. Discharge condi- tions:p¼100 Pa,ftot¼120 V. Note that the symbols completely overlap in some cases, e.g., atN¼1.
FIG. 15. Mean ion energy (panels on the left),hEii, and ionflux (panels on the right),Γi, at the grounded and powered electrodes (top and bottom panels, respectively) as a function ofθ¼θ2¼θ4(θ1¼θ3¼0$) for differ- ent numbers of applied harmonics,N, obtained from sim- ulations with self-consistently calculated effective SEECs, γ)dandγ)c, for“dirty”(filled symbols) and“clean”(open symbols) surface conditions, respectively. Discharge con- ditions:p¼100 Pa,ftot¼120 V. Note that the symbols completely overlap in some cases.
![Figure 12 shows the mean ion energy [panels (a) and (c)] and the ion fl uxes [panels (b) and (d)] at the grounded and powered elec-trodes for di ff erent numbers of applied harmonics and di ff erent values of the γ-coe ffi cient](https://thumb-eu.123doks.com/thumbv2/9dokorg/1072921.71682/11.892.507.766.178.448/figure-energy-panels-grounded-powered-numbers-applied-harmonics.webp)