Sequence-Based Prediction of Fuzzy Protein Interactions
Marton Miskei
1, Attila Horvath
1, 3, Michele Vendruscolo
2and Monika Fuxreiter
11 - MTA-DE Laboratory of Protein Dynamics,Department of Biochemistry and Molecular Biology, University of Debrecen, Hungary 2 - Centre for Misfolding Diseases,Department of Chemistry, University of Cambridge, UK
3 - The John Curtin School of Medical Research,The Australian National University, Canberra, ACT, 2601, Australia
Correspondence to Monika Fuxreiter: and Michele Vendruscolo:mv245@cam.ac.uk,fmoni@med.unideb.hu.
https://doi.org/10.1016/j.jmb.2020.02.017 Edited by Anna Panchenko
Abstract
It is becoming increasingly recognised that disordered proteins may be fuzzy, in that they can exhibit a wide variety of binding modes. In addition to the well-known process of folding upon binding (disorder-to- order transition), many examples are emerging of interacting proteins that remain disordered in their bound states (disorder-to-disorder transitions). Furthermore, disordered proteins may populate ordered and disordered states to different extents depending on their partners (context-dependent binding).
Here we assemble three datasets comprising disorder-to-order, context-dependent, and disorder-to- disorder transitions of 828 protein regions represented in 2157 complexes and elucidate the sequence- determinants of the different interaction modes. We found that fuzzy interactions originate from local sequence compositions that promote the sampling of a wide range of different structures. Based on this observation, we developed the FuzPred method (http://protdyn-fuzpred.org) of predicting the binding modes of disordered proteins based on their amino acid sequences, without specifying their partners. We thus illustrate how the amino acid sequences of proteins can encode a wide range of conformational changes upon binding, including transitions from disordered to ordered and from disordered to disordered states.
©2020 The Author(s). Published by Elsevier Ltd. This is an open access article under the CC BY-NC-ND license (http://creativecommons.org/licenses/by-nc-nd/4.0/).
A recent major advance in molecular biology has been the discovery of disorderedproteins, which do not fold into well-defined three-dimensional structures but remain conformationally heteroge- neous in their native estates [1]. Specific interactions of disordered proteins first have been interpreted within the folding upon binding scenario, where protein that are disordered in their free states adopt well-defined structures in their bound forms [2]
driven by specific contacts [3]. Such binding mode recapitulates that of ordered protein complexes, where well-defined interaction patterns are pre- requisites for recognition. [4].
Recent experimental and computational results, however, reveal a greater complexity in the binding scenarios of disordered proteinsare more compli- cated. First, the stabilisation of preformed structures may not improve affinity [5,6]. Second, conforma-
tions along the binding trajectory are highly hetero- geneous [7,8], and the bound-state structures may not be sampled even in the transition states of binding [9]. At the same time, structural heteroge- neity enables the recognition of multiple partners [10]. The intricate relationship between ordering and binding affinity is [11] is further illustrated by disordered proteins, which retain conformational disorder in their bound states [12]. Such fuzziness, characterised by structural heterogeneity and a multitude of interaction patterns by multivalent motifs, is in particular a pre-requisite for protein liquid-liquid phase separation [13,14].
The view that conformational heterogeneity is an important functional feature in protein assemblies is gaining recognition [15,16]. Fuzzy proteins are not only characterised by the persistence of disorder in their bound states, but also by the variability in
0022-2836/©2020 The Author(s). Published by Elsevier Ltd. This is an open access article under the CC BY-NC-ND license (http://
creativecommons.org/licenses/by-nc-nd/4.0/). Journal of Molecular Biology(2020)432, 2289e2303
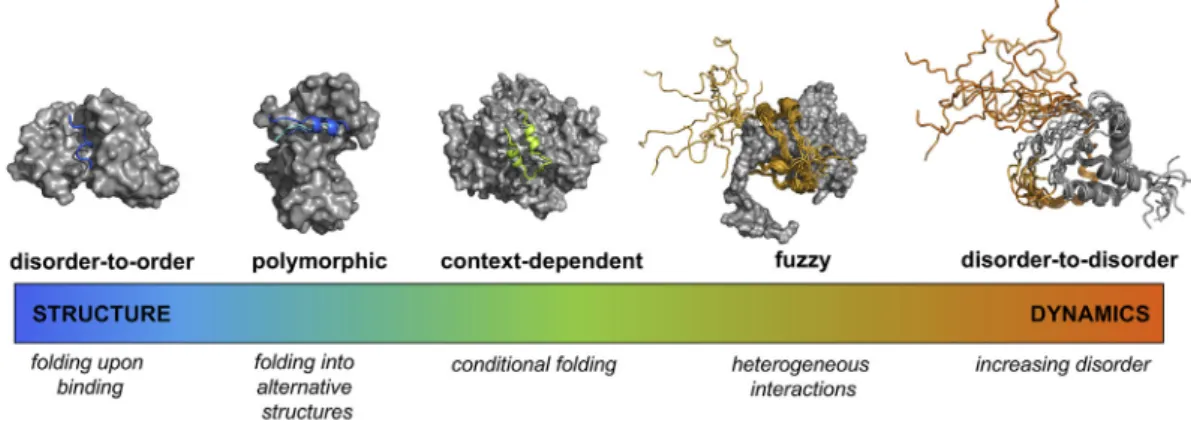
binding modes depending on the interaction partners [17,18]. Thus, it is increasingly clear that there is a continuum in the structural changes of disordered proteins upon binding ranging from decreasing to increasing disorder, (Fig. 1). The spectrum of these binding modes can be quantified using conforma- tional entropy (
D
Sconf): from disorder-to-order regions (DORs), whereD
Sconf is reduced, to disorder-to-disorder regions (DDRs), whereD
Sconfremains high or increases upon binding [19,20].
Binding modes of context-dependent regions may also depend on the partners and cellular environ- ments [21]. While we have reached a good consensus about the prediction of the degree of disorder of proteins in their monomeric states [22,23], understanding their behaviour in the bound state requires the development of sequence-based prediction methods. Current algorithms only address the problem of disorder-to-order transitions of linear peptides [24e26], but cannot characterize the continuum of interaction modes.
To elucidate the sequence determinants of the different binding modes of disordered protein regions (Fig. 1), in particular, to delineate the driving forces of fuzzy interactions, we assembled three datasets (Methods, Figs. S1eS3), representing disorder-to-order, disorder-to-disorder and context- dependent transitions of 828 regions coupled to their complex formation (Fig. 2, Tables S1eS3). We found that binding modes of disordered regions are determined by their local sequence biases, rather than their absolute sequence or structural proper- ties. Thus, we developed the FuzPred method, to predict the continuum of interaction modes of
disordered regions from folding to unfolding (i.e.
increasing heterogeneity) upon binding (Fig. 1). In contrast to previous methods focusing on short disorder-to-order binding motifs, the FuzPred approach quantifies the probabilities of the binding modes, which are estimated from the sequences without prior information on their specific partners.
The FuzPred method thus links probabilities of structural transitions to biomolecular recognition modes and thereby serves as a basis of structure- function relationships.
Results
Datasets representing different binding modes of disordered protein regions
We defined three distinct classes along the continuum of binding modes (Fig. 1), coupled with the interactions of disordered protein regions (Fig.
2). Disorder-to-order regions gain a well-defined conformation upon binding, whereas disorder-to- disorder regions remain disordered while interacting with their partners [27,28]. Context-dependent regions exhibit both types of behaviours, depending on the partners or experimental conditions (Fig. 2).
Datasets representing these classes were derived from two sources. The Protein Data Bank (PDB), provided the structures of protein regions in their free and bound states (Fig. S1). In PDB, DORs were defined based on missing electron density in the monomeric state and well-defined conformation in all
Fig. 1. Binding modes of disordered proteins sample a wide spectrum of structure and dynamics. The sequence region (14e24 AA, skyblue) of the merozoite surface protein 2 of Plasmodium falciparum folds upon interacting with the monoclonal antibody m6D8 (PDB: 4qxt [63]). Ribosomal S6 kinase 1 adopts different secondary structures (skyblue, marine, slate) upon binding to S100B, corresponding to the autoinhibited and active forms (PDB:5csf, 5csi, 5csj [27]). The N-terminal region (15e45 AA, lime) of ribonucleoside-diphosphate reductase large chain conditionally folds depending on its partner (PDB: 1zyz, 1zzd [64]). The p150 subunit of the eukaryotic initiation factor 4F (orange) wraps around the translation initiation factor 4E, but its N-terminal flanking region (215e235 AA) is not constrained in the assembly (PDB:
1rf8 [65]). Upon interactions between leukemia fusion protein AF9 (gray) and elongation factor AF4 (orange) (PDB:2lm0 [66]) both partners retain considerable conformational heterogeneity The partner proteins are shown by gray surfaces. The purpose of the FuzPred method is to provide sequence-based predictions of binding modes to locate proteins on specific points on the order (blue) to disorder (red) continuum.
representative complexes (Methods,Fig. 3andS1, Table S1). DDRs in the PDB were defined based on missing electron density in the monomeric states, as well as in all representative complexes (Methods, Fig. 3andS1,Table S1). Our data assembly differs from previous ones [24,25] as we have collected all available complexes of the same protein region (Fig.
S3), which enabled us to assess the preference for a given binding mode (Fig. 3 and S1). The PDBTOT
dataset contains only those protein regions, which were observed in a uniform binding mode in all representative complexes. Those protein regions, which had missing electron density in the monomeric state, were observed in both structured and dis- ordered state in the bound form (Methods, Fig. 3 andS1) and were classified as context-dependent regions (PDBCDR,Table S3).
The Fuzzy Complexes Database (FuzDB, http://
protdyn-database.org) [29] assembles those protein regions that remain conformationally heterogeneous in their bound states, and such fuzziness contributes to function [29]. Thus, the FuzDB links functional to structural data and provides molecular insights into the mechanisms of disorder-to-disorder or fuzzy
regions (Fig. S2). DDRs may be directly involved in the binding interface or may impact binding via allosteric effects [30e32]. As the molecular mechan- isms by which disorder-to-disorder regions contri- bute to interactions may not be straightforward to elucidate [33,34], the examples from FuzDB [29]
provide clear evidence for the functional importance of disorder-to-disorder transitions via well-charac- terised mechanisms [30,31,35]. We defined fuzzy regions with extensive conformational exchange in the complex form as disorder-to-disorder regions in theFuzDBTOTdataset (Fig. S2,Table S2). Disorder- to-order regions in FuzDBTOT were based on structural data of the FuzDB complexes (Table S2).
The three datasets (Tables S1eS3) comprising 828 nonoverlapping protein regions represent three distinct binding modes of disordered regions upon binding (PDBTOT: DOR/DDR, FuzDBTOT: DOR/
DDR, PDBCDR: CDR). Both unbound and bound states of DORs, DDRs and CDRs were confirmed by experimental evidence. We also eliminated trunca- tion artefacts and polymorphic cases [4], where the well-defined disordered binding motif occupied multi- ple positions [36,37]. Taken together these three Fig. 2. Illustration of the three different binding modes of disordered proteins considered in this work. Disorder- to-Order transition. An example of this binding mode is the case of cell-cycle kinase inhibitor p27Kip1. The free state, illustrated here by the structural ensemble PED2AAA [67], becomes ordered upon binding the Cdk2/cyclin complex (PDB:1jsu).Disorder-to-Disorder transition. An example of this binding mode is given by the cyclin-dependent kinase inhibitor Sic1, which is disordered in its free state, illustrated here by the structural ensemble PED9AAA, and remains disordered upon interacting with the Cdc4 ubiquitin ligase, as shown by the structural ensemble PED5AAC [68].Context- Dependent binding. An example of this binding mode is given by the PCNA-associated factor p15PAF. The region of residues 51e71 (salmon) in the free state, illustrated here by the structural ensemble PED6AAA, becomes ordered upon interacting with PCNA, but the region flanking the PIP-motif may also remain to be disordered upon PCNA sliding or DNA interactions [69] (coordinates as a courtesy of Dr. Francisco Blanco).
2291 Fuzzy Protein Interactions
datasets represent an extensive collection of binding modes in 2157 complexes.
Sequence and structural features associated with different binding modes
Using these three datasets, we aimed to identify those compositional and structural properties that distinguish proteins and regions in the three classes of binding modes. Disorder-to-order and disorder-to-disorder regions were represented in bothPDBTOT(Table S1) andFuzDBTOT(Table S2) datasets. These proteins exhibit markedly different structural preferences: we found in particular that proteins in the PDBTOT (Table S1) dataset are more structured than in FuzDBTOT (Table S2) regarding both secondary (p ¼ 5.2 107 KS- test; p ¼ 3.6 107 by MW-test) and tertiary structure propensities (p < 2.2 1016 KS-test;
p < 2.2 1016 MW-test, Fig. S4). Within each dataset, proteins containing disorder-to-order and disorder-to-disorder regions have rather similar
characteristics (Fig. S5), suggesting that their local properties determine the binding modes of protein regions.
Our results indicate that DORs and DDRs exhibit a significant difference in length, composition and disorder propensities in bothPDBTOTandFuzDBTOT
datasets (Fig. 4). DORs are considerably shorter than DDRs (p¼6.8106KS-test, p¼1.210-
5 MW-test in FuzDBTOT), and their amino acid compositions are shifted towards charged residues (Fig. 4andS6). DORs are frequently associated with aggregation-promoting residues (e.g. Q and N), reflecting the role of disorder-to-order transition in amyloid formation (Fig. 4 and S6). DDRs are enriched in P and S as compared to DORs, suggesting a possible role of P cis-trans isomerisa- tion and S phosphorylation in modulating transitions towards increased conformational heterogeneity.
Both DORs and DDRs may vary from being fully structured to fully disordered consistently inPDBTOT
and FuzDBTOT datasets, although a significant difference can be observed between these two Fig. 3. Illustration of the procedure for the assignment of a binding mode to a protein region. Using the example of glycogen synthase kinase 3b, we show here how we defined disorder-to-order (DO) regions (O, blue) as those not visible in the free form structure in the PDB (H, heterogeneous), but could be observed in the bound state structures in the PDB (upper left). Disorder-to-disorder (DD) regions (D,orange) are defined as those that are heterogeneous in both free and bound forms in the PDB (upper right). Context-dependent (CD) regions (C, lime) can sample both ordered and heterogeneous states in their bound structures. Different binding modes of GSK3 are represented by complex structures along the insulin (left, PDB: 4nm3) and Wnt (right, PDB: 4nm5) pathways [70]. GSK-3 is displayed by teal, axin by purple, the autoinhibitory N-terminal peptide (left) and the inhibitory LRP6 peptide (right) are yellow.
binding modes (Fig. 4). In both PDBTOT and FuzDBTOT datasets, DORs are predicted to be more structured than DDRs in the free form.
The challenge of predicting the binding modes, especially DDRs from the sequence, is illustrated by the application of a range of methods developed for the prediction of disorder in the free states of proteins (Fig. S7). The probability of adopting a given binding mode is different from being dis- ordered in the unbound state, which can explain why some DDRs are predicted to be fully ordered (Fig. 4). Furthermore, DDRs may be short seg- ments within well-structured proteins, serving as key elements for regulation [38]. It is also worth
noting that DORs and DDRs have similar second- ary structure preferences (Fig. 4). This under- scores that fuzzy interactions may stem from well- folded secondary structure elements occupying multiple positions within a shallow binding inter- face [39,40].
Context-dependent regions represent a combina- tion of DORs and DDRs, with composition resem- bling fuzzy regions and dynamical properties alike disorder-to-order regions. CDRs are not distin- guished in specific residues in contrast to DORs (Fig. 4 and S6). The unbiased composition, how- ever, is coupled to more constrained dynamics and slightly increased preference for secondary structure Fig. 4. Sequence-based characteristics of disordered protein regions with distinct binding modes.
Characterization of protein regions with disorder-to-order transitions (left) inPDBTOT(dark blue) and inFuzDBTOT(light blue), context-dependent transitions (middle) in PDBCDR(lime), and disorder-to-disorder transitions (right) inPDBTOT
(dark yellow) and inFuzDBTOT(yellow) datasets. Difference in composition from globular protein regions is listed in the order of their increasing abundance in fuzzy regions (Fig. S6). Statistical significance of the differences in the properties of the different binding modes (DORs versus DDRs inPDBTOT; DORs inPDBTOTversus CDRs inPDBCDR; and DDRs in PDBTOTversus CDRs inPDBCDR) are shown in the table below by Kolmogorov-Smirnov (KS) and Mann-Whitney (MW) tests. Disorder-to-order (DORs) and disorder-to-disorder region (DDRs) in the PDBTOTdataset significantly differ in length, composition and propensity of disorder, while exhibit similar degree of regular secondary structures. The propensity of disordered residues in CDRs is comparable to DORs and is significantly different from DDRs.
2293 Fuzzy Protein Interactions
(Fig. 4). These observations suggest that CDRs are flexibl structured motifs, which can be stabilised under specific conditions.
Region-specific probabilities of different inter- action modes
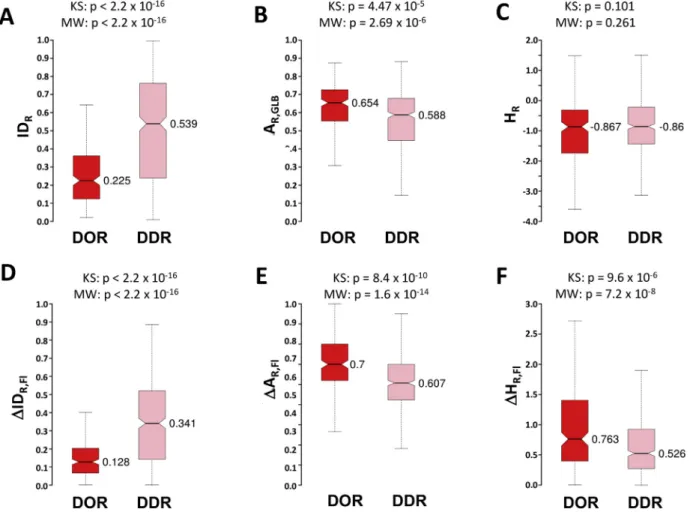
To relate sequence features to different interaction modes, we used a binary logistic model [41], with two classes, disorder-to-order and disorder-to-disorder regions (Methods, Fig. 3). Thus, we discriminated between the interaction modes of protein regions (DOR vs. DDR), rather than between the binding motif from the rest of the protein. The probability pDO(R) expresses our degree of confidence in assigning a region Rto the DOR class, andpDD(R) ¼1-pDO(R), correspondingly, to the DDR class. Although we found that both disorder propensity and amino acid compo- sition (AR,GLB, computed in reference to globular proteins, see Extended methods) significantly differ
between the two classes of binding modes (Fig. 5A and B), we could not obtain a robust model to discriminate between them even using additional terms, such as the Kyte-Doolittle hydrophobicity [42]
(HR,Fig. 5C). This could be rationalised by the wide variation in structural and dynamic properties of the different binding modes (Fig. 4).
In order to solve this problem, we noted that linear peptide motifs often exhibit dynamic interactions, and they have characteristic compositional features as compared to the flanking sequences [43]. Based on these observations, we determined the sequence biases in the binding regions as compared to their flanking segments (Fig. 6A, Extended methods) in disorder propensity (
D
IDR,Fl), amino acid composi- tion (D
AR,Fl) and hydrophobicity (D
HR,Fl). We thus found that all these three parameters (D
IDR,Fl,D
AR,Fl,D
HR,Fl) significantly deviate between DORs and DDRs (Fig. 5DeF) using different flanking window sizes (residues 5e30,Fig. S8) and disorderFig. 5. Comparison between disorder-to-order (DOR, red) and disorder-to-disorder (DDR, pink) regions. (A)e(C) Values of average disorder (IDR), composition (AR,GLB) and hydrophobicity (HR). IDRis computed by the Espritz NMR algorithm [57]. AR,GLBis computed in reference to that of globular proteins. HRis given by the Kyte-Doolittle scale.(D)e(F) Local biases in average disorder (DIDR,Fl), composition (DAR,Fl) and hydrophobicity (DHR,Fl). The bias in these properties was computed in reference to the flanking regions.RandFlare shown onFig. 6. For details see Methods.
prediction algorithms (Fig. S9) and robustly discri- minate between the different interaction modes in a logistic regression model (Methods, Table S4, Fig. S10).
Thus, we expressed the scoring function to predict different modes of binding as a function of the local sequence biases:
SFðRÞ ¼
l
1*D
IDR;FLþl
2*D
AR;Flþ
l
3*D
HR;Flþg
(1) wherel
1,l
2andl
3are the linear coefficients of the predictor variables andg
is a scalar constant (intercept).Within the logistic regression model, the prob- ability of belonging to the DOR class can be derived as
pDOðRÞ ¼ exp SFðRÞ
1 þ exp SFðRÞ (2) whereSF(R)is the scoring function for region R.
Thus, the probability of different interaction modes depends on local sequence biases in composition, hydrophobicity and dynamics as compared to the flanking regions (Fig. 6A). In contrast to ordered binding modes, which exhibit a significant bias, fuzzy interac- tions lack such biases of the binding motifs. Further- more, they have an increased preference for disorder as compared to their neighbouring segments, which facilitates the formation of alternative contacts and a possible exchange between them. The local sequence biases, taken together, govern the different interaction modes of intrinsically disordered protein regions.
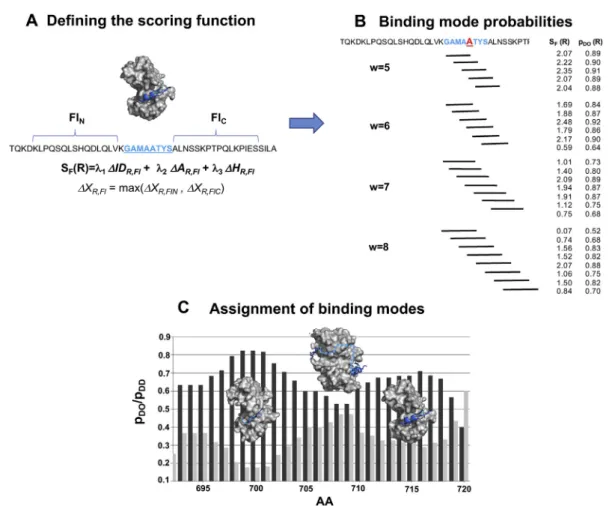
Fig. 6. Prediction of different binding modes of disordered regions by the FuzPred method. We illustrate the procedure in the case of the regionRof residues 695e703 (blue) of ribosomal S6 kinase 1 (RSK1) (UniProt ID: Q15418), which binds the protein S100B (PDB: 5csj [27]).(A) Defining the scoring function.SF(R)is evaluated based on local sequence biases using theDIDR,Fl,DAR,Fl,DHR,Flterms. Flanking sequences used to evaluate theSF(R)terms are shown in black.(B) Binding mode probabilities.SF(R)is computed for different windows of 5e9 residues, which include residue 700 (Ri). For each binding window anSF(Ri)and apDD(Rj)is assigned. Window size of 9 aa is not shown for clarity.(C) Assignment of binding modes. The predictedpDO(dark gray) andpDD(light gray) probabilities characterise the most likely interaction mode. In the case of RSK1, thepDO(dark gray) andpDD(light gray) probabilities indicate two binding sites:
a more stable one, which is observed in the crystal structure and an additional, more labile binding site (residues 716e721), with polymorphic secondary structures [27]. The bipartite binding interface is linked by a region (residues 704e715), with comparablepDOandpDDprobabilities, indicating a context-dependent binding mode.
2295 Fuzzy Protein Interactions
Residue-specific probabilities of different bind- ing modes
To be able to perform sequence-based predictions without information on the specific interaction part- ners, we assign a given residue Ai to different possible binding regions (Fig. 6B) and evaluate the SF(R) scoring functions for each of them (see Methods). Thus, for each possible interaction region, a distinct probability for disorder-to-order transition pDO(Ri)is computed. This procedure provides a set of probabilities pDO(Ri) for all possible interacting regions ofAi(Fig. 6B). The most likely binding mode, defined as the probability for disorder-to-order and disorder-to-disorder transitions of residue Ai upon protein interactions (pDOðAiÞand pDDðAiÞ) will be the median of such pDO(Ri) distributions (see Methods,Fig. 6B).
Thus, for each residue, binding modes are defined by two probabilities for increasing and decreasing order (pDOðAiÞand pDDðAiÞ) (Fig. 6C). These
individual residue probabilities will provide a con- tinuous scale to characterise the most likely binding mode, whether an interaction site tends to gain structure, remains heterogeneous or even increases flexibility upon binding (Fig. 6C).
FuzPred application and performance on differ- ent binding modes of disordered proteins
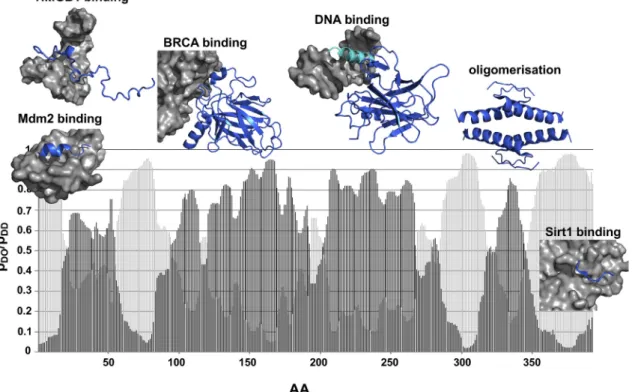
The FuzPred method has been developed to predict different binding modes of disordered protein regions, as illustrated by applying the method to p53 tumor suppressor (Fig. 7). p53 is involved in a number of cellular processes, including cell cycle arrest, DNA repair, senescence or apoptosis and all these activities are tightly controlled by a complex interaction networks [44]. Only the central, DNA-binding domain of p53 structured, the N-terminal transactivation domain and the C-terminus of p53 are intrinsically disordered. p53 specifically recognises a multitude of proteins, which bind to overlapping regions and these interactions are
Fig. 7. Application of the FuzPred method to p53 tumor suppressor. The diversity of binding modes predicted by FuzPred is illustrated in case of the human p53 tumor suppressor (UniProt: P04637) together with structures of some representative complexes (p53 is displayed by marine, partners by gray surfaces). The probabilities for disorder-to-order transitions (pDO, dark gray) indicate that the N-terminal transactivator region folds upon binding to Mdm2 (19e26 aa, PDB:1ycr [46]), as well as to HMGB1 (~35e56 aa, PDB:2ly4 [47]). The binding mode the DNA-binding domain in complex with BRCA (PDB:1kzy [50] or DNA (PDB:2ady [49]) is consistent with experimental data. FuzPred predicts comparable pDOand pDD(light gray) probabilities for the N-terminal recognition helix (~278e291 aa, cyan), indicating conditional folding. The oligomerisation domain (325e356 aa) is predicted to fold upon tetramerisation (PDB:1c26) with higher probability than the N-terminal transactivation domain. HighpDDprobabilities reflect that the C-terminal region remains dominantly disordered in complexes. Only short (5e6 aa motifs) were observed to fold for example in complex with Sirtuin 1 (PDB:4zzj), into highly polymorphic structures.
further modulated by posttranslational modifications [45]. FuzPred shows distinct binding modes of p53 with different partners (Fig. 7). The increased disorder-to- order probabilities at the N-terminal transactivator region (17e56 aa) indicate folding upon binding, as observed in complex with Mdm2 (19e26 aa, PDB:1ycr [46]) or HMGB1 (~35e56 aa, PDB:2ly4 [47]). The folding probabilities, however, are rather moderate, indicating mobility of these structured binding elements within the complex, in line with experimental data [48].
FuzPred predicts a more pronounced disorder-to-order transition for the oligomerisation domain (325e356 aa), which was observed to form stable tetramers (PDB:1c26) [49]. Higher order organisation of p53 structure is critical for its transcriptional activity.
FuzPred prediction shows that the p53 DNA-binding domain is further stabilised upon binding to DNA or BRCA (PDB:1kzy [50]). Interestingly, the DNA recog- nition helix (~278e291 aa) exhibits comparable probabilities for disorder-to-order and disorder-to-dis- order transitions, indicating a dynamic binding mode (Fig. 7). The p53 C-terminus forms specific complexes with a variety of proteins (Sirtuin, CBP, S100
b
, CyclinA2) via short motifs [51]. FuzPred predictions indicate a negligible disorder-to-order transition of the C- terminus, which is consistent with the polymorphic nature of the bound regions (PDB:4zzj) (Fig. 7).
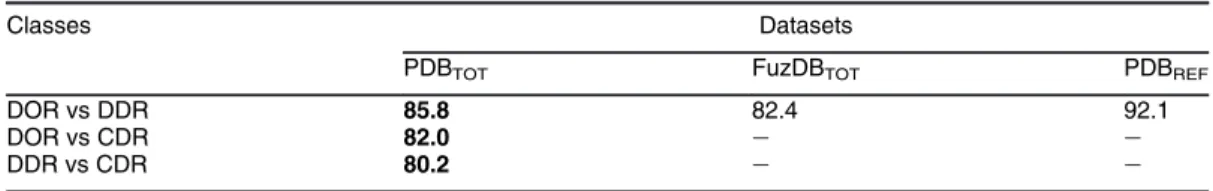
The FuzPred performance in distinguishing the three classes (disorder-to-order, disorder-to-disor- der and context-dependent) of binding modes is summarised in Table 1. We did not identify these binding elements from the proteins, rather compared the respective protein regions with different interac- tion modes. Our results indicate that FuzPred can reliably distinguish between regions with different binding modes, especially between disorder-to-order and disorder-to-disorder transitions (DOR vs. DDR, Table 1). Testing FuzPred on protein regions, which were observed in the same binding mode in at least three complexes, considerably improves the results (Table 1). The slightly lower performance on differentiating between context-dependent binding modes from disorder-to-disorder transitions indicate that many DDRs may conditionally fold (Table 1).
Comparison of FuzPred with other methods
The scope of FuzPred is different from other algorithms, as it predicts different binding modes (Figs. 1 and 2), rather than identifying stable binding motifs. Therefore, it is not straightforward to compare its performance on disorder-to-order regions to other predictors (Anchor2 [52], MoRFchibi [25] and Dis- opred3 [26]), which aim to identify only such binding elements in disoredered proteins. Because of differ- ences in datasets, class definitions and approaches, the following factors have to be considered for the comparison. (i) FuzPred discriminates between dif- ferent classes of binding modes, such as disorder-to- order, disorder-to-disorder, or context-dependence, whereas the other methods discriminate between disorder-to-order and everything else, which may include disorder-to-disorder, order-to-disorder, and context-dependent binding. This also means that FuzPred discriminates between different regions, whereas the other methods between binding regions and the protein. (ii) In the datasets used for the FuzPred development (Methods), experimental evi- dence is available for each protein region in both the free and bound forms, which enables an unambig- uous classification of the binding modes (Fig. 3). In the MoRF dataset (with the exception of 53 cases) [53], as well as the original Anchor dataset [24], the free state disorder is derived from disorder predic- tions. Another important factor is the redundancy of bound state structures in FuzPred datasets (Fig. S3), which increases the confidence in the binding modes (Methods). Our dataset assembly also considered additional factors, such as polymorphism of regular secondary structures, or truncation artefacts, which were not analysed in other methods (Methods).
For comparing FuzPred performance on disorder- to-order binding elements to other methods, we filtered only those disorder-to-order regions in PDB-
TOT, which mediated intermolecular interactions (PDBINT, Methods). The negative sets were defined in two different ways. First, we assessed how the different methods discriminate disorder-to-order regions from disorder-to-disorder regions, which do not fold upon binding. In the Anchor and MoRF
Table 1. FuzPred performance on the different binding modes of disordered proteins.AUC values are displayed in %. The analysis compares disorder-to-order (DOR), disorder-to-disorder (DDR) and content-dependent (CDR) interactions to each other. Context-dependent regions are derived from PDBCDR(Methods) and were not included in the parametrisation.
Classes Datasets
PDBTOT FuzDBTOT PDBREF
DOR vs DDR 85.8 82.4 92.1
DOR vs CDR 82.0 e e
DDR vs CDR 80.2 e e
The bold column is where comparison with other methods could be made.
2297 Fuzzy Protein Interactions
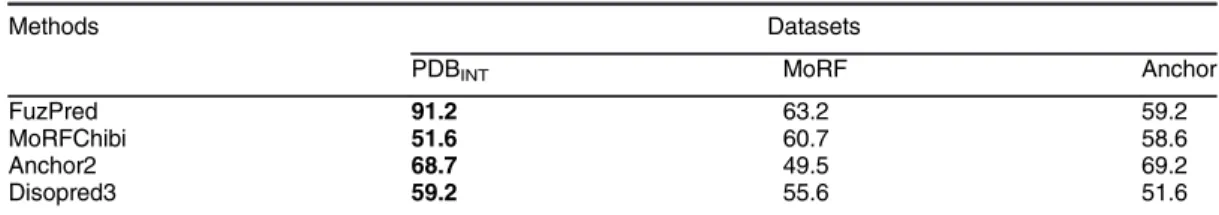
datasets, we defined DDRs as disordered regions flanking the structured binding site, as they have not been observed to fold in the bound state [24,25]. In the Anchor and MoRF datasets, FuzPred has slightly better performance than the other methods in dis- criminating disorder-to-order and disorder-to-order regions (Table 2). On the PDBINTdataset, however, which has experimental evidence also for disorder-to- disorder transitions (unlike Anchor and MoRF data- sets), FuzPred performs significantly better than the other methods (Tables 2 and S5). This result demonstrates that FuzPred was developed to differ- entiate between different binding modes, whereas the other methods aimed to discriminate between a disorder-to-order motif and the rest of the protein.
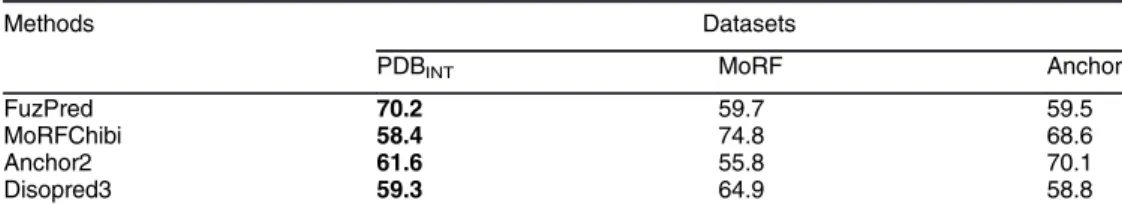
This point is illustrated by comparing FuzPred predictions with context-dependent regions considered as disorder-to-order binding motifs rather than as a distinct class of binding modes, which decreases the Matthews coefficients of FuzPred from 0.69 to 0.43 on the PDBINTdataset (Table S5) further demonstrate the consequences of mixing different binding modes in the reference set, we compared the performance of FuzPred to other methods in identifying disorder-to- order binding sites using the protein as a reference, similarly other approaches (Table 3). Using this method of comparison, FuzPred still performs con- siderably better than the other methods on the PDBINT
dataset, where disorder-to-order are distinguished from context-dependent regions (Table 3). FuzPred predictions, however, are less powerful on the Anchor [24] and MoRF [25] datasets, where binding motifs also include context-dependent regions, and the negative class (protein) comprises a variety of regions with a wide range of binding modes.
Taken together, FuzPred performs very well in discriminating different binding modes, especially in identifying fuzzy interactions. In addition, the FuzPred method can be employed to predict disorder-to-order binding motifs and distinguish them from context- dependent regions, which may only fold with specific partners or cellular conditions.
Discussion and conclusions
At the molecular level, the wide variety of protein- protein interactions that are required to reliably perform the myriad cellular processes taking place in living organisms may be established through the modulation of protein conformational ensembles. It is increasingly recognised that such adaptive transitions form a continuum from decreasing to increasing order (Fig. 1). In order to better understand the sequence- dependent rules that regulate such binding modes, we have shown in this work that biases in composition of the interaction site versus the local context are crucial (Fig. 5). In particular, a strong bias as compared to the flanking regions promotes ordering of the interaction site, while similarity to the local environment likely results in redundant, alternative contacts leading to conformationally heterogeneous, fuzzy complexes. We have demonstrated that the FuzPred approach (Fig. 6) can robustly discriminate between these two scenarios and identify fuzzy interactions (Fig. 7,Table 1).
Furthermore, by predicting the probabilities of both disorder-to-order and disorder-to-disorder transitions, the FuzPred method provides a continuous scale to characterise versatile binding modes of disordered protein regions. Furthermore, this approach could be useful to identify context-dependent regions, which can structurally adapt to different cellular conditions.
In conclusion, the FuzPred method (http://protdyn- fuzpred.org) can contribute to the endeavour of characterising the wide range of protein binding modes, without prior information on their partners.
FuzPred provides a parameter (pDO/pDD) to locate a protein on a specific point of the order-to-disorder continuum (Fig. 1). This information can be particularly useful in understanding the functional roles of dis- ordered proteins in the absence of information about their binding partners. More generally, this approach makes it possible to extend to protein interactions the highly successful sequence-based methods intro- duced in the last decades to predict the structures and behaviours of proteins in their free states.
Table 2. FuzPred performance on disorder-to-order binding sites versus disorder-to-disorder regions as compared to other disordered binding site prediction methods. The positive set in PDBINT was defined as disorder-to-order regions with at least 1 residue mediating intermolecular interactions in PDBTOT(Methods,Table S1), whereas in Anchor [24] and MoRF [25] datasets the positive set comprised disordered sites, which fold upon binding as defined in the original references. Negative sets in PDBINTwere defined as fuzzy regions in PDBTOT(Methods,Table S1), in MoRF and Anchor datasets as disordered regions flanking the folded binding motif (Methods).
Methods Datasets
PDBINT MoRF Anchor
FuzPred 91.2 63.2 59.2
MoRFChibi 51.6 60.7 58.6
Anchor2 68.7 49.5 69.2
Disopred3 59.2 55.6 51.6
This is the comparison of the dataset of this article, the other datasets were published elsewhere (their inclusion was requested by the reviewers).
Materials and Methods
Datasets
PDBTOT(Fig. S1,Table S1)
We searched for conformationally heterogeneous regions in the Protein Data Bank (PDB) using crystal structures with a resolution higher than 3 Å. These were defined as residues with missing coordinates, based on the coordinate file and not only on the PDB file header. Protein sequences with posttranslational modifications or nonstan- dard amino acids were excluded. Unobserved residues, which were due to truncation artefacts were eliminated.
First, monomeric structures were analysed, and hetero- geneous regions5 AA were selected (1251 monomeric structures). For analysing binding modes, missing residues were also identified in the corresponding complex struc- tures. Sequences of protein regions were projected onto their UniProt reference, and only perfectly matching sequences (both in monomeric and complex structures) were accepted (1738 complexes). The flowchart of the assembly of thePDBTOTdataset is displayed in Fig. S1.
The resulting set was redundant, with multiple instances of evidence, i.e. complex structures involving the same protein regions. Proteins inPDBTOThad<75% sequence similarity using the CD-hit program [54].
The ordered or heterogeneous character of all residues was assigned in all the complexes based on experimental data (Fig. 3). The PDBTOT dataset contained those protein segments (513 regions, 5 AA), which were heterogeneous in the monomeric state, and was observed only in one state (structured/heterogeneous) in all the complexes (Fig. 3). The PDBTOT dataset contained 175 disorder-to-order (DOR) regions, which were invisible in monomeric structures, but were observed in the corresponding complexes (Table S1). A total of 338 protein regions, which retained conforma- tional heterogeneity in both free and bound states, were classified as disorder-to-disorder regions (Table S1).
Unambiguously classified regions were excluded from the PDBTOT dataset and were analysed for context- dependence. As thePDBTOTcontains higher resolution structures than those in FuzDB [29], the assembled
proteins (Fig. S4) have different structural and dynamical properties. ThePDBTOTis shifted towards shorter, more ordered protein segments (Figs. S4 and S5).
FuzDBTOT(Fig. S2,Table S2)
TheFuzDBTOTdataset (Table S2) was assembled based on the Fuzzy Complexes Database v3.3 (http://protdyn- database.org) [29]. Conformational heterogeneity of fuzzy regions was assessed by a range of techniques (e.g. X-ray, NMR, FRET, CD, AUC, SAXS), including lower resolution methods (e.g. size-exclusion chromatography, fluorescence anisotropy, atomic force microscopy). Only dynamical protein regions were included, which interchange between a multitude of conformations within the assembly (Fig. S2).
Out of the total 106 complexes in the FuzDB v3.3 database, 92 dynamic assemblies were considered with 121 fuzzy regions5 AA. The location of the DDRs (i.e. start and end residues) were defined based on experimental evidence given in the FuzDB database. Disorder-to-order (DOR) regions have not been systematically collected in the FuzDB, and these had to be defined based on experimental evidence and literature search. Folded secondary structure elements, with ms-ms movements, were excluded from this category (in cases where experimental data was available), resulting in 30 DORs5 AA in theFuzDBTOT(Table S2).
The flowchart of the assembly of the FuzDBTOTdataset is displayed inFig. S2.
PDBCDR(Fig. S1,Table S3)
Structures of protein segments may be observed or remain invisible, depending on the cellular context. In case, at least five consecutive residues were observed in more than one state (ordered/heterogeneous) in different complexes, it was defined as a context-dependent region (CDR, Fig. 3). 164 CDRs with alternative dynamical characters were identified in 1063 complexes (Fig. S1, Table S3). ThePDBCDRdataset was more redundant than the PDBTOT dataset, with 6 versus 2 complexes repre- senting one protein region in average (Fig. S3). CDRs can adopt different states in different assemblies, but may also serve as dynamical switches within the same assembly.
Importantly, the interconversion between heterogeneous and structured/ordered states is not induced by posttran- slational modifications (PTMs).
Table 3. FuzPred performance on disorder-to-order binding sites versus the protein as compared to otherdisorderedbinding site prediction methods.The positive set in PDBINT
was defined as disorder-to-order regions with at least 1 residue mediating intermolecular interactions in PDBTOT(Methods,Table S1), whereas in Anchor [24] and MoRF [25] datasets the positive set comprised disoredered sites, which fold upon binding as defined in the original references (as inTable 2). Negative sets were defined as all other residues in the corresponding disordered proteins (not as regions as inTable 2) with stratified sampling applied.
Methods Datasets
PDBINT MoRF Anchor
FuzPred 70.2 59.7 59.5
MoRFChibi 58.4 74.8 68.6
Anchor2 61.6 55.8 70.1
Disopred3 59.3 64.9 58.8
This is the comparison of the dataset of this article, the other datasets were published elsewhere (their inclusion was requested by the reviewers).
2299 Fuzzy Protein Interactions
PDBREF(Table S1)
FromPDBTOTwe derived a dataset of DORs and DDRs, which were represented in at least three bound-state structures (Fig. S3) with the same sequence. In addition, we filtered those regions, where monomeric structures did not contain metal ions or small molecules, which might have influenced the degree of disorder in the free state.
ThePDBREFdataset contained 130 DOR and 318 DDR residues.
Structure predictions
Prediction of secondary structure
Preferences for secondary structures were computed by the GOR4 algorithm [55]., which resulted in a good agreement between the predicted and observed second- ary structures of disordered binding regions [56].
Prediction of disorder
Espritz [57], Iupred [58], Dynamine [59], Disopored3 [26]
disorder prediction algorithms were applied to 121 DDRs in FuzDBTOT(Table S2) using different options and thresholds.
Residues were classified as ordered or disordered, and the propensities of disordered residues were determined in the analysed regions. The Espritz NMR method [57] with threshold¼0.3089 resulted in the best agreement with the experimentally validated DDRs inFuzDBTOT(Fig. S10).
Quality assessmentesegmental overlap measure Prediction accuracy was assessed using the segmental overlap measure (SOV) [60]:
where Sobs and Spred are the observed and predicted segments, minov(Sobs;Spred)is the overlap between Sobs
andSpred,maxov(Sobs;Spred)is the total extent of (SobsþS-
pred), l(Sobs) is the length of the observed region and d(Sobs;Spred) is the mininum of [maxov(Sobs;Spred) - minov(Sobs;Spred); minov(Sobs;Spred); l(Sobs)/l(Spred)] and the summations goes over the number of conformational states: ordered or disordered.
The scoring function
Terms
The terms for the scoring function, such as the local bias in disorder (DIDR,Fl), composition (DAAR,Fl) and hydro- phobicity (DHR,Fl) are defined in Supplementary informa- tion (Extended methods).
Training sets
We aimed to develop a universal and robust model, which is applicable to proteins with different structural and dynamical characteristics. Thus, we divided bothPDBTOT
andFuzDBTOTinto training and test sets. First, we aimed to keep the training set size at minimum and probe how transferrable the model is between the two datasets. Thus, the FuzDB training set (FuzDBTrain) was assembled from complexes, where both DORs are fuzzy regions were represented with 20 DDRs and 13 DORs. We also defined different PDBTrain datasets with comparable size (20 DDRs and 20 DORs). We carried out parametrisation independently on these datasets and cross-validated the results (Fig. S11). We also developed a scoring function on a unified dataset, which contained both (UniDBTrain¼PDBTrainþFuzDBTrain).
Strikingly, different parametrisations of the SF(R) scoring function on the FuzDBTrain, PDBTrain, and UniDBTraintraining sets had comparable performances on the FuzDBTest and PDBTest dataset, respectively (Fig. S11). These results imply that the degree of order/
disorder of proteins may not be critical for predicting the degree of fuzziness. For further probing of this point, cross-validation of FuzPred on the FuzDBTOT and PDBTOT datasets was carried out. The SF(R) scoring function trained on the FuzDBTrain set resulted in AUC ¼ 85.6% on PDBTOT, while the scoring function parametrised on PDBTrain led to AUC ¼ 83.9% on FuzDBTOT. These results reflect the robustness of the method on datasets with remarkably different structural and dynamical properties.
After these initial tests, we also probed the sensitivity of the parameters on the size of the training set (Table S4).
The final coefficients of the scoring function were determined based on the logistic regression analysis of
different training sets inPDBREFusing the three bias terms (as in eq.(1)).
Training the scoring function
A binary logistic regression (Extended methods) model was applied to discriminate between disorder-to-order and disorder-to-disorder regions. Initially, we used a model with six independent variables: average disorder (IDR), compo- sition (AR,GLB) and hydrophobicity (HR) of the region of interest; the local bias in disorder (DIDR,Fl), composition (DAR,Fl)and hydrophobicity (DHR,Fl) ofRas compared to its flanking segments (Extended methods). The average composition was given in reference to that of globular proteins [61]. The coefficients and the significance of the predictor contributions were probed by step-wise analysis, which corroborated that only the local biases (DIDR,Fl, DAR,Fl,DHR,Fl) provide significant contributions (Fig. S12).
SOV ¼100 N
Xn
i¼1
X
Si
minov
Sobs;Spred
þ
d
Sobs;Spredmaxov
Sobs;Spred
lðSobsÞ (3)
Thus, theSF(R)scoring function (eq.(1)) was based on these three terms, and the coefficients and the significance of the predictor contributions were determined by logistic regression for many different training sets derived from PDBREF.
Residue-based scoring
For evaluating the contribution of individual residues to dynamical adaptations, a running window was defined with a given size (w) and the FuzPred score of the window for each possible position was determined (Fig. 6B). The window sizes were based on the length of the disorder-to- order regions in thePDBTOTdataset (Table S1). The score of a given residue was obtained from the distributions of theSF(R)scores:
where pDO(Ri) is the probability of disorder-to-order transition with a given binding regionRi, nis the number of possible binding regions ofAibetween a given length range (5e9 residues). The disorder-to-order transition probability of Ai is computed as the median of the distribution fpDOðRiÞgn. The probability for disorder-to- disorder transition is obtained aspDD(Ri)¼1-pDO(Ri).
Assessment of performance
ROC curves
The DO and DD characters of individual residues Riwere assigned based on the comparison of the respective pDOðRiÞ and pDDðRiÞ probabilities. Receiver operating characteristic (ROC) curves were computed using the R program. The true positive rate (TPR) was calculated as a function of the false positive rate (FPR, sensitivity) using the experimentally observed disorder-to- order, disorder-to-disorder and context-dependent regions. The area-under-the-curve (AUC) was determined by the R program.
Testing the method
The performance of the method was assessed on both thePDBTestdataset (Table S1),FuzDBTOT[29] datasets (Table S2). To probe the robustness of the method, we randomly varied the size and composition of the training and test datasets and obtained very similar results using a wide range of training/test sets.
Comparison to other methods
A cross-validation was carried out to evaluate the performance of FuzPred versus methods, which were developed to predict disordered regions that fold upon binding: Anchor [52], MoRFchibi [25] and Disopred3 [26].
DORs predicted by FuzPred were compared to the ID
binding sites in the respective test datasets; while the flanking regions, which did not adopt a folded structure in the complex, were considered as DDRs. In return, the disordered binding site predictions were applied to DORs inPDBINT(Table S1) with at least one residue within 3.5 Å from the partner. The performance was assessed on a residue basis.
Statistical analysis
Statistical significance of the deviation between two distributions was computed by Kolmogorov-Smirnov and Mann-Whitney tests as implemented in the R program.
Statistical significance of the difference between two ROC curves were computed by the method DeLong et al. [62].
Bootstrapping of the amino acid composition was carried out using 1000 samples.
Acknowledgements
M.F. and M.V. are indebted to Hao Wu for valuable discussions. M.F. acknowledges the financial support of HAS-11015 and GINOP-2.3.2-15-2016-00044.
M.M. was supported by the Bolyai Janos fellowship of the Hungarian Academy of Sciences (Hungary).
Author contributions
M.M. assembled the datasets and developed the algorithm, H.A. performed the statistical analysis; M.F.
developed the methodology and analysed the results, M.F. and M.V. designed the study, and wrote the paper.
Appendix A. Supplementary data
Supplementary data to this article can be found online athttps://doi.org/10.1016/j.jmb.2020.02.017.
Received 6 December 2019;
Received in revised form 24 January 2020;
Accepted 14 February 2020 Available online 27 February 2020
Keywords:
fuzzy interactions;
disordered proteins;
protein binding;
fuzzy complexes;
folding upon binding pDOðAiÞ ¼medianfpDOðRiÞgn ¼ median
exp SFðRiÞ 1 þ exp SFðRiÞ
n
(4) 2301 Fuzzy Protein Interactions
References
[1] R. van der Lee, M. Buljan, B. Lang, R.J. Weatheritt, G.W. Daughdrill, A.K. Dunker, et al., Classification of intrinsically disordered regions and proteins, Chem. Rev.
114 (2014) 6589e6631.
[2] P.E. Wright, H.J. Dyson, Intrinsically unstructured proteins:
re-assessing the protein structure-function paradigm, J. Mol.
Biol. 293 (1999) 321e331.
[3] P.E. Wright, H.J. Dyson, Linking folding and binding, Curr.
Opin. Struct. Biol. 19 (2009) 31e38.
[4] R. Pancsa, M. Fuxreiter, Interactions via intrinsically dis- ordered regions: what kind of motifs? IUBMB Life 64 (2012) 513e520.
[5] W. Borcherds, F.X. Theillet, A. Katzer, A. Finzel, K.M. Mishall, A.T. Powell, et al., Disorder and residual helicity alter p53-Mdm2 binding affinity and signaling in cells, Nat. Chem. Biol. 10 (2014) 1000e1002.
[6] S.L. Shammas, M.D. Crabtree, L. Dahal, B.I. Wicky, J. Clarke, Insights into coupled folding and binding mechan- isms from kinetic studies, J. Biol. Chem. 291 (2016) 6689e6695.
[7] A. Toto, C. Camilloni, R. Giri, M. Brunori, M. Vendruscolo, S. Gianni, Molecular recognition by templated folding of an intrinsically disordered protein, Sci. Rep. 6 (2016) 21994.
[8] E. Karlsson, E. Andersson, J. Dogan, S. Gianni, P. Jemth, C. Camilloni, A structurally heterogeneous transition state underlies coupled binding and folding of disordered proteins, J. Biol. Chem. 294 (2019) 1230e1239.
[9] J. Dogan, X. Mu, A. Engstrom, P. Jemth, The transition state structure for coupled binding and folding of disordered protein domains, Sci. Rep. 3 (2013) 2076.
[10] C. Bignon, F. Troilo, S. Gianni, S. Longhi, Partner-mediated polymorphism of an intrinsically disordered protein, J. Mol.
Biol. 430 (2018) 2493e2507.
[11] J.G. Olsen, K. Teilum, B.B. Kragelund, Behaviour of intrinsically disordered proteins in protein-protein complexes with an emphasis on fuzziness, Cell. Mol. Life Sci. 74 (2017) 3175e3183.
[12] A. Borgia, M.B. Borgia, K. Bugge, V.M. Kissling, P.O. Heidarsson, C.B. Fernandes, et al., Extreme disorder in an ultrahigh-affinity protein complex, Nature 555 (2018) 61e66.
[13] S. Boeynaems, S. Alberti, N.L. Fawzi, T. Mittag, M. Polymenidou, F. Rousseau, et al., Protein phase separation: a new phase in cell biology, Trends Cell Biol.
28 (2018) 420e435.
[14] H. Wu, M. Fuxreiter, The structure and dynamics of higher- order assemblies: amyloids, signalosomes, and granules, Cell 165 (2016) 1055e1066.
[15] L. Warfield, L.M. Tuttle, D. Pacheco, R.E. Klevit, S. Hahn, A sequence-specific transcription activator motif and power- ful synthetic variants that bind Mediator using a fuzzy protein interface, Proc. Natl. Acad. Sci. U. S. A. 111 (2014) E3506eE3513.
[16] R. Rosenzweig, A. Sekhar, J. Nagesh, L.E. Kay, Promiscu- ous binding by Hsp70 results in conformational heterogene- ity and fuzzy chaperone-substrate ensembles, eLife 6 (2017).
[17] P. Tompa, M. Fuxreiter, Fuzzy complexes: polymorphism and structural disorder in protein-protein interactions, Trends Biochem. Sci. 33 (2008) 2e8.
[18] M. Fuxreiter, Fuzziness in protein interactions-A historical perspective, J. Mol. Biol. 430 (2018) 2278e2287.
[19] D. Kurzbach, T.C. Schwarz, G. Platzer, S. Hofler, D. Hinderberger, R. Konrat, Compensatory adaptations of structural dynamics in an intrinsically disordered protein complex, Angew. Chem. 53 (2014) 3840e3843.
[20] S. Hadzi, A. Mernik, C. Podlipnik, R. Loris, J. Lah, The thermodynamic basis of the fuzzy interaction of an intrinsi- cally disordered protein, Angew Chem. Int. Ed. Engl. 56 (2017) 14494e14497.
[21] M. Miskei, A. Gregus, R. Sharma, N. Duro, F. Zsolyomi, M. Fuxreiter, Fuzziness enables context dependence of protein interactions, FEBS Lett. 591 (2017) 2682e2695.
[22] M.E. Oates, P. Romero, T. Ishida, M. Ghalwash, M.J. Mizianty, B. Xue, et al., D(2)P(2): database of disordered protein predictions, Nucleic Acids Res. 41 (2013) D508eD516.
[23] P. Sormanni, D. Piovesan, G.T. Heller, M. Bonomi, P. Kukic, C. Camilloni, et al., Simultaneous quantification of protein order and disorder, Nat. Chem. Biol. 13 (2017) 339e342.
[24] B. Meszaros, I. Simon, Z. Dosztanyi, Prediction of protein binding regions in disordered proteins, PLoS Comput. Biol. 5 (2009) e1000376.
[25] N. Malhis, J. Gsponer, Computational identification of MoRFs in protein sequences, Bioinformatics 31 (2015) 1738e1744.
[26] D.T. Jones, D. Cozzetto, DISOPRED3: precise disordered region predictions with annotated protein-binding activity, Bioinformatics 31 (2015) 857e863.
[27] G. Gogl, A. Alexa, B. Kiss, G. Katona, M. Kovacs, A. Bodor, et al., Structural Basis of Ribosomal S6 Kinase 1 (RSK1) Inhibition by S100B Protein: modulation of the extracellular signal-regulated kinase (ERK) signaling cascade in a calcium-dependent way, J. Biol. Chem. 291 (2016) 11e27.
[28] S. Lukhele, A. Bah, H. Lin, N. Sonenberg, J.D. Forman-Kay, Interaction of the eukaryotic initiation factor 4E with 4E-BP2 at a dynamic bipartite interface, Structure 21 (2013) 2186e2196.
[29] M. Miskei, C. Antal, M. Fuxreiter, FuzDB: database of fuzzy complexes, a tool to develop stochastic structure-function relationships for protein complexes and higher-order assem- blies, Nucleic Acids Res. 45 (2017) D228eD235.
[30] M. Fuxreiter, I. Simon, S. Bondos, Dynamic protein-DNA recognition: beyond what can be seen, Trends Biochem. Sci.
36 (2011) 415e423.
[31] M. Fuxreiter, Fuzziness: linking regulation to protein dynamics, Mol. Biosyst. 8 (2012) 168e177.
[32] R. Sharma, Z. Raduly, M. Miskei, M. Fuxreiter, Fuzzy complexes: specific binding without complete folding, FEBS Lett. 589 (2015) 2533e2542.
[33] M. Fuxreiter, P. Tompa, Fuzziness: Structural Disorder in Protein Complexes Austin, Landes BioScience/Springer, New York, 2012.
[34] F. Troilo, C. Bignon, S. Gianni, M. Fuxreiter, S. Longhi, Experimental characterization of fuzzy protein assemblies:
interactions of paramyxoviral NTAIL domains with their functional partners, Methods Enzymol. 611 (2018) 137e192.
[35] M. Fuxreiter, P. Tompa, Fuzzy complexes: a more stochastic view of protein function, Adv. Exp. Med. Biol. 725 (2012) 1e14.
[36] T.A. Graham, D.M. Ferkey, F. Mao, D. Kimelman, W. Xu, Tcf4 can specifically recognize beta-catenin using alterna- tive conformations, Nat. Struct. Biol. 8 (2001) 1048e1052.
[37] M.R. Fontes, T. Teh, D. Jans, R.I. Brinkworth, B. Kobe, Structural basis for the specificity of bipartite nuclear
localization sequence binding by importin-alpha, J. Biol.
Chem. 278 (2003) 27981e27987.
[38]M. Kato, R.M. Wynn, J.L. Chuang, S.C. Tso, M. Machius, J. Li, et al., Structural basis for inactivation of the human pyruvate dehydrogenase complex by phosphorylation: role of disordered phosphorylation loops, Structure 16 (2008) 1849e1859.
[39] P.S. Brzovic, C.C. Heikaus, L. Kisselev, R. Vernon, E. Herbig, D. Pacheco, et al., The acidic transcription activator Gcn4 binds the mediator subunit Gal11/Med15 using a simple protein interface forming a fuzzy complex, Mol. Cell 44 (2011) 942e953.
[40]Y. Wang, J.C. Fisher, R. Mathew, L. Ou, S. Otieno, J. Sublet, et al., Intrinsic disorder mediates the diverse regulatory functions of the Cdk inhibitor p21, Nat. Chem. Biol. 7 (2011) 214e221.
[41]D.R. Cox, The regression analysis of binary sequences, J. Roy. Stat. Soc. B 20 (1958) 215e242.
[42]J. Kyte, R.F. Doolittle, A simple method for displaying the hydropathic character of a protein, J. Mol. Biol. 157 (1982) 105e132.
[43]M. Fuxreiter, P. Tompa, I. Simon, Local structural disorder imparts plasticity on linear motifs, Bioinformatics 23 (2007) 950e956.
[44]B. Vogelstein, D. Lane, A.J. Levine, Surfing the p53 network, Nature 408 (2000) 307e310.
[45]F. Toledo, G.M. Wahl, Regulating the p53 pathway: in vitro hypotheses, in vivo veritas, Nat. Rev. Canc. 6 (2006) 909e923.
[46] P.H. Kussie, S. Gorina, V. Marechal, B. Elenbaas, J. Moreau, A.J. Levine, et al., Structure of the MDM2 oncoprotein bound to the p53 tumor suppressor transactiva- tion domain, Science 274 (1996) 948e953.
[47] J.P. Rowell, K.L. Simpson, K. Stott, M. Watson, J.O. Thomas, HMGB1-facilitated p53 DNA binding occurs via HMG-Box/p53 transactivation domain interaction, regu- lated by the acidic tail, Structure 20 (2012) 2014e2024.
[48] M. Wells, H. Tidow, T.J. Rutherford, P. Markwick, M.R. Jensen, E. Mylonas, et al., Structure of tumor suppressor p53 and its intrinsically disordered N-terminal transactivation domain, Proc. Natl. Acad. Sci. U. S. A. 105 (2008) 5762e5767.
[49]M. Kitayner, H. Rozenberg, N. Kessler, D. Rabinovich, L. Shaulov, T.E. Haran, et al., Structural basis of DNA recognition by p53 tetramers, Mol. Cell 22 (2006) 741e753.
[50] W.S. Joo, P.D. Jeffrey, S.B. Cantor, M.S. Finnin, D.M. Livingston, N.P. Pavletich, Structure of the 53BP1 BRCT region bound to p53 and its comparison to the Brca1 BRCT structure, Genes Dev. 16 (2002) 583e593.
[51]C.J. Oldfield, J. Meng, J.Y. Yang, M.Q. Yang, V.N. Uversky, A.K. Dunker, Flexible nets: disorder and induced fit in the associations of p53 and 14-3-3 with their partners, BMC Genom. 9 (Suppl 1) (2008). S1.
[52]B. Meszaros, G. Erdos, Z. Dosztanyi, IUPred2A: context- dependent prediction of protein disorder as a function of redox state and protein binding, Nucleic Acids Res. 46 (2018) W329eW337.
[53]A. Mohan, C.J. Oldfield, P. Radivojac, V. Vacic, M.S. Cortese, A.K. Dunker, et al., Analysis of molecular recognition features (MoRFs), J. Mol. Biol. 362 (2006) 1043e1059.
[54]W. Li, A. Godzik, Cd-hit, A fast program for clustering and comparing large sets of protein or nucleotide sequences, Bioinformatics 22 (2006) 1658e1659.
[55] J. Garnier, J.-F. Gibrat, B. Robson, GOR secondary structure prediction method version IV, Methods Enzymol.
(1996) 540e553.
[56]M. Fuxreiter, I. Simon, P. Friedrich, P. Tompa, Preformed structural elements feature in partner recognition by intrinsi- cally unstructured proteins, J. Mol. Biol. 338 (2004) 1015e1026.
[57]I. Walsh, A.J. Martin, T. Di Domenico, S.C. Tosatto, ESpritz:
accurate and fast prediction of protein disorder, Bioinfor- matics 28 (2012) 503e509.
[58]Z. Dosztanyi, V. Csizmok, P. Tompa, I. Simon, The pairwise energy content estimated from amino acid composition discriminates between folded and intrinsically unstructured proteins, J. Mol. Biol. 347 (2005) 827e839.
[59]E. Cilia, R. Pancsa, P. Tompa, T. Lenaerts, W.F. Vranken, From protein sequence to dynamics and disorder with DynaMine, Nat. Commun. 4 (2013) 2741.
[60]A. Zemla, C. Venclovas, K. Fidelis, B. Rost, A modified definition of Sov, a segment-based measure for protein secondary structure prediction assessment, Proteins 34 (1999) 220e223.
[61]P. Tompa, Intrinsically unstructured proteins, Trends Bio- chem. Sci. 27 (2002) 527e533.
[62]E.R. DeLong, D.M. DeLong, D.L. Clarke-Pearson, Compar- ing the areas under two or more correlated receiver operating characteristic curves: a nonparametric approach, Biometrics Bull. 44 (1988) 837e845.
[63]R.A. Morales, C.A. MacRaild, J. Seow, B. Krishnarjuna, N. Drinkwater, R. Rouet, et al., Structural basis for epitope masking and strain specificity of a conserved epitope in an intrinsically disordered malaria vaccine candidate, Sci. Rep.
5 (2015) 10103.
[64] H. Xu, C. Faber, T. Uchiki, J.W. Fairman, J. Racca, C. Dealwis, Structures of eukaryotic ribonucleotide reduc- tase I provide insights into dNTP regulation, Proc. Natl.
Acad. Sci. U. S. A. 103 (2006) 4022e4027.
[65]J.D. Gross, N.J. Moerke, T. von der Haar, A.A. Lugovskoy, A.B. Sachs, J.E. McCarthy, et al., Ribosome loading onto the mRNA cap is driven by conformational coupling between eIF4G and eIF4E, Cell 115 (2003) 739e750.
[66] B.I. Leach, A. Kuntimaddi, C.R. Schmidt, T. Cierpicki, S.A. Johnson, J.H. Bushweller, Leukemia fusion target AF9 is an intrinsically disordered transcriptional regulator that recruits multiple partners via coupled folding and binding, Structure 21 (2013) 176e183.
[67]M. Varadi, S. Kosol, P. Lebrun, E. Valentini, M. Blackledge, A.K. Dunker, et al., pE-DB: a database of structural ensembles of intrinsically disordered and of unfolded proteins. Nucleic Acids Res. 42 (2014) D326eD335.
[68]T. Mittag, S. Orlicky, W.Y. Choy, X. Tang, H. Lin, F. Sicheri, et al., Dynamic equilibrium engagement of a polyvalent ligand with a single-site receptor, Proc. Natl. Acad. Sci. U. S.
A. 105 (2008) 17772e17777.
[69]A. De Biasio, A.I. de Opakua, G.B. Mortuza, R. Molina, T.N. Cordeiro, F. Castillo, et al., Structure of p15(PAF)-PCNA complex and implications for clamp sliding during DNA replication and repair, Nat. Commun. 6 (2015) 6439.
[70]J.L. Stamos, M.L. Chu, M.D. Enos, N. Shah, W.I. Weis, Structural basis of GSK-3 inhibition by N-terminal phosphor- ylation and by the Wnt receptor LRP6, eLife 3 (2014) e01998.
2303 Fuzzy Protein Interactions