CAPITAL STRUCTURE AND RELIGION.
SOME INTERNATIONAL EVIDENCE*
Ingrid-Mihaela DRAGOTĂ – Victor DRAGOTĂ – Andreea CURMEI-SEMENESCU – Daniel Traian PELE
(Received: 6 March 2017; revision received: 7 January 2018;
accepted: 14 February 2018)
In the recent years, an increasing number of papers deepened cross-disciplinary studies, examining how different cultural values infl uence fi nancial variables. The main objective of our paper is to test if the dominant world religions (Buddhist, Christian, Hindu, Islamic, and Judaic), and, moreover, some Christian denominations (Catholicism, Protestantism and Eastern Orthodox Christianity) are related to some patterns in capital structure. Our paper considers distinctly the category of countries in which Agnostics, Atheists and non-religious people are predominant.
The results are promising. Companies located in the states with predominance of Islamic religion have a lower leverage, while the ones from predominantly Catholic, Eastern Orthodox, Hindu and Judaic countries, as well as those in mainly Agnostic, Atheist and non-religious ones, are indebted more than those from mainly Protestant countries. The debt maturity seems to be correlated to the dominant religions or denominations, with companies in the predominantly Eastern Orthodox, Buddhist and Agnostic, Atheist and non-religious countries relying more on short term debt, and those in the majority Catholic, Judaic and Hindu countries on long term debt.
Keywords: capital structure, culture, religion, fi rm-specifi c factors, country-specifi c factors JEL classifi cation indices: G32, Z12, Z13
* This work was partially supported by the Executive Agency for Higher Education, Research, Development and Innovation Funding (UEFISCDI), project number AT code 86/2007, and co- financed by the Center of Financial and Monetary Research (CEFIMO). The authors wish to thank for the useful comments received on preliminary drafts of this paper to the participants to the EWGFM Conference in Stockholm (2008), EMQFB Conference in Tîrgu-Mureş (2013), FWPO Conference in Cluj-Napoca (2013) and EWGCFM Conference in Vienna (2013). The remaining errors are ours. The authors benefited also from the useful remarks provided by Elena Dumitrescu, Claudiu Herţeliu and Hanaan Yaseen.
Ingrid-Mihaela Dragotă, corresponding author. Professor at the Bucharest University of Econom- ic Studies, Department of Finance, Bucharest, Romania, E-mail: mihaela.dragota@fin.ase.ro Victor Dragotă, Professor at the Bucharest University of Economic Studies, Department of Fi- nance and Center of Financial and Monetary Research (CEFIMO), Bucharest, Romania. E-mail:
victor.dragota@fin.ase.ro
Andreea Curmei-Semenescu, Associate Professor at the Bucharest University of Economic Stud- ies, Department of Finance and Center of Financial and Monetary Research (CEFIMO), Bucharest, Romania. E-mail: andreea.semenescu@fin.ase.ro
Daniel Traian Pele, Associate Professor at the Bucharest University of Economic Studies, Depart- ment of Statistics and Econometrics, Bucharest, Romania. E-mail: danpele@ase.ro
1. INTRODUCTION
Undoubtedly, debt-equity mix and the determinants of capital structure are issues that have received attention in corporate finance literature. Various theories try to explain the differences between companies’ capital structures, over time and across regions.
According to the classical approaches in finance, investors make the decisions related to capital structure in a rational manner.1 The behaviour of other stake- holders is seldom taken into account (Meyer 2016). The viewpoint expressed by De Bondt – Thaler (1995: 385) is illustrative: “in finance, we simply insist that, whatever the people do, they do it right. [...] As a result, it is nearly devoid of people.” Symptomatically, the empirical evidences are not always consistent in substantiating a particular capital structure theory. Recent studies take more and more into account the socio-cultural factors in modelling corporate finance deci- sions. Unfortunately, sometimes (especially when large databases are used) it is difficult to precisely define culture as a quantifiable variable. However, religion, as a proxy for culture, has some advantages, one of the most important being the availability of data (e.g., Barro – McCleary 2003a).
In the past years, religion is analysed as a plausible determinant for different economic decisions (Iannaccone 1998; Helble 2007; Fourie et al. 2015; Schneider et al. 2015; Küçük 2016). Since more than 80% of the human population declare themselves as adherent to one religion or another,2 religion can be an important factor. Religion is also involved in other corporate finance choices. For instance, the beginnings of the social responsibility concept are strongly related to religion (Mallin 2004; Renneboog et al. 2008).
In addition to the existing literature, our study reveals that some religions and major Christian denominations are associated with certain patterns in capital structure, both for developed and developing countries. Thus, companies located in the states with predominance of Islamic religion have a lower leverage, while the ones from mainly Catholic, Eastern Orthodox, Hindu and Judaic countries are indebted more than those from the predominantly Protestant countries. Moreover, the debt maturity seems to be correlated to the dominant religions or denomina- tions, with companies in the predominantly Eastern Orthodox or Agnostic coun-
1 Some studies are questioning the hypothesis of rational behaviour of different agents, but these studies are exceptions. See, for instance, among others, Shleifer – Summers (1990).
2 According to http://www.thearda.com – World Religions (2005), only 11.3% of the world population declared themselves as non-religious and only 2.4% as atheist. In our study, we assume that people who declare this religions affiliation are (at least at large extent) adherent to that religion. Some studies put under question this assumption (see, for example, Herţeliu et al. 2015).
tries relying more on short term debt, and those in majority Hindu countries on long term debt.
From a quantitaive point of view, this study takes into account a greater number of countries (74 countries, compared to Gonzales – Gonzales 2008 and Fan et al.
2012, both with only 39 countries) for the period of 2005–2010. A wider range of religions have been taken into account too, including Buddhism, Hinduism, and Judaism. Also, we considered distinctly the category of countries in which the Agnostics, Atheists and non-religious people are predominant.3 Regarding the methodology, we used panel analysis with random effects.
The rest of the paper is structured as follows. In Section 2, the most important studies on capital structure are reviewed and the tested hypotheses are presented.
Section 3 describes the data and the methodology. The results are discussed in Section 4. Section 5 concludes the study.
2. RELATED LITERATURE AND TESTED HYPOTHESES
In their classical paper, Modigliani – Miller (1958) emphasised that, under certain restrictive conditions, the value of a company is unaffected by how the firm is financed. Later, relaxing these hypotheses (taking into account factors, such as taxation, agency problems, or asymmetric information), several empirical stud- ies on developed or emerging countries concluded that the debt-equity choice is relevant.4 Moreover, they revealed that capital structure is determined both by the firm-specific and the country-specific factors (see, among others, Cook – Tang 2010).
A huge list of firm-specific determinants of capital structure is proposed by the literature (Table 2). Other studies revealed the importance of the country-spe- cific factors, like legal origin, corruption, economic development, development of the banking sector, equity and bond markets, protection of shareholders’ and creditors’ rights, corporate governance variables, level of interest rates, national culture, etc. (Chui et al. 2002; Deesomsak et al. 2004; Delcoure 2007; Gonzales – Gonzales 2008). Some of these country-specific factors have been widely studied in the literature (see the legal origin, e.g. La Porta et al. 1997, 1998 and the cor- ruption, e.g. Fan et al. 2012), but there are others which were not sufficiently explored (e.g. religion).
3 It can be noticed that all the countries in which Agnostics, Atheists and non-religious people are predominant are or were ruled by communist regimes.
4 The surveys of Harris – Raviv (1991), Myers (2003) and Guriev – Kvasov (2009) present these main issues.
By now, the connection between national culture (with an accent on corpo- rate culture) and decision-making is accepted in literature (Hilary – Hui 2009).
Various relationships between stakeholders in companies from different countries are presented in a large number of papers of comparative finance (e.g., Sekely – Collins 1988; Fauver et al. 2004; Goergen et al. 2005; Mayer et al. 2007).
Recent studies reveal that the maximization of the shareholders’ wealth is not always declared as the most important objective for the management of compa- nies (Loderer et al. 2010). A company is a coalition of groups with common but also conflicting goals, as defined by Cyert – March (1963). At corporate level, the decisions can be the effect of negotiations between different stakeholders, not only managers, shareholders and creditors, but also unions or other different employees with decision-rights, communities, policy makers, professional asso- ciations, NGOs, education institutions, etc. In this context, some cultural patterns can have a significant influence, even though this is not the result of a rational decision from a financial viewpoint based on corporate finance principles. Ac- cording to the behavioural consistency theory (Cronqvist et al. 2012), the deci- sions in professional and personal lives are similar. The firm can be considered as an assembly of heterogeneous groups, each of them with different values, utility functions, powers in negotiation and decision making and also with common values given by the cultural and social environment in some cases too (see, also, Hofstede 1983; regarding capital structure, see Sekely – Collins 1988; Chui et al.
2002). Assuming that companies are at least as trend representative for the soci- ety to which they belong, it can be interesting to find if one religion or another is associated with some capital structure patterns.
Religion is often used as a proxy for culture (La Porta et al. 1999; Hilary – Hui 2009; Fourie at al. 2015). In our study, we use the approach of Guiso et al.
(2006: 23), who define culture as “those customary beliefs and values that ethnic, religious, and social groups transmit fairly unchanged from generation to gen- eration”. This definition focuses only on those dimensions of culture, inherited by any person from previous generations, which can impact economic outcomes.
In this context, religion and religious practices are considered at least as a trend- invariant over an individual’s lifetime and, moreover, more invariant from gen- eration to generation for a long period of time. This perspective allows us to avoid the problem of causality between culture and economics. Thus, religion can be an explanatory variable for economics (including here debt-equity choice); but economics is not a necessary explanation for religion, because other variables (e.g. earnings, education, etc.), intergenerational mobility (Caballe 2016) can complicate this relationship. Hence, the association between religious affiliation (the specific religious group to which the stakeholders belong) and corporate behaviour as regards the debt-equity choice can be explained.
The existing literature already documented a positive relation between indi- viduals’ religiosity and risk aversion (Miller – Hoffmann 1995), extended at or- ganisational level by Hilary – Hui (2009). Different studies provide evidence of the religiosity affecting mainly the trust, which is an important ground of in- dividuals’ financial behaviour. Arruñada (2010) points out that the Protestants are more likely to trust people. This may be one of the explanations of different levels of development of the capital markets across countries. Stulz – Williamson (2003) demonstrate that religion affects the degree of protection of investors’
rights and this influence is more significant in the case of creditors’ rights. They associate countries with the predominance of Protestant denomination with better corporate governance and higher protection of investors’ rights compared with the Catholic ones (this can explain the preference for equity financing mainly in the predominantly Protestant countries).
Baxamusa – Jalal (2014) prove that the firms in the Catholic majority US counties are more indebted than those in the Protestant areas. They conclude that beyond the level of financial development, the predominant religion can help to explain the debt-equity choice. Also, religion can affect companies directly through a specific set of values and indirectly through its impact on wealth. Guiso et al. (2003) showed that religiosity increases the propensity to save, and that the Catholic value thrifts more than the Protestants. Renneboog – Spaenjers (2012) identify differences in attitude toward saving and investing decisions between the Catholics and the Protestants: the Catholic households have a high propensity to save, but are more risk averse. Considering these results obtained in previous studies, we could expect that the religious aspects impact the preference for debt and equity financing.
The mechanisms through which culture may influence managerial decisions are complex and economic literature is far from having explored them thorough- ly. On the one hand, the religious beliefs of the managers can influence financial decisions, and on the other hand, stakeholders’ cultural values can be equally important. Hence, the managers need to take into account the opinion of a broader range of stakeholders because their disagreement with the managerial decision can be harmful for the company. Therefore, we need to emphasise the role of diverse stakeholders.
Moreover, the cultural features of different stakeholders can affect organisa- tional behaviour in the context of the association between religion and debt-equity choice (Baxamusa – Jalal 2014). Schneider (1987) proves that not the situational variables, such as technology, structure or external environment, but people deter- mine organisational behaviour, and also that they are depending on an attraction- selection-attrition cycle. Similar people choose same type of organisations and gradually they begin to determine the behaviour of the companies. Further, those
employees who do not fit in the company leave, and those who remain become part of a more homogeneous group than at the beginning. So, similar employees in terms of cultural background will choose the same company, and then they will start to influence the goals, the processes and structures of the company.
In this context, in our approach the accent falls on the cultural characteristics of the society in which the companies operate. This approach has the potential to better comprise the diverse mechanisms through which culture and, in particular, the religious beliefs influence capital structure decisions.5 Hence, our first tested hypothesis is:
H1: Religion is related to capital structure.
Formulating this hypothesis, we did not include any expectation regarding the sign of the dependency between different religions and capital structure. It is explainable because some deepest theological explanations in this multi-cultural context can be subtle for an economist, and maybe sometimes contradictory.6 However, some expectations regarding the results can be formulated. For exam- ple, the Islamic tradition excludes all types of investments in preferred stocks and fixed-income securities that promise a guaranteed return (see, among others, Ayub 2007). Investors have the right to a “decent rate of return” (Zaher – Has- san 2001) based on the Profit-Loss-Sharing principle, which reduces the amount of speculation in the financial markets, but increases the volume of investments based on ethically responsible business practices (Walkshäusl – Lobe 2012). The investments must respect the principles of Islamic Sharia, thereby implying that some types of businesses are generally rejected.7 Moreover, banks (among other investors/stakeholders) have to consider some financial ratio filters when they se- lect companies for investment8 (for a detailed presentation of these principles see Zaher – Hassan 2001, and Hussein – Omran 2005). Guiso et al. (2003) show that
5 The manner in which different states are involved in regulating and enforcing some religious issues is very diverse. Thus, in different countries some religions can be encouraged or dis- couraged, accepted, not recognized, or even forbidden, financed from public sources or not, etc. The conformism to the main social accepted values (including religion) is an issue that can determine some differences between countries.
6 An approach based on the theological arguments as explanations for the debt-equity mix can be an interesting field of study. Some insights, though not focused on the relation between capital structure and religion can be found in Appendix A2 in Schneider et al. (2015).
7 Milly – Sultan (2012) prove that the Islamic stocks listed globally have outperformed the con- ventional stocks and socially responsible investment stocks during the recent financial crisis.
8 These ratios are: Total Debts 33%
Total Assets ; Account Receivables 45%
Total Assets ; Non operating Interest Income 5%.
Revenues
They are obviously related to the capacity of these companies to face their debt service (Zaher – Hassan 2001). Especially the first ratio determines a lower level of corporate leverage com- paratively to the financial systems where this filter is not applicable.
relative to other religious denominations, Christianity fosters trust and that Chris- tians rely more on private ownership than Muslims do. In contrast to Muslims who are against competition, Catholics favour competition. Moreover, according to the Profit-Loss-Sharing principle, the “depositors” in Islamic banks are very similar to shareholders that earn dividends when the company turns a profit and lose a part of their savings when it records a loss. From these perspectives, we expect the level of corporate leverage in predominantly Islamic countries to be lower relative to the companies from mainly Christian countries.
Assuming that it is possible for some religions to have an impact on capital structure decision, this study offers an answer to one supplementary question:
Which religions have more influence on capital structure decision? Thus, it is possible for the values of one religion not to be in accordance with the values of another one. Which of them will determine a lower leverage?
Moreover, analysing the Christian religion deeper, it is found to be possible for some Christian denominations to have a different impact on the capital struc- ture decision. Again, it is possible for the values of one denomination not to be in accordance with the values of another one. Consequently, the second tested hypothesis is:
H2: Christian denominations are related to capital structure.
For instance, are there significant differences between the leverage ratios in the predominantly Eastern Orthodox, Catholic or Protestant countries? Some ex- pectations regarding the results can already be provided. Baxamusa – Jalal (2014) compared the leverage between the Catholic-majority and the Protestant-majority US counties and found that the firms located in the Catholic-majority counties had a higher leverage. They proposed one historical explanation, pointing out that the debt financing was encouraged by the Catholic Church in the medieval period. Following the Reformation movement, the Catholic Church did not en- courage commercial interactions with the Protestants. In this unfriendly business environment, the Protestants were “forced” to develop an alternative financing system, more connected to equity financing. Also, cultural differences between these denominations can explain the differences in capital structure. According to Baxamusa – Jalal (2014), the Protestants consider that the benefits from property ownership belong to the owners, while the Catholics consider these benefits as social goods. Moreover, they state that the Catholic Church is more involved in the life of the community, as an arbiter of common good, unlike the Protestants, where each individual can decide for himself/herself what is good or wrong.
A greater individualism for the Protestants is a better environment for equity financing (Aggarwal – Goodell 2010).
Religion can have effects on different decisions (including here the decision regarding the debt-equity mix) through at least four channels: (i) religion can
impose some requirements, especially in the case in which religious power in- terferes with the legal and quasi-legal regulations; (ii) even when the require- ments like the ones mentioned at (i) are no longer enforced by the law, instead a conservatory attitude maintaining some of these old rules can be present in legislation or other rules; (iii) religious beliefs can induce a specific individual behaviour (similar to Cronqvist et al. 2012); (iv) social conformism can motivate a person to adopt a behaviour in accordance with the socially accepted rules, even he or she has no personal values concordant with these rules.
3. DATA AND METHODOLOGY
In order to test these hypotheses, a combined model was estimated, taking into account both firm-specific and country-specific determinants. The following model is applied:
it k kit j jt it,
k j
Debt Ratio α
β X
γ X ω (1) where ωit= ɛi+ vit (random effects) and i is the index corresponding to each com- pany in the sample; t records the year, Xk are the firm specific determinants; Xj are the characteristic variables for country j (country specific determinants), α is the level of Debt Ratio assumed to be independent of exogenous variables and βk and γj are the coefficients. The use of random effects in the model is justified by the lack of variation in time of some of the country factors that influence capital structure, such as religion/denomination variables.Three categories of variables are used, such as for: (i) capital structure; (ii) firm-specific factors; and (iii) country-specific factors.
We started with a sample of companies from 82 countries for the period of 2005–2010. The data were obtained from the Thomson Reuters Datastream and include all the companies available in this database listed in the most important national equity indices. From this initial sample, we excluded financial compa- nies because they are subject to specific regulation regarding the debt ratios and they also affect data homogeneity for Price to Book ratio (hereafter, P/B) or for the return on assets (Isakov – Weisskopf 2014). We also eliminated companies with negative or null values for total assets, net sales and market capitalisation and negative values for capital expenditures, long and short term debt. In order to avoid bias in the results generated by the companies in distress, we also excluded companies with negative shareholders’ equity. As a final filter, we kept in our sample only the companies presenting reliable financial indicators for the entire period of 2005–2010. These companies are listed in the main national equity
index for at least six years consecutively, which proves their maturity. Thus, we limit the possible bias caused by the inclusion of young companies, which are expected to have a different financing policy due to their phase of life cycle rather than to a financial strategy. Hence, as a starting point we have a database contain- ing 5402 companies.
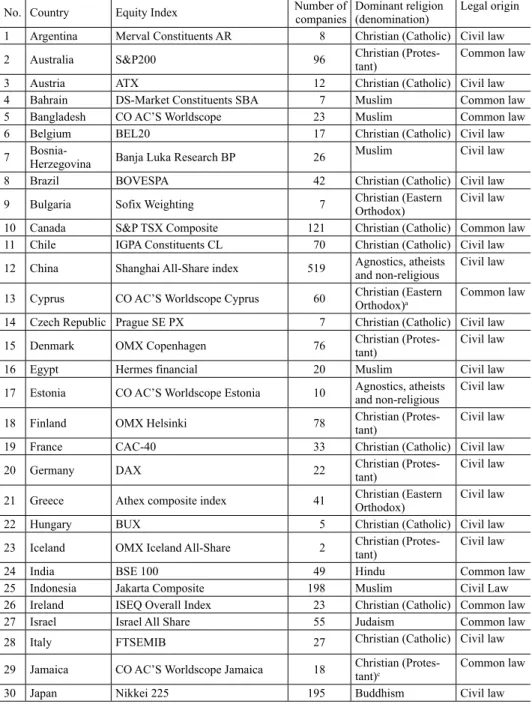
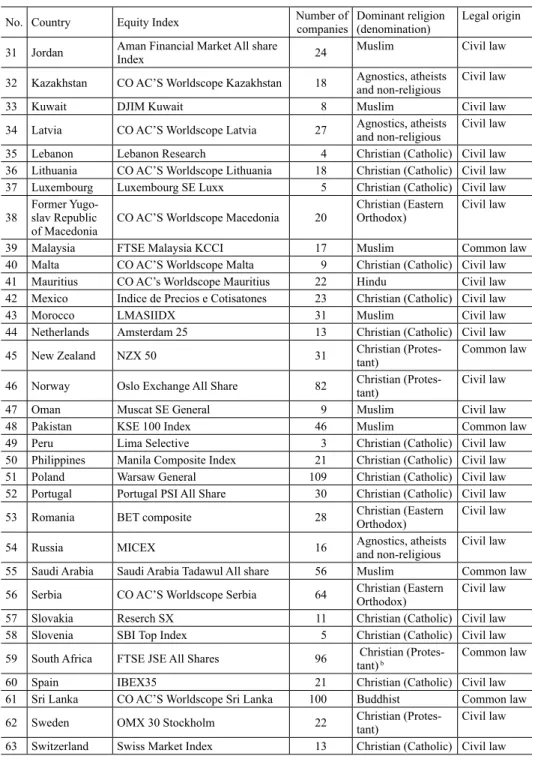
A second set of reliability filters was then imposed on the database to avoid misreporting. We excluded companies for which total assets were reported to be lower than property, plant and equipment, current assets or total shareholders’ eq- uity and firms reporting current assets inferior to inventories. To increase the reli- ability of our results, we also winsorised the extreme 2.5% of the series of debt ratios, profitability ratios, Price-to-Book ratios, tangibility and size.9 We also ex- cluded the companies from countries for which, according to Barro – McCleary (2003a), the dominant religion was defined as “other religions” and “other east- ern religions”, as these categories are not included in our study.10 We eliminated Palestinian Territories because the database of La Porta et al. (2008) does not provide information regarding the legal origin of this territory. Thus, we obtained a final sample of 3530 companies from 74 countries for the period of 2005-2010 (see Table A1 in the Appendix).
The information regarding the major religions was gathered from the dataset of Barro – McCleary (2003a). In some cases, we used additional information from the Central Intelligence Agency’s (CIA) World Factbook, the Association of Religion Data Archives (www.thearda.com), and Stulz – Williamson (2003). For each country, the dominant religion is considered the religion having the highest number of adherents. We considered the per cent of the population affiliated with major religions/denominations: Catholic, Protestant11, Orthodox, Muslim, Hindu, Buddhist and Judaist. For countries where agnostics, atheists or non-religious people are prevalent, we create a special category, named “Agnostics, Atheists and non-religious”.
For data regarding the legal origin we used the database from La Porta et al. (2008), available on the Andrei Shleifer’s website12. Data regarding GDP are
9 Thus, to winsorise our samples (symmetrically) 2.5% times, we replaced each of the 2.5%
lowest and 2.5% highest observations by the values of their nearest neighbours (Dixon – Yuen 1974). Through the winsorising procedure, the extreme values are replaced with less extreme values, thus obtaining a more homogenous statistical population.
10 For this reason, we excluded from our database: Botswana, Ghana, Ivory Coast, Kenya, Re- public of Korea, and Tanzania (all of them with “other religions”) and also Hong Kong (with
“other eastern religions”).
11 In our study, we also included some denominations defined in Barro – McLeary (2003a) as
“other Christian religions”, if they were related to Protestantism.
12 See http://scholar.harvard.edu/shleifer/publications/economic-consequences-legal-origins
obtained from the World Bank database and gathered in millions USD/capita.
Corruption is measured through the Corruption Perception Index (CPI), provided by the Transparency International. The index is measured between 1 and 10, with greater values signifying a lower level of corruption.
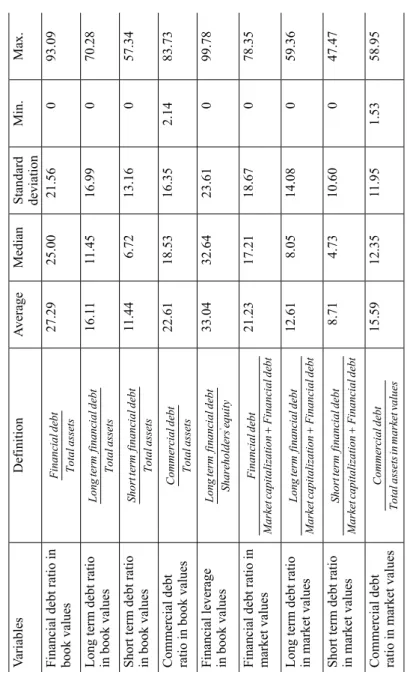
The formal definitions and some descriptive statistics regarding the indicators used for capital structure/leverage, using their book and market values are pre- sented in Table 1.
In the existing literature, these variables are commonly used as measures for capital structure.13 We agree to Sweeney et al. (1997: 17), who state that “studies using both types of data may well be more informative than those using only one type”. Sweeney et al. (1997) also emphasizes the superiority of market values.
However, the use of market values can be misleading as long as the companies from capital markets with a low level of market efficiency are included in the da- tabase. Moreover, in comparison with market values, book values are more stable and can better highlight the strategy of a company regarding its financing policy (see, for instance, a desirable, target-level for leverage, such as in De Miguel – Pindado 2001 and Lööf 2004).
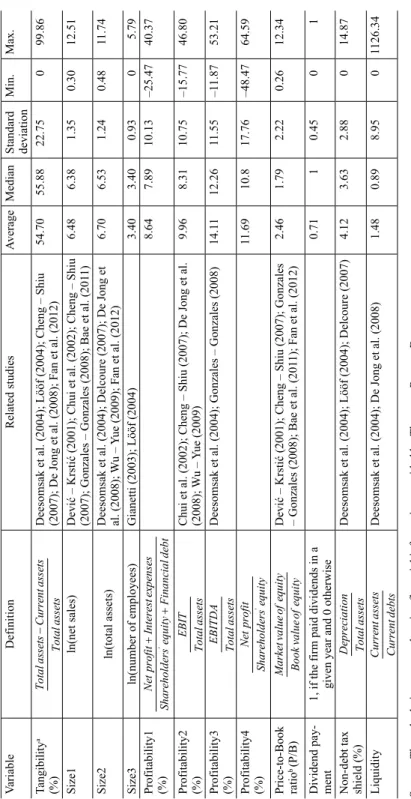
By the previous literature, in order to understand how company characteris- tics influence capital structure, assets tangibility, size of the firm, profitability, growth opportunities, liquidity, non-debt tax shields and dividend policy were considered. Table 2 reports some descriptive statistics of control variables (used as firm-specific determinants).
Previous studies have documented that capital structure is related to the legal origin, corruption and the wealth of the nations (De Jong et al. 2008; Fan et al.
2012). In this context, we use legal origin and the perception regarding corruption next to the dominant religion from each country as country-specific factors. We also control for the impact of general economic conditions measured through GDP per capita. Table A1 in the Appendix provides a detailed description of the vari- ables for religion and legal origin for all the countries included in our database.
We defined a dummy variable for the legal origin, which equals to 1 if the country has a common law system and 0 otherwise. We also defined seven dum- my variables for predominant religions/Christian denominations corresponding to each country from our sample:
13 It can be mentioned that the alternative measures, such as Total debt Equity
, can be easily derived from the first measure (Rajan – Zingales 1995; Reid 1996; Driffield et al. 2007, etc.).
Table 1. Definitions and some descriptive statistics of the variables used as dependent variables, % Variables DefinitionAverage Median Standard deviation Min. Max. Financial debt ratio in book values Financialdebt Totalassets27.2925.0021.56093.09 Long term debt ratio in book values Longtermfinancialdebt Totalassets16.1111.4516.99070.28 Short term debt ratio in book values Shorttermfinancialdebt Totalassets11.446.7213.16057.34 Commercial debt ratio in book valuesCommercialdebt Totalassets22.6118.5316.352.1483.73 Financial leverage in book values' Longtermfinancialdebt Shareholdersequity33.0432.6423.61099.78 Financial debt ratio in market values Financialdebt MarketcapitalizationFinancialdebt21.2317.2118.67078.35 Long term debt ratio in market values Longtermfinancialdebt MarketcapitalizationFinancialdebt12.618.0514.08059.36 Short term debt ratio in market values Shorttermfinancialdebt MarketcapitalizationFinancialdebt8.714.7310.60047.47 Commercial debt ratio in market values Commercialdebt Totalassetsinmarketvalues15.5912.3511.951.5358.95
Table 2. Description and summary statistics for financial variables VariableDefinitionRelated studiesAverageMedianStandard deviationMin.Max. Tangibilitya (%) TotalassetsCurrentassets TotalassetsDeesomsak et al. (2004); Lööf (2004); Cheng – Shiu (2007); De Jong et al. (2008); Fan et al. (2012)54.7055.8822.75099.86 Size1ln(net sales)Dević – Krstić (2001); Chui et al. (2002); Cheng – Shiu (2007); Gonzales – Gonzales (2008); Bae et al. (2011)6.486.381.350.3012.51 Size2 ln(total assets)Deesomsak et al. (2004); Delcoure (2007); De Jong et al. (2008); Wu – Yue (2009); Fan et al. (2012)6.706.531.240.4811.74 Size3ln(number of employees)Gianetti (2003); Lööf (2004)3.403.400.9305.79 Profitability1 (%)' NetprofitInterestexpenses ShareholdersequityFinancialdebt 8.647.8910.13–25.4740.37 Profitability2 (%)EBIT TotalassetsChui et al. (2002); Cheng – Shiu (2007); De Jong et al. (2008); Wu – Yue (2009)9.968.3110.75–15.7746.80 Profitability3 (%)EBITDA TotalassetsDeesomsak et al. (2004); Gonzales – Gonzales (2008) 14.1112.2611.55–11.8753.21 Profitability4 (%)'Netprofit Shareholdersequity11.6910.817.76–48.4764.59 Price-to-Book ratiob (P/B) Marketvalueofequity BookvalueofequityDević – Krstić (2001); Cheng – Shiu (2007); Gonzales – Gonzales (2008); Bae et al. (2011); Fan et al. (2012)2.461.792.220.2612.34 Dividend pay- ment1, if the firm paid dividends in a given year and 0 otherwise0.7110.4501 Non-debt tax shield (%)Depreciation TotalassetsDeesomsak et al. (2004); Lööf (2004); Delcoure (2007)4.123.632.88014.87 LiquidityCurrentassets CurrentdebtsDeesomsak et al. (2004); De Jong et al. (2008)1.480.898.9501126.34 Source: The calculations are made using financial information provided by Thomson Reuters Datastream. Notes:a We used this relation according to other studies, but we are aware that it is only a rough proxy for tangibility. On one hand, it includes (at the numerator), tangible assets, intangible fixed assets, but it does not include the inventories here. However, due to the purpose of our study, this impediment is not significant for the results. b Price-to-Book Ratio (P/B) can be considered as a proxy for market expectations. Market capitalization reflects the market value of the company, mainly based on the estimation of its future earnings. Also, the accounting perspective estimates the value of the company mainly based on the cost approach. In this context, the relationship between market expectations (higher expectations mean higher P/B ratio) and lenders expectations (a direct correlation between P/B ratio and leverage can mean trust in the future of the company) was analysed. Further, P/B ratio can be seriously biased if the market is less efficient (price is thus biased) or accounting has difficulties in some assets’ recording (see, for instance, high inflation).
1, 0,
j
if country j is majoritary Catholic Catholic
otherwise
d
1, 0,
j
if country j is majoritary Muslim Muslim
otherwise
d
1, 0,
j
if country j is majoritary Eastern Orthodox Eastern Orthodox
otherwise
d
1, 0,
j
if country j is majoritary Buddhist Buddhist
otherwise
d
1, ,
, j 0,
if country j is majoritary Agnostics atheists and non religious Agnostics atheists and non religious
otherwise
d
1, 0,
j
if country j is majoritary Hindu Hindu
otherwise
d
1, 0,
j
if country j is majoritary Judaic Judaic
otherwise
d
In our analysis, the companies in the predominantly Protestant countries were considered as the reference group. This decision is motivated by the fact that the influence of the Protestantism on capital structure decision has been studied far more than that of other religious denominations. As our main interest was to put in evidence the role of cultural factors, such as religion, we used a random effects procedure which deals with the time invariability of the cultural factors.
The reported results were corrected for autocorrelation in the residuals. The inde- pendent variables in the model were not allowed to have correlation coefficients higher than 0.3 in absolute values. The influence of the economic sectors was also taken into account. The industry dummies enhance the robustness of our results and confirm that the relation between religion/denomination and capital structure remains significant even when the economic sector is taken into account.
4. RESULTS
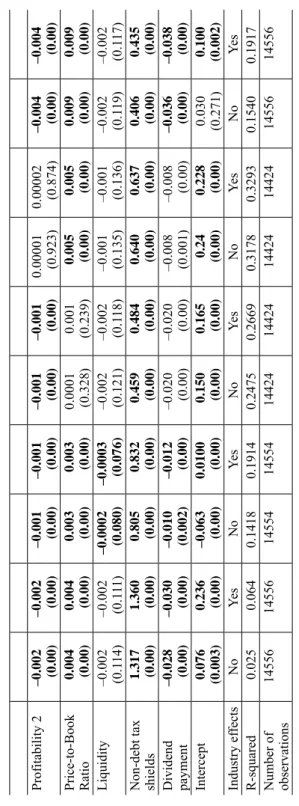
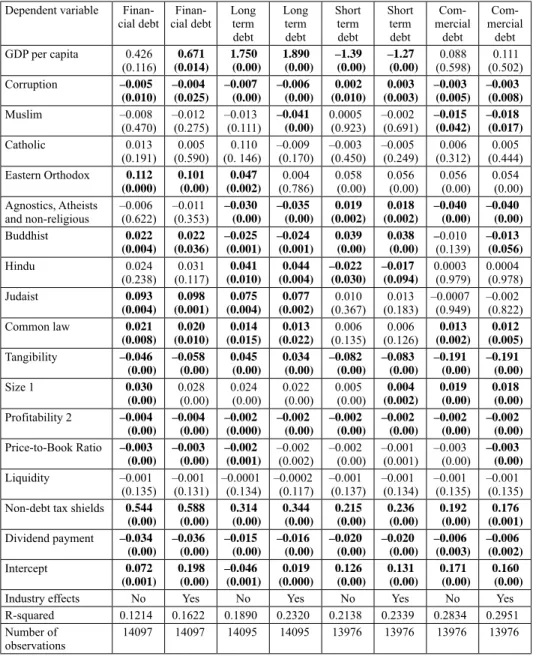
Table 3 and Table 4 present the relationships between leverage and different firm- specific and country-specific variables, including the socio-cultural ones (domi- nant religion, legal origin and corruption perception index), in book (Table 3) and in market values (Table 4). We conducted econometric analyses with and without industry dummies and obtained similar results, as listed below.
Our results may suggest an association between the debt-equity choice and the country-dominant religion or denomination. This can be related to the We- berian hypothesis of a strong relationship between the religious values and the economic behaviour (Weber 1934). Moreover, some differences are to be noticed
Table 3. Determinants of debt ratios in book values Dependent variableFinancial debtFinancial debtLong term debtLong term debtShort term debtShort term debtCommer- cial debtCommer- cial debtFinancial leverageFinancial leverage GDP per capita0.851 (0.008)1.14 (0.00)2.03 (0.00)2.20 (0.00)–1.37 (0.00)–1.24 (0.00)0.616 (0.003)0.629 (0.002)0.472 (0.179)0.822 (0.021) Corruption0.001 (0.541)–0.001 (0.769)–0.003 (0.077)–0.003 (0.094)0.002 (0.042)0.003 (0.015)–0.002 (0.067)–0.002 (0.062)0.0006 (0.808)0.001 (0.635) Muslim–0.005 (0.712)0.014 (0.536)–0.019 (0.063)–0.020 (0.057)0.004 (0.578)0.001 (0.875)–0.030 (0.001)–0.032 (0.001)–0.052 (0.001)–0.055 (0.00) Catholic0.033 (0.004)0.012 (0.034)0.024 (0.10)0.017 (0.059)–0.001 (0.863)–0.002 (0.600)–0.001 (0.888)–0.002 (0.816)0.023 (0.072)0.017 (0.188) Eastern Orthodox0.054 (0.008)0.041 (0.049)0.009 (0.548)–0.001 (0.928)0.035 (0.001)0.032 (0.001)–0.011 (0.310)–0.013 (0.229)0.057 (0.013)0.046 (0.050) Agnostics, Atheists and non-religious
0.080 (0.00)0.015 (0.00)–0.25 (0.022)–0.031 (0.004)0.091 (0.00)0.090 (0.00)0.005 (0.626)0.005 (0.605)0.035 (0.034)0.031 (0.054) Buddhist0.003 (0.824)–0.006 (0.683)–0.046 (0.00)–0.043 (0.00)0.036 (0.00)0.035 (0.00)–0.043 (0.00)–0.047 (0.00)–0.018 (0.200)–0.019 (0.162) Hindu0.040 (0.011)0.028 (0.044)0.053 (0.026)0.057 (0.012)–0.019 (0.11)–0.012 (0.306)0.054 (0.002)0.054 (0.002)–0.007 (0.823)0.005 (0.871) Judaist0.114 (0.003)0.122 (0.001)0.083 (0.009)0.087 (0.004)0.016 (0.191)0.021 (0.066)–0.013 (0.359)–0.016 (0.252)0.139 (0.001)0.146 (0.00) Common law0.001 (0.872)0.001 (0.891)–0.006 (0.396)–0.007 (0.312)0.005 (0.239)0.005 (0.191)0.004 (0.424)0.003 (0.532)0.015 (0.125)0.013 (0.189) Tangibility–0.141 (0.00)–0.156 (0.00)0.016 (0.081)0.002 (0.799)–0.138 (0.00)–0.140 (0.00)–0.315 (0.00)–0.315 (0.00)0.013 (0.256)0.004 (0.736) Size 10.031 (0.00)0.028 (0.00)0.025 (0.00)0.023 (0.00)0.005 (0.003)0.004 (0.019)0.018 (0.00)0.018 (0.00)0.055 (0.00)0.052 (0.00)
Profitability 2–0.002 (0.00)–0.002 (0.00)–0.001 (0.00)–0.001 (0.00)–0.001 (0.00)–0.001 (0.00)0.00001 (0.923)0.00002 (0.874)–0.004 (0.00)–0.004 (0.00) Price-to-Book Ratio0.004 (0.00)0.004 (0.00)0.003 (0.00)0.003 (0.00)0.0001 (0.328)0.001 (0.239)0.005 (0.00)0.005 (0.00)0.009 (0.00)0.009 (0.00) Liquidity–0.002 (0.114)–0.002 (0.111)–0.0002 (0.080)–0.0003 (0.076)–0.002 (0.121)–0.002 (0.118)–0.001 (0.135)–0.001 (0.136)–0.002 (0.119)–0.002 (0.117) Non-debt tax shields1.317 (0.00)1.360 (0.00)0.805 (0.00)0.832 (0.00)0.459 (0.00)0.484 (0.00)0.640 (0.00)0.637 (0.00)0.406 (0.00)0.435 (0.00) Dividend payment–0.028 (0.00)–0.030 (0.00)–0.010 (0.002)–0.012 (0.00)–0.020 (0.00)–0.020 (0.00)–0.008 (0.001)–0.008 (0.00)–0.036 (0.00)–0.038 (0.00) Intercept0.076 (0.003)0.236 (0.00)–0.063 (0.00)0.0100 (0.00)0.150 (0.00)0.165 (0.00)0.24 (0.00)0.228 (0.00)0.030 (0.271)0.100 (0.002) Industry effectsNoYesNoYesNoYesNoYesNoYes R-squared0.0250.0640.14180.19140.24750.26690.31780.32930.15400.1917 Number of observations14556145561455414554144241442414424144241455614556 Notes: p-values are given in brackets. Values in bold are statistically significant. All regressions include cross-section random effects. The results are similar for alternative measures of profitability and size.
Table 3.cont.
Table 4. Determinants of debt ratios in market values Dependent variable Finan-
cial debt Finan- cial debt
Long term debt
Long term debt
Short term debt
Short term debt
Com- mercial
debt
Com- mercial
debt GDP per capita 0.426
(0.116) 0.671 (0.014)
1.750 (0.00)
1.890 (0.00)
–1.39 (0.00)
–1.27 (0.00)
0.088
(0.598) 0.111 (0.502) Corruption –0.005
(0.010) –0.004
(0.025) –0.007
(0.00) –0.006
(0.00) 0.002 (0.010)
0.003 (0.003)
–0.003 (0.005)
–0.003 (0.008)
Muslim –0.008
(0.470) –0.012
(0.275) –0.013
(0.111) –0.041 (0.00)
0.0005 (0.923)
–0.002
(0.691) –0.015 (0.042)
–0.018 (0.017)
Catholic 0.013
(0.191) 0.005
(0.590) 0.110
(0. 146) –0.009
(0.170) –0.003
(0.450) –0.005
(0.249) 0.006
(0.312) 0.005 (0.444) Eastern Orthodox 0.112
(0.000) 0.101
(0.00) 0.047 (0.002)
0.004
(0.786) 0.058
(0.00) 0.056
(0.00) 0.056
(0.00) 0.054 (0.00) Agnostics, Atheists
and non-religious
–0.006 (0.622)
–0.011
(0.353) –0.030 (0.00)
–0.035 (0.00)
0.019 (0.002)
0.018 (0.002)
–0.040 (0.00)
–0.040 (0.00)
Buddhist 0.022
(0.004) 0.022 (0.036)
–0.025 (0.001)
–0.024 (0.001)
0.039 (0.00)
0.038 (0.00)
–0.010
(0.139) –0.013 (0.056)
Hindu 0.024
(0.238) 0.031
(0.117) 0.041 (0.010)
0.044 (0.004)
–0.022 (0.030)
–0.017 (0.094)
0.0003
(0.979) 0.0004 (0.978)
Judaist 0.093
(0.004) 0.098 (0.001)
0.075 (0.004)
0.077 (0.002)
0.010 (0.367)
0.013 (0.183)
–0.0007 (0.949)
–0.002 (0.822)
Common law 0.021
(0.008) 0.020 (0.010)
0.014 (0.015)
0.013 (0.022)
0.006
(0.135) 0.006
(0.126) 0.013 (0.002)
0.012 (0.005) Tangibility –0.046
(0.00) –0.058
(0.00) 0.045
(0.00) 0.034
(0.00) –0.082
(0.00) –0.083
(0.00) –0.191
(0.00) –0.191
(0.00)
Size 1 0.030
(0.00) 0.028
(0.00) 0.024
(0.00) 0.022
(0.00) 0.005
(0.00) 0.004 (0.002)
0.019 (0.00)
0.018 (0.00) Profitability 2 –0.004
(0.00) –0.004
(0.00) –0.002
(0.000) –0.002
(0.00) –0.002
(0.00) –0.002
(0.00) –0.002
(0.00) –0.002
(0.00) Price-to-Book Ratio –0.003
(0.00) –0.003
(0.00) –0.002
(0.001) –0.002
(0.002) –0.002
(0.00) –0.001
(0.001) –0.003
(0.00) –0.003 (0.00)
Liquidity –0.001
(0.135) –0.001
(0.131) –0.0001
(0.134) –0.0002 (0.117) –0.001
(0.137) –0.001
(0.134) –0.001
(0.135) –0.001 (0.135) Non-debt tax shields 0.544
(0.00) 0.588
(0.00) 0.314
(0.00) 0.344
(0.00) 0.215
(0.00) 0.236
(0.00) 0.192
(0.00) 0.176 (0.001) Dividend payment –0.034
(0.00) –0.036
(0.00) –0.015
(0.00) –0.016
(0.00) –0.020
(0.00) –0.020
(0.00) –0.006
(0.003) –0.006
(0.002)
Intercept 0.072
(0.001) 0.198
(0.00) –0.046
(0.001) 0.019 (0.000)
0.126 (0.00)
0.131 (0.00)
0.171 (0.00)
0.160 (0.00)
Industry effects No Yes No Yes No Yes No Yes
R-squared 0.1214 0.1622 0.1890 0.2320 0.2138 0.2339 0.2834 0.2951 Number of
observations
14097 14097 14095 14095 13976 13976 13976 13976
Notes: p-values are given in brackets. Values in bold are statistically significant. All regressions include cross- section random effects.
The results are similar for alternative measures of profitability and size.
also regarding the influence of religious characteristics of the society on corpo- rate debt maturity.
As expected, the Muslim religion is negatively correlated with all types of debt ratios: companies in the predominantly Islamic countries have lower debt ratios than those in the Protestant countries. Also, as expected, companies from the Catholic countries record higher total debt ratios measured in book values than those in the predominantly Protestant countries.
When considering book values for capital structure, in the Eastern Orthodox countries we noticed higher debt ratios than in the predominantly Protestant ones and a preference for short term debt compared to long term and commercial debt.
In light of the conclusions by Torgler (2006) that the predominantly Eastern Or- thodox countries are characterised by a lower tax morale and Arruñada (2010) that Protestants are more likely to trust others than the adherents to other reli- gions, the preference for short term financial debt can be explained by the con- jecture that in these societies there is a lower level of generalized trust that shapes the propensity of creditors towards closer maturities. Also, Schneider et al. (2015:
133) state that “countries dominated by Protestantism are associated with smaller shadow economies compared to Orthodox Christian countries, but also all other religious denominations seem to favour lower shadow economies compared to Orthodox Christianity”. In market based measures, the debt ratios are higher in the predominantly Eastern Orthodox countries than in the Protestant ones, and this tendency is mainly due to short term financial and commercial debt contracts.
The result is in line with our previous explanation regarding the lack of trust in these societies. Zheng et al. (2012) also consider that short term debt is used by creditors to limit their risk, their costs being lower in case of debtors’ bankruptcy and therefore is more often used in systems with high informational asymmetries.
In the same vein, Fan at al. (2012) put in evidence that the bank based financial systems and the countries with high level of perceived corruption are more prone to rely on short term debt.
The same pattern of high debt ratios generated mainly by the choice of short term debt is to be found for the predominantly “Agnostics, Atheists and non- religious” countries. In these countries, the long term debt ratios and commercial debt ratios tend to be lower than in the Protestant ones, while short term debt ratios are significantly higher. It can be noticed that all the countries defined as
“Agnostics, Atheists and non-religious” in our database were related to the Marx- ian ideology (former communist countries). The lack of trust can be a possible explanation in this case, too.
We also analysed three world religions that are less studied in the financial literature, namely Buddhism, Hinduism and Judaism. The results confirm our hy- pothesis that there is a role to play for religious values in the economic behaviour,