EXPLAINING GROWTH IN AFRICAN COUNTRIES – WHAT MATTERS?
José Augusto Lopes DA VEIGA – Alexandra FERREIRA-LOPES – Tiago NEVES SEQUEIRA – Marcelo SERRA SANTOS
(Received: 17 August 2017; revision received: 6 August 2018;
accepted: 8 January 2019)
In this paper we analyse the role of the traditional determinants of economic growth in the African countries in the period between 1950 and 2012. Due to the specifi city and the single nature of each one of these countries, methods that take into account observed and unobserved heterogeneity are used. Results highlight the relevance of the growth rate of the capital stock to growth in the short-run, which is signifi cant in all regressions. The growth rate of the government to GDP ratio is also impor- tant in all but one of the regressions in which it appears, and its growth is harmful for the growth of GDP per capita in the short-run. The variables related to public debt do not present any relationship with economic growth. Human capital has a positive relationship with economic growth in regres- sions that do not include public debt. The growth rate of real GDP per capita also depends (nega- tively) on its past value, i.e., the lower the real GDP per capita the higher will be its growth rate.
Keywords: economic growth, African countries, investment and capital stock, human capital, fi scal variables, observed and non-observed heterogeneity
JEL classifi cation indices: C23, C52, E62, H60, O11, O47
Alexandra Ferreira-Lopes and Tiago Neves Sequeira would like to thank the Portuguese National Sci- ence Foundation (FCT) and FEDER/COMPETE for funding, through projects UID/GES/00315/2013 and UID/ECO/04007/2013 (POCI-01-0145-FEDER-007659). The authors would also like to thank two anonymous referees for very useful suggestions. The usual disclaimer applies.
José Augusto Lopes Da Veiga, Lecturer at Universidade do Mindelo, Management and Economics Department, Mindelo, Cabo Verde, Portugal. E-mail: jose.lopes@uni-mindelo.edu.cv
Alexandra Ferreira-Lopes, corresponding author. Assistant Professor at the Instituto Universitário de Lisboa, ISCTE Business School Economics Department, Business Research Unit, Lisboa, Por- tugal, and CEFAGE-UBI. E-mail: alexandra.ferreira.lopes@iscte.pt
Tiago Neves Sequeira, Professor at the Faculdade de Economia, Universidade de Coimbra, E-mail:
sequeira@ubi.pt
Marcelo Serra Santos, Researcher at the Faculdade de Economia, Universidade de Coimbra. E- mail: marcelosantos@uc.pt
1. INTRODUCTION
Since the end of colonialism, the African countries struggle for the growth of their economies and for the increase of living standards of the population. The difficulties are enormous and the results have not been as per the expectation.
Most of the African economies are amongst the poorest of the world, despite their rich natural resource endowment, young and growing population and, of course, the large potential market of the whole continent. This is, in fact, a development paradox, which has been called as the “African Tragedy”.
Nevertheless, substantial changes and considerable improvement in Africa’s growth performance have begun with the new millennium. Most of the countries introduced deep changes through the adoption and implementation of reforms and improvement of macroeconomic management, such as greater fiscal discipline, privatisation, investments in infrastructures and in human capital, as well as the adherence to the democratic principles which have contributed to the reduction of conflicts, and, consequently, to the increase in stability. At the same time, the growing need of capital to support the enormous investments has led to the boom of public debt. Africa needs to find a new paradigm of growth grounded on a sus- tainable basis and capable to increase or maintain the rate of economic growth, creating resources to decrease poverty, inequality and unemployment. There is, however, a long way to go and the path differs across the countries.
The purpose of our paper is to analyse the determinants of economic growth in the African countries in the period between 1950 and 2012, such as public debt, capital stock, the government ratio, the investment ratio, the human capital index. Beyond these we applied two measures that proxy for the institutional environment of the countries, which contribute positively to improve the growth performance and social progress (Devarajan et al. 1996; Barro 1999; Calderón – Sérven 2008). Additionally, we add some originality in our econometric method, since we use recently developed methods for panel data, adapted from the time- series literature, which account for non-linearity and heterogeneity in the data (Eberhardt – Presbitero 2015), to empirically explain: (a) the long-run relation- ship between some determinants of growth and the economic growth and (b) the growth heterogeneity across the countries.
The rest of the paper is organised as follows: Section 2 reviews the existing theoretical and empirical literature on the determinants of economic growth, es- pecially focusing on the African continent. Section 3 identifies the data and the corresponding sources. In Section 4, we evaluate the data and identify the estima- tion techniques and methods. Sections 5 and 6 address the empirical results and the conclusions, respectively.
2. LITERATURE REVIEW
There are numerous studies that bring strong evidence that a large government sector negatively affects economic growth worldwide (e.g. Barro 1991; Engen – Skinner 1992; Hansson – Henrekson 1994; Gwartney et al. 1998; Fölster – Henrekson 2001). Egbetunde – Fasanya (2013) analyse the long-run and short- run relationships between public expenditure and economic growth in Nigeria and find the impact of total public spending on growth to be negative. In our paper, we use the government ratio (gov_ratio), defined as government consump- tion in percentage of GDP as a proxy for the size of the government.
Particularly on the public debt/growth nexus, e.g. Pattillo et al. (2002);
Clemens et al. (2003); Reinhart – Rogoff (2010a, 2010b); Vanlaer et al. (2015) and Eberhardt – Presbitero (2015) found different levels of negative correla- tions between them. Although the existing view, among policy makers at least, is that public debt is necessary to induce economic growth, particularly in poorer economies; in the last decade a growing discussion is being made by economists on the level of public debt above which economic growth is negatively affected (Reinhart – Rogoff 2010a,b and Panizza – Presbitero 2013). We use public debt per capita (pc_pub_debt) as a proxy for public debt.
The general idea that the stock of public capital and infrastructure will boost economic growth constitutes a prominent feature of government economic pro- grams across the world. The importance of infrastructure as an input of the capital stock and its relationship with economic growth is studied by Agénor – Moreno- Dodson (2006), who identified two main transmission channels: (1) the promo- tion of growth through private capital formation; and (2) crowding-out which is based on the idea that, in the short-run, an increase in public capital stocks may crowd-out private investment. Calderón – Sérven (2008) analysed the economic growth of about 100 developing countries between 1960 and 2005, using infra- structure growth and income inequality as explanatory variables. For the Sub- Saharan African (SSA) countries they concluded that there is a strong evidence that investment on infrastructure has a positive impact on economic growth. Us- ing a sample of 136 countries over the period of 1960–2005, Calderón (2008) found the impact on growth per capita caused by a faster accumulation of infra- structure stocks and a better quality of infrastructure services to be positive.
Boopen (2006) analysed the contribution of transport capital for economic growth for two different data sets: for a sample of the SSA countries and for the Small Island Developing States (SIDS), over the period of 1980–2000, using both cross sectional and panel data analysis. The author concluded, in both cases, that economic growth in Africa has been triggered by transport capital. Cheteni (2013) examined the impact of transport infrastructure investment and transport
sector productivity on the South African economic growth between 1975 and 2011. The results of this paper suggest that the real domestic gross fixed transport investment has a positive impact on economic growth and productivity.
Ghazanchyan – Stotsky (2013) used a panel data for 42 SSA countries, divided between the oil exporters and the non-oil exporting countries during the period of 1999–2011, in order to analyse the effect of some determinants of growth such as private and public investment, government consumption and the exchange rate.
Their results showed that the share of private investment in GDP is an impor- tant element for growth, specifically when the oil-exporting African countries are comprised in the sample. The authors also found some evidence of a positive effect of public investment on growth.
We define two variables that are related with investment and accumulation of physical capital to use in the estimations – capital stock per capita, that is the stock of physical capital divided by the population (pc_cap_stock), and the investment ratio, which is defined as gross capital formation divided by GDP (inv_ratio).
Human capital is usually defined as the workers’ acquisition of skills and know-how through education and training. Evidence from seminal empirical studies suggests that an educated population is a key determinant of growth (Barro – Sala-i-Martin 1995; Brunetti et al. 1998). However, Sacerdoti et al.
(1998) provide evidence that human capital does not appear to have a signifi- cant contribution to the economic growth of the West African countries, due to the inexistence of structural reforms. Kumar (2006) finds a negative impact of human capital investment and argues that it does not mean that the role of hu- man capital in the growth process of the African economies is marginal. Using the Generalized Methods of Moments (GMM) approach, Ndambiri et al. (2012) studied the determinants of economic growth in 19 SSA countries over the period of 1982–2000 and found that human capital is important for growth. Ahmed et al. (2013) investigate the impact of human capital on economic growth in Sudan for the period between 1982 and 2009, by using a simultaneous equation model that links human capital (school attainment), investment in education and health variables to economic growth, total productivity, foreign direct investment, and the human development index. The authors conclude that the quality of education has a positive role in economic growth. We use human capital index (hc_ind) as a proxy for human capital.
Institutional factors have also been discussed in literature. Hall – Jones (1996) conducted an empirical analysis and suggested that, in the long-run, a country’s economic performance is determined primarily by the institutions and government policies that create economic environment within individuals and firms to make investments, create and transfer ideas, and produce goods and services. Based on a cross-country regression, Sachs – Warmer (1997) analysed the sources of slow
economic growth in Sub-Saharan Africa, between 1950 and 1990. According to these authors, at par from the well-known causes of slow growth of the African economies, which also have relevance to other developing countries, namely, co- lonial legacy, geographical, natural and ethnic divisions, poor choices of economic policy are mainly responsible for the slow growth. Indicators of economic policy, such as the openness ratio, the market supporting institutions, government spend- ing and savings, have larger quantitative impacts. They also found that the SSA economies could have per capita growth at over 4% per year, with appropriate policies regardless of the natural constraints. Easterly – Levine (1997) argued that Africa’s poor growth and low level of per capita income are associated with low schooling, political instability, underdeveloped financial systems, distorted for- eign exchange markets, high government deficits, and insufficient infrastructure.
Tahari et al. (2004) examined the sources of growth in the SSA countries using the growth accounting framework and showed that during the period of 1960–2002 the Total Factor Productivity (TFP) had no significant influence on the average real GDP growth. To increase the performance of those economies, it needs a significant improvement in TFP as well as the investment/GDP ratio and also the consequent diversification of the economic base. The authors also defended the need to impede the regional conflicts in order to build the path of economic growth in a peaceful environment. Mathew – Adegboye (2014) applied econometric tech- niques, such as Panel Unit Root, Least Square Dummy Variables (LSDV) and GMM for the period of 1985–2012 on 30 selected SSA countries to examine the influence of trade openness and institutions on economic growth. Their main find- ings were: (1) Institutions had significant positive impact on economic growth;
(2) The significance of trade impact on economic growth was not relevant; and (3) The trade liberalisation through stronger institution should be a target.
In our research we use two very distinctive variables as proxies for institu- tional determinants: 1) a Weighted Conflict Index, a composite indicator of the number of assassinations, strikes, guerrilla warfare etc., and 2) the ratio of the value of the exchange rate in the black market and the official exchange rate value (BMERP).
3. SOURCES AND DATA
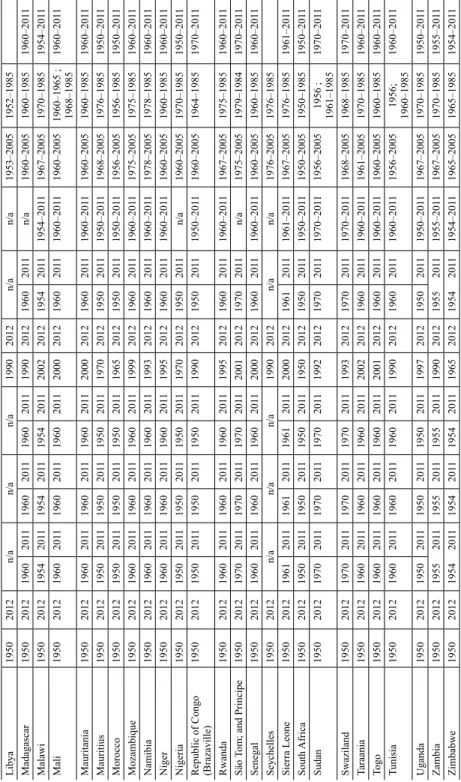
Our data set comprises 52 African countries from 1950 to 2012.1 The time period for each variable and each country can be found in Appendix, Table A1.
1 The African continent has 54 countries. The two countries that are excluded from our sample due to lack of data are South Sudan and Somalia.
rgdp_pc – stands for the Real Gross Domestic Product (GDP) per capita and represents the measurement of the total wealth of a country divided by the total population and adjusted for inflation. The source of the data are the Conference Board Total Economy Database and also the World Economic Outlook (WEO) from the World Bank, calculated in 1990 US$ (converted at Geary Khamis Purchasing Parity Power (PPPs)).
pc_pub_debt – is the entire stock of direct government fixed term contractu- al obligations to others, outstanding on a particular date divided by the total population. It includes domestic and foreign liabilities, such as currency and money deposits, securities, and other shares and loans. It is the gross amount of government liabilities reduced by the amount of equity and financial de- rivatives held by the government divided by the total population, i.e. public debt per capita. The source is the WEO from the World Bank.
The following variables are taken from the Penn World Tables, version 8.0 (Feenstra et al. 2015). The GDP values and the capital stocks were divided by the population to convert into per capita values.
rgdpe_pc_pwt – is expenditure-side real GDP per capita, calculated in 2005 US$ at chained (equivalent to constant prices) PPPs.
rgdp_pc_na_pwt – is real GDP per capita at constant (2005) national prices .
inv_ratio – is the share of output-based real GDP that is represented by gross capital formation (investment), at current PPPs.
gov_ratio – is the share of output-based real GDP that is represented by government consumption at current PPPs.
hc_ind – represents the human capital index, which is related to the average years of schooling and the returns to education.
pc_cap_stock – is capital stock per capita at constant 2005 national prices (in mil. 2005US$), total quantity of capital used in the production of goods and services, including factories, buildings, equipment, tools, and machin- ery divided by the total population.
We have also used the variables S18F2 and BMERP as proxies for the in- stitutional environment, taken from the Databanks International database. Their definitions are presented below:
Weighted Conflict Index (S18F2) – is calculated in the following manner:
Multiply the value of the number of Assassinations by 24, General Strikes by 43, Guerrilla Warfare by 46, Government Crises by 48, Purges by 86, Ri- ots by 102, Revolutions by 148, Anti-Government Demonstrations by 200.
Sum the 8 weighted values and divide by 9. The result is the value (with decimal) stored as the Weighted Conflict Index.
BMERP (S16F7/S16F6) – is the percentage difference between the black market rate for foreign currency and the pegged official exchange rate.
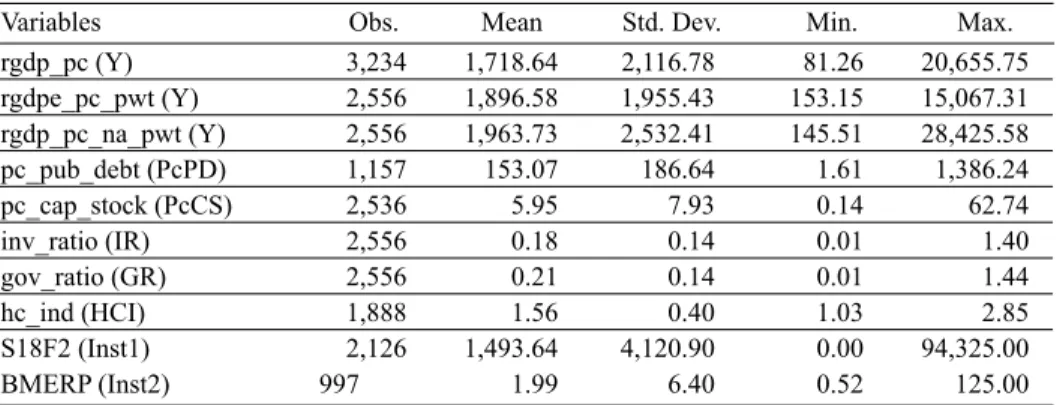
The descriptive statistics are incorporated in Table 1. The number of observa- tions is different for each variable; hence our panel is unbalanced.
Table 1. Descriptive statistics
Variables Obs. Mean Std. Dev. Min. Max.
rgdp_pc (Y) 3,234 1,718.64 2,116.78 81.26 20,655.75
rgdpe_pc_pwt (Y) 2,556 1,896.58 1,955.43 153.15 15,067.31 rgdp_pc_na_pwt (Y) 2,556 1,963.73 2,532.41 145.51 28,425.58
pc_pub_debt (PcPD) 1,157 153.07 186.64 1.61 1,386.24
pc_cap_stock (PcCS) 2,536 5.95 7.93 0.14 62.74
inv_ratio (IR) 2,556 0.18 0.14 0.01 1.40
gov_ratio (GR) 2,556 0.21 0.14 0.01 1.44
hc_ind (HCI) 1,888 1.56 0.40 1.03 2.85
S18F2 (Inst1) 2,126 1,493.64 4,120.90 0.00 94,325.00
BMERP (Inst2) 997 1.99 6.40 0.52 125.00
Notes: Due to the higher number of observations relative to the other two variables that represent GDP, we opted for rgdp_pc instead of rgdpe_pc_pwt or rgdp_pc_na_pwt for the regression estimations.
Due to data non-availability, many countries had data for public debt variable only after the year 2000, and also there are missing data for the human capital index. As these variables are considered relevant to growth regressions, the group of countries that presented longer time series is much shorter than the initial da- tabase. However, in the next section we still do the statistical tests for the entire data set.
4. ESTIMATION AND METHODS
This paper analyses the behaviour of economic growth in the African economies, based on the traditional determinants of economic growth. The specificity and the single nature of each one of these countries bring to the analysis the issue of observed and unobserved heterogeneity.
In the literature of growth regressions, initiated by Barro (1991), it is usual to apply both long-run determinants of economic growth, such as human capital, and short-run determinants, such as physical capital (economic growth models, e.g., à la Solow, physical capital has just transitional dynamics) and also policy variables, such as those linked with the public budget. Our baseline specification is as follows:
yit = αi + βiPcPDit + ˓iIRit + ˖ iGRit + φiPcCSit + δiHCIit + ΩiInst1it + ΨiInst2it +λ’i ft + εit
(1)
where yit is real GDP per capita, PcPDit is public debt per capita, IR is the invest- ment ratio, GR is the government ratio, PcCS is capital stock per capita, HCI represents the Human Capital Index, Inst1 represents the Weighted Conflict In- dex, and Inst2 represents the BMERP. The situational and non-observed variables that can globally affect all the African economies are considered as the common factors and they are presented as ft. αi is the country-specific intercepts, ˓ i is the country-specific coefficient related to the investment ratio, ˖ i is the country-spe- cific coefficient related to the government ratio, λ’i is the country specific factor loadings associated to the common factors, and εit is the stochastic error term.
The Common Correlated Effects (CCE) approach adopted in this research is, according to Eberhardt – Teal (2011) and Pesaran – Tosetti (2011), robust to non- stationary in both observables and non-observables variables and works well in the presence of weak and/or strong cross-sectional correlated errors. For estima- tion we use lagged/lead (3 years) and differentiated cross-sectional averages to augment the CCE method, following the statement by Chudik – Pesaran (2015) that CCE-type estimators once augmented with a sufficient number of lags/leads and cross-sectional averages perform well, even in the case of dynamic models with weakly exogenous regressors. Lagged/lead and differentiated cross-section- al averages are computed as the averages of all countries in the dataset for a specific year, which represent the cross-borders effects, i.e. the common effects affecting each country. Note that each country may be affected differently by these common effects, as the coefficients are country-specific. This model takes heterogeneity into account, since, contrary to what happens in more standard econometric models, parameters are country-specific and then ‘averaged’ to ob- tain a single coefficient. We apply an error correction-model (ECM) representa- tion of the equation (1) to take into consideration the time series properties and dynamics in macro panels. The ECM allows us to distinguish between the short- and the long-run.2 Additionally, our method also takes into account the fact that the dataset is an unbalanced panel.
2 Our estimated equation is the ECM version of the specification of equation (1). The ECM version has both lagged levels and first difference variables, being the first one interpreted as the long-run effects and the latter as the short-run effects. It is also important to mention that we consider the first difference of the variable as the dependent variable, such as the first difference of the log of GDP per capita is the growth rate of GDP per capita. We have just streamlined the presentation to save space, since the transformation of levels equation as our equation (1) to its ECM version is well described in the econometric literature cited in our paper.
4.1. Cross-section dependence and stationarity tests
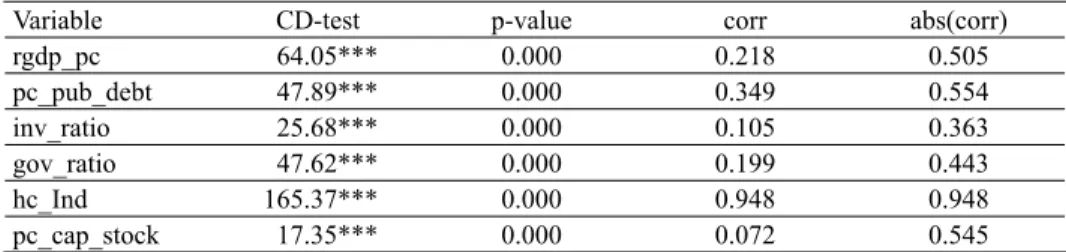
Interdependencies between the African economies may occur after common shocks with a heterogeneous impact across the countries. We apply the Pesaran (2004) null hypothesis to test for no cross-section dependence across panel mem- bers. The results of the test are presented in Table 2.
Table 2. Cross-section dependence test
Variable CD-test p-value corr abs(corr)
rgdp_pc 64.05*** 0.000 0.218 0.505
pc_pub_debt 47.89*** 0.000 0.349 0.554
inv_ratio 25.68*** 0.000 0.105 0.363
gov_ratio 47.62*** 0.000 0.199 0.443
hc_Ind 165.37*** 0.000 0.948 0.948
pc_cap_stock 17.35*** 0.000 0.072 0.545
Notes: Level of significance: *** for p-value < 0.01. Null hypothesis: There is no cross-sectional dependence between the variables.
The Pesaran (2004) CD test assumes significant values between 17.35 and 165.37 for the capital stock per capita and the human capital index, respectively.
There is evidence of cross-sectional dependence (CSD) between the panel mem- bers. Empirically it shows that any structural shock that occurs in one of the panel members (country) will affect positively or negatively the remaining countries.
An empirical work based on time series assumes, necessarily, a long-run sta- tionarity of the series, avoiding the non-stationarity, which invalidates the classi- cal econometric assumptions and generates spurious relations between the series.
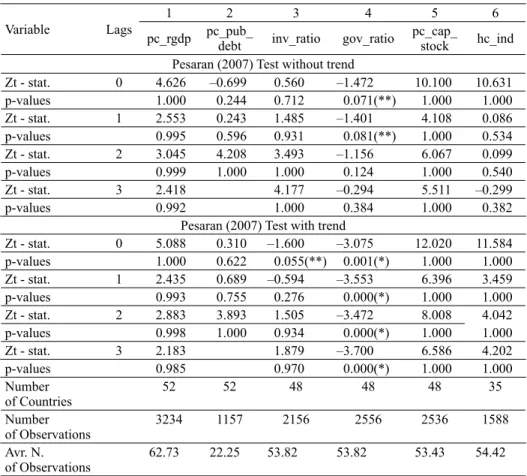
As explained by Gujarati (2008) “a variable is stationary if its mean and variance are constant over time and the covariance value between two time periods de- pends only on the distance between them, and not on the effective time period in which the covariance is calculated”. The stationarity of the time series is used to test the presence of a unit root. In this study, we also use a second generation panel unit root test developed by Pesaran (2007), also known as the Pesaran CIPS test, with and without trend, and considering three lags. In this test, we assume the null hypothesis as that every individual time series has a unit root and is there- fore non-stationary, whereas the alternative hypothesis is that the time series is stationary. Table 3 below shows the results of this test.
Results show that in general all variables are non-stationary. The p-values for the Zt statistics for all three lags do not reject the null hypothesis (in levels) as they are very high. The panel unit root test for public debt per capita is determined
only for two lags, due to the insufficient number of observations required for the CIPS test with three lags. The non-stationary issue will be corrected by the ECM regressions.
4.2. Cointegration
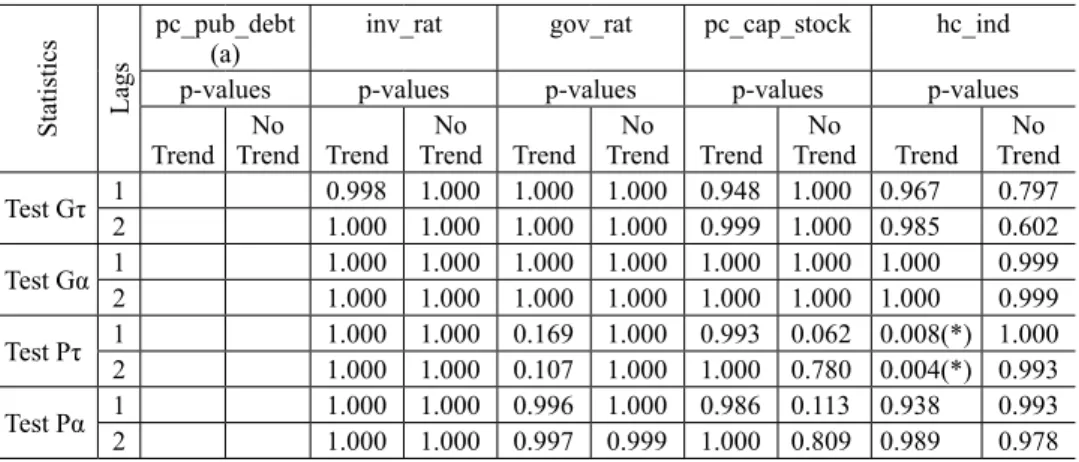
In order to test the long-run relationship between the variables included in the esti- mations, we use a second generation panel co-integration test developed by West- erlund (2007) which provides four test statistics: Gτ, Gα, Pτ and Pα, described below. The co-integration test is made for the relationship between real GDP per
Table 3. Panel Unit Root Test
Variable Lags
1 2 3 4 5 6
pc_rgdp pc_pub_
debt inv_ratio gov_ratio pc_cap_
stock hc_ind Pesaran (2007) Test without trend
Zt - stat. 0 4.626 –0.699 0.560 –1.472 10.100 10.631
p-values 1.000 0.244 0.712 0.071(**) 1.000 1.000
Zt - stat. 1 2.553 0.243 1.485 –1.401 4.108 0.086
p-values 0.995 0.596 0.931 0.081(**) 1.000 0.534
Zt - stat. 2 3.045 4.208 3.493 –1.156 6.067 0.099
p-values 0.999 1.000 1.000 0.124 1.000 0.540
Zt - stat. 3 2.418 4.177 –0.294 5.511 –0.299
p-values 0.992 1.000 0.384 1.000 0.382
Pesaran (2007) Test with trend
Zt - stat. 0 5.088 0.310 –1.600 –3.075 12.020 11.584
p-values 1.000 0.622 0.055(**) 0.001(*) 1.000 1.000
Zt - stat. 1 2.435 0.689 –0.594 –3.553 6.396 3.459
p-values 0.993 0.755 0.276 0.000(*) 1.000 1.000
Zt - stat. 2 2.883 3.893 1.505 –3.472 8.008 4.042
p-values 0.998 1.000 0.934 0.000(*) 1.000 1.000
Zt - stat. 3 2.183 1.879 –3.700 6.586 4.202
p-values 0.985 0.970 0.000(*) 1.000 1.000
Number
of Countries 52 52 48 48 48 35
Number
of Observations 3234 1157 2156 2556 2536 1588
Avr. N.
of Observations 62.73 22.25 53.82 53.82 53.43 54.42
Notes: Null hypothesis: The time series are non-stationary. Levels of significance: (**) at 5% significance level and (*) at 10% significance level. The remaining time series are non-stationary. The CIPS test assumes that the cross-section dependence is in the form of a single unobserved common factor.
capita with the following variables: public debt per capita, the investment ratio, the government ratio, capital stock per capita, and the human capital index.3
The four tests determine whether there is an error correction for individual panel members or for the panel as a whole. The G and G statistics test for co- integration of at least one of the countries, and the P and P statistics perform the test for the whole panel. In other words, the Gτ and Gα test statistics test the null hypothesis of no co-integration for all cross-sectional units against the alter- native that there is co-integration for at least one cross-sectional unit (i.e. H0 : ρi
= 0 for all i versus H1: ρi < 0 for at least one i). Rejection of the null should, there- fore, be taken as evidence of co-integration of at least one of the cross-sectional units. The Pτ and Pα test statistics pool information over all the cross-sectional units to test the null of no co-integration for all cross-sectional units against the alternative of co-integration for all cross-sectional units (i.e. H0: ρi = 0 versus H1: ρi = ρ < 0 for all i). Rejection of the null should therefore be taken as evidence of co-integration for the panel as a whole.
Table 4. Westerlund (2007) Panel Cointegration Test
Statistics Lags
pc_pub_debt
(a) inv_rat gov_rat pc_cap_stock hc_ind
p-values p-values p-values p-values p-values
Trend No
Trend Trend No
Trend Trend No
Trend Trend No
Trend Trend No Trend Test Gτ 1 0.998 1.000 1.000 1.000 0.948 1.000 0.967 0.797
2 1.000 1.000 1.000 1.000 0.999 1.000 0.985 0.602
Test Gα 1 1.000 1.000 1.000 1.000 1.000 1.000 1.000 0.999
2 1.000 1.000 1.000 1.000 1.000 1.000 1.000 0.999
Test Pτ 1 1.000 1.000 0.169 1.000 0.993 0.062 0.008(*) 1.000 2 1.000 1.000 0.107 1.000 1.000 0.780 0.004(*) 0.993 Test Pα 1 1.000 1.000 0.996 1.000 0.986 0.113 0.938 0.993
2 1.000 1.000 0.997 0.999 1.000 0.809 0.989 0.978
Notes: Time series is not continuous. Null hypothesis: There is no co-integration between the variables.
Level of significance: (*) for p < 0.01.
The results summarised in Table 4 suggest that the no co-integration hypoth- esis cannot be rejected both for the panel as a whole (Pτ and Pα), and for the group-mean tests (G and G ). Some exception is made for human capital index with trend for which the null hypothesis can be rejected in lags 1 and 2, at 5%
significance level for the whole panel.
3 Regarding public debt per capita, the test could not be done due to insufficient number of observations.
5. EMPIRICAL RESULTS
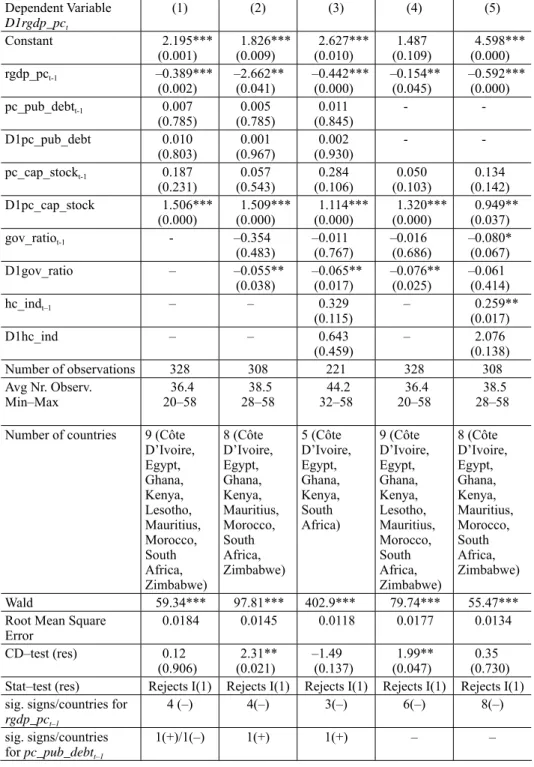
We run a set of growth regressions having D1rgdp_pc as the dependent variable, which is the change in real GDP per capita, i.e., the growth rate of real GDP per capita. Our best estimates are presented in Table 5.4 All the regressions pass the Wald test for joint significance at 1% level. On the other hand, in all regressions presented in Table 5, we note that the values of the Root Mean Squared Error are very low, lying between 0.0118 and 0.0184, meaning that the deviation is small.
In each column, we have also identified the countries used in the estimations.
Results for the African countries specified in Table 5 highlight the relevance of the growth rate of the capital stock (D1pc_cap_stock) to economic growth, in the short-run, which is significant in all regressions. This is in line with the find- ings by Calderón – Sérven (2008) and Calderón (2008) who noted that physical capital accumulation was a fundamental determinant of economic growth for the SSA countries. The growth rate of the government ratio (D1gov_ratio) in the short-run is also important in all but one of the regressions in which the variable is included, and we find that its growth is harmful for economic growth. For the long-run, it also exhibits a negative relationship, but only for regression (5) in Table 5. On the other hand, variables related to the public debt do not present any relationship with economic growth. Human capital, in the long-run, has a positive relationship with economic growth in regressions that do not include public debt.
The growth rate of real GDP per capita depends (negatively) on its past value, i.e., the lower the real GDP per capita the higher will be its growth rate.
The variability of effects across countries can be observed by the count of significant (positive or negative) effects in Table 5. While the results for real GDP per capita in the previous period and the growth rate of the capital stock per capita remain very consistent, variables like the government ratio and human capital present significant positive and negative coefficients, indicating a great irregularity between these variables and the growth rate of real GDP per capita between countries.
6. CONCLUSIONS
Using growth regression techniques, we empirically assessed the determinants of economic growth in the African economies over the period of 1950 to 2012.
4 We have tried estimations using the investment to GDP ratio and also the two proxies for in- stitutions, S18F2 and BMERP, but they were not significant. We selected the best estimations concerning the cross-correlations tests.
Table 5. Growth regressions Dependent Variable
D1rgdp_pct
(1) (2) (3) (4) (5)
Constant 2.195***
(0.001) 1.826***
(0.009) 2.627***
(0.010) 1.487
(0.109) 4.598***
(0.000)
rgdp_pct-1 –0.389***
(0.002) –2.662**
(0.041) –0.442***
(0.000) –0.154**
(0.045) –0.592***
(0.000) pc_pub_debtt-1 0.007
(0.785) 0.005
(0.785) 0.011
(0.845) - -
D1pc_pub_debt 0.010
(0.803) 0.001
(0.967) 0.002
(0.930) - -
pc_cap_stockt-1 0.187
(0.231) 0.057
(0.543) 0.284
(0.106) 0.050
(0.103) 0.134 (0.142)
D1pc_cap_stock 1.506***
(0.000) 1.509***
(0.000) 1.114***
(0.000) 1.320***
(0.000) 0.949**
(0.037)
gov_ratiot-1 - –0.354
(0.483) –0.011
(0.767) –0.016
(0.686) –0.080*
(0.067)
D1gov_ratio – –0.055**
(0.038) –0.065**
(0.017) –0.076**
(0.025) –0.061 (0.414)
hc_indt–1 – – 0.329
(0.115) – 0.259**
(0.017)
D1hc_ind – – 0.643
(0.459) – 2.076
(0.138)
Number of observations 328 308 221 328 308
Avg Nr. Observ.
Min–Max 36.4
20–58 38.5
28–58 44.2
32–58 36.4
20–58 38.5
28–58 Number of countries 9 (Côte
D’Ivoire, Egypt, Ghana, Kenya, Lesotho, Mauritius, Morocco, South Africa, Zimbabwe)
8 (Côte D’Ivoire, Egypt, Ghana, Kenya, Mauritius, Morocco, South Africa, Zimbabwe)
5 (Côte D’Ivoire, Egypt, Ghana, Kenya, South Africa)
9 (Côte D’Ivoire, Egypt, Ghana, Kenya, Lesotho, Mauritius, Morocco, South Africa, Zimbabwe)
8 (Côte D’Ivoire, Egypt, Ghana, Kenya, Mauritius, Morocco, South Africa, Zimbabwe)
Wald 59.34*** 97.81*** 402.9*** 79.74*** 55.47***
Root Mean Square
Error 0.0184 0.0145 0.0118 0.0177 0.0134
CD–test (res) 0.12
(0.906) 2.31**
(0.021) –1.49
(0.137) 1.99**
(0.047) 0.35 (0.730) Stat–test (res) Rejects I(1) Rejects I(1) Rejects I(1) Rejects I(1) Rejects I(1) sig. signs/countries for
rgdp_pct–1
4 (–) 4(–) 3(–) 6(–) 8(–)
sig. signs/countries
for pc_pub_debtt–1 1(+)/1(–) 1(+) 1(+) – –
We found a positive impact of the growth rate of capital stock to economic growth in the short-run, which is significant in all regressions. The growth rate of the government to GDP ratio, in the short-run, is also important in all but one of the regressions, and its growth is found harmful for economic growth. Human capital is found to have a positive relationship with economic growth in the long- run, in cases when we do not include public debt in the regressions. Our results corroborate some of the empirical literature for the African countries. However, the cross-country impact of the government to GDP ratio and human capital on the growth rate (positive to some and negative to others) is not uniform, so appro- priate policies for one country may be seriously misguided in another. Concern- ing public debt, the result was not significant and therefore it had no impact on the economic growth of the African countries. The growth rate of real GDP per capita also depends (negatively) on its past value, i.e. the lower the real GDP per capita the higher will be its growth rate. We have also tested two proxies for in- stitutions, which did not deliver significant results. The investment to GDP ratio was also not significant.
Table 5. continued Dependent Variable
D1rgdp_pct
(1) (2) (3) (4) (5)
sig. signs/countries
for D1pc_pub_debt 2(+) 1(+) – – –
sig. signs/countries for pc_cap_stockt–1
4(+) 3(+)/1(–) 2(+) 3(+)/1(–) 3(+)/1(–) sig. signs/ countries
for D1pc_cap_stock 7(+) 6(+) 3(+) 7(+) 3(+)
sig. signs/ countries
for gov_ratiot–1 – 2(–) 1(–) 1(+)/3(–) 1(+)/2(–)
sig. signs/countries
for D1gov_ratio – 2(–) – 2(–) 1(+)/2(–)
sig. signs/countries
for hc_indt–1 – – – – 3(+)/1(–)
sig.signs /countries for
D1hc_ind – – – – 1(+)
Notes: Values between parentheses below coefficients are p-values from robust (clustered) standard errors.
Level of significance: *** for p-value<0.01; **for p-value<0.05; and * for p-value<0.1. Wald test is a joint significance test for the regressors. Regressions include three lags of lagged differences of cross-sectional aver- ages.
REFERENCES
Agénor, P. – Moreno-Dodson, B. (2006): Public Infrastructure and Growth: New Channels and Policy Implications. World Bank Policy Research Working Paper, No. 4064.
Ahmed, K. – Arabi, M. – Zakaria, S. – Abdalla, S. (2013): The Impact of Human Capital on Eco- nomic Growth: Empirical Evidence from Sudan. Research in World Economy, 4(2): 43–53.
Artelaris, P. – Arvanitidis, P. – Petrakos, G. (2007): Theoretical and Methodological Study on Dy- namic Growth Regions and Factors Explaining Their Growth Performance. Paper presented at the 2nd Workshop of DYNREG in Athens, 9–10 March.
Barro, R. J. (1991): Economic Growth in a Cross Section of Countries. Quarterly Journal of Eco- nomics, 106(2): 407–443.
Barro, R. J. (1999): Inequality, Growth, and Investment. NBER Working Paper, No. 7038.
Barro, R. J. – Sala-i-Martin, X. (1995): Economic Growth. New York: McGraw-Hill.
Boopen, S. (2006): Transport Infrastructure and Economic Growth: Evidence from Africa Using Dynamic Panel Estimates. The Empirical Economic Letters, 5(1): 37–52.
Brunetti, A. – Kisunko, G. – Weder, B. (1998): Credibility of Rules and Economic Growth: Evi- dence from a Worldwide Survey of the Private Sector. The World Bank Economic Review, 12(3):
353–384.
Calderón, C. (2008): Infrastructure and Growth in Africa. Africa Infrastructure Country Diagnostic Working Paper, No 3.
Calderón, C. – Sérven, L. (2008): Infrastructure and Economic Development in Sub-Saharan Af- rica. World Bank Policy Research Working Paper, No. 4712.
Cheteni, P. (2013): Transport Infrastructure Investment and Transport Sector Productivity on Eco- nomic Growth in South Africa (1975–2011). Mediterranean Journal of Social Sciences, 4(13):
761–772.
Chudik, A. – Pesaran, M. H. (2015): Panel Data Models with Weakly Exogenous Regressors. Jour- nal of Econometrics, 188(2): 393–420.
Clemens, B. – Bhattacharya, R. – Nguyen, T. Q. (2003): External Debt, Public Investment, and Growth in Low-Income Countries. IMF Working Paper, No. 03/249.
Devarajan, S. – Swaroop, V. – Zou, H. (1996): The Composition of Public Expenditure and Eco- nomic Growth. Journal of Monetary Economics, 37: 313–344.
Easterly, W. – Levine, R. (1997): Africa’s Growth Tragedy: Policies and Ethnic Divisions. The Quarterly Journal of Economics, 112(4): 1203–1250.
Eberhardt, M. – Presbitero, A. F. (2015): Public Debt and Growth: Heterogeneity and Non-Linear- ity. Journal of Internacional Economics, 97(1): 45–58.
Eberhardt, M. – Teal, F. (2011): Econometrics for Grumblers: A New Look at the Literature on Cross-Country Growth Empirics. Journal of Economic Surveys, 25(1): 109–155.
Egbetunde, T. – Fasanya, I. O. (2013): Public Expenditure and Economic Growth in Nigeria: Ev- idence from Auto-Regressive Distributed Lag Specifi cation. Zagreb International Review of Economics & Business, 16(1): 79–92.
Engen, E. M. – Skinner, J. (1992): Fiscal Policy and Economic Growth. NBER Working Paper, No.
4223.
Feenstra, R. C. – Inklaar, R. – Timmer, M. P. (2015): The Next Generation of the Penn World Table.
American Economic Review, 105(10): 3150–3182.
Fölster, S. – Henrekson, M. (2001): Growth Effects of Government Expenditure and Taxation in Rich Countries. European Economic Review, 45(8): 1501–1520.
Ghazanchyan, M. – Stotsky, J. G. (2013): Drivers of Growth: Evidence from Sub–Saharan African Countries. IMF Working Papers, No. 13/236.
Gómez-Puig, M. – Sosvilla-Rivero, S. (2018): Public Debt and Economic Growth: Further Evi- dence for the Euro Area. Acta Oeconomica, 68(2): 209–229.
Gujarati, D. N. (2008): Basic Econometrics. 5th Edition, McGraw-Hill.
Gwartney, J. – Holcombe, R. – Lawson, R. (1998): The Scope of Government and the Wealth of Nations. Cato Journal, 18(2): 163–190.
Hall, R. –Jones, C. I. (1996): The Productivity of Nations. NBER Working Paper, No. 5812.
Hansson, P. – Henrekson, M. (1994): A New Framework for Testing the Effect of Government Spending on Growth and Productivity. Public Choice, 81: 381–401.
Kumar, C. S. (2006): Human Capital and Growth Empirics. The Journal of Developing Areas, 40(1): 153–179.
Mathew, A. O. – Adegboye, B. F. (2014): Trade Openness, Institutions and Economic Growth in Sub-Saharan Africa. Developing Country Studies, 4(8): 18–30.
Ndambiri, H. K. – Ritho, C. – Ng’ang’a, S. I. – Kubowon, P. C. – Mairura, F. C. – Nyangweso, P. M. – Muiruri, E. M. – Cherotwo, F. H. (2012): Determinants of Economic Growth in Sub- Saharan Africa: A Panel Data Approach. International Journal of Economics and Management Sciences, 2: 18–24.
Panizza, U. – Presbitero, A. F. (2013): Public Debt and Economic Growth in Advanced Economies:
A Survey. Swiss Journal of Economics and Statistics, 149(2): 175–204.
Pattillo, C. – Poirson, H. – Ricci, L. (2002): External Debt and Growth. IMF Working Paper, No.
02/69.
Pesaran, M. H. (2004): General Diagnostic Tests for Cross Section Dependence in Panels. IZA Discussion Papers, No. 1240.
Pesaran, M. H. (2007): A Simple Panel Unit Root Test in the Presence of Cross-Section Depend- ence. Journal of Applied Econometrics, 22(2): 265–312.
Pesaran, M. H. – Tosetti, E. (2011): Large Panels with Common Factors and Spatial Correlations.
Journal of Econometrics, 161(2): 182–202.
Reinhart, C. M. – Rogoff, K. S. (2010a): Debt and Growth Revisited. MPRA Paper, No. 24376.
University Library of Munich, Germany.
Reinhart, C. M. – Rogoff, K. S. (2010b): Growth in a Time of Debt. American Economic Review Papers and Proceedings, 100(2): 573–578.
Sacerdoti, E. – Brunschwig, S. – Tang, J. (1998): The Impact of Human Capital on Growth: Evi- dence from West Africa. IMF Working Paper, No 98/162.
Sachs, D. J. – Warmer, M. A. (1997): Sources of Slow Growth in African Economies. Journal of African Economies, 6(3): 335–376.
Tahari, A. – Ghura, D. – Akitoby, B. – Aka, E. B. (2004): Sources of Growth in Sub–Saharan Africa.
IMF Working Paper, No. 04/176.
Vanlaer, W. – Marneffe, W. – Vereeck, L. – Vanovertveldt, J. (2015): Does Debt Predict Growth?
An Empirical Analysis of the Relationship between Total Debt and Economic Output. European Journal of Government and Economics, 4(2): 79–103.
Warner, A. M. (2014): Public Investment as an Engine of Growth. IMF Working Papers, No.
14/148.
Westerlund, J. (2007): Testing for Error Correction in Panel Data. Oxford Bulletin of Economics and Statistics, 69(6): 709–748.
Zhuang, J. – de Dios, E. – Lagman-Martin, A. (2010): Governance and Institutional Quality and the Links with Economic Growth and Income Inequality: With Special Reference to Developing Asia. Asian Development Bank Economics Working Paper Series, No 193.
APPENDIX Table A1.Time dimension of variables for each African country Countryrgdp pcrgdpe pc pwtrgdp pc na pwtInv ratiopc Pub DebtGov ratioHC IndS18F2BMERPpc Cap Stock Algéria19502012n/an/an/a19642012n/an/a1967–20041962–1985n/a Angola195020121970201119702011197020112000201219702011n/a1975–20051975–1977 ; 1982–19851970–2011 Benin1950201219592011195920111959201120002012195920111959–20111960–20051960–19851959–2011 Botswana1950201219602011196020111960201119982012196020111960–20111967–20051966–19851960–2011 Burkina Faso195020121959201119592011195920112002201219592011n/a1960–20051960–19851951–2011 Burundi1950201219602011196020111960201120002012196020111960 -20111967–20051971–19851960–2011 Cameroon1950201219602011196020111960201120002012196020111960–20111960–20051960–19851960–2011 Cape Verde195020121960201119602011196020112002201219602011n/a1975–20051979–19841960–2011 Central African Re- public1950201219602011196020111960201120002012196020111960–20111960–20051960–19851960–2011 Chad1950201219602011196020111960201119992012196020111960–20111960–20051960–19851960–2011 Comoros Islands195020121960201119602011196020112000201219602011n/a1975–20051975–19851960–2011 Cote d'Ivoire1950201219602011196020111960201119802012196020111960–20111960–20051960–19851960–2011 Democratic Republic of Congo (Kinshasa)1950201219602011196020111960201120002012196020111960–20111960–20051960–19851960–2011 Djibouti195020121960201119602011196020112003201219602011n/a1978–20051977–19851970–2011 Egypt1950201219502011195020111950201119702012195020111950 -20111953–20051951–19851950–2011 Equatorial Guinea195020121960201119602011196020111980201219602011n/a1968–20051968–19691960–2011 Eritrea19502012n/an/an/a20002012n/an/an/an/an/a Ethiopia195020121950201119502011195020111992201219502011n/a1950–20051970–19851960–2011 Gabon1950201219602011196020111960201119902012196020111960–20111960–20051960–19851960–2011 Gambia1950201219602011196020111960201120002012196020111960–20111967–20051976–19851960–2011 Ghana1950201219552011195520111955201119522012195520111955–20111960–20051962–19851955–2011 Guinea195020121959201119592011195920111990201219592011n/a1960–20131970–19851959–2011 Guinea Bissau195020121960201119602011196020112000201219602011n/a1975–20051976–19841960–2011 Kenya1950201219502011195020111950201119602012195020111950–20111967–20051970–19851950–2011 Lesotho1950201219602011196020111960201119882012196020111960–20111967–20051966–19851960–2011 Liberia1950201219642011196420111964201120002012196420111964–20111950–20051950–19851964–2011