Glioblastoma adaptation traced through decline of an IDH1 clonal driver and macro-evolution of a double-minute chromosome
F. Favero
1,2,†, N. McGranahan
1,3,†, M. Salm
1,†, N. J. Birkbak
1,4,†, J. Z. Sanborn
5, S. C. Benz
5,
J. Becq
6, J. F. Peden
6, Z. Kingsbury
6, R. J. Grocok
6, S. Humphray
6, D. Bentley
6, B. Spencer-Dene
1, A. Gutteridge
4, M. Brada
7,8, S. Roger
9, P.-Y. Dietrich
10, T. Forshew
4, M. Gerlinger
1,11, A. Rowan
1, G. Stamp
1, A. C. Eklund
2, Z. Szallasi
2,12,13& C. Swanton
1,4*
1Cancer Research UK London Research Institute, London, United Kingdom;2Department of Systems Biology, Center for Biological Sequence Analysis, Technical University of Denmark, Lyngby, Denmark;3Centre for Mathematics and Physics in the Life Sciences and Experimental Biology (CoMPLEX), University College London, London;4University College London Cancer Institute, London, United Kingdom;5NantOmics, LLC, Santa Cruz, USA;6Illumina Ltd, Cambridge;7Department of Molecular and Clinical Cancer Medicine, University of Liverpool, Liverpool;8Department of Radiation Oncology, Clatterbridge Cancer Centre NHS Foundation Trust, Bebington, United Kingdom;9Department of Oncology, University Hospital Zurich, Zürich;10Centre of Oncology, University Hospitals of Geneva, Geneva, Switzerland;11Centre for Evolution and Cancer, The Institute of Cancer Research, London, United Kingdom;12Children’s Hospital Informatics Program at the Harvard-MIT Division of Health Sciences and Technology (CHIP@HST), Harvard Medical School, Boston, USA;13MTA-SE NAP, Brain Metastasis Research Group, Hungarian Academy of Sciences, 2nd Department of Pathology, Semmelweis University, Budapest, Hungary
Received 8 December 2014; revised 16 February 2015; accepted 23 February 2015
Background:Glioblastoma (GBM) is the most common malignant brain cancer occurring in adults, and is associated with dismal outcome and few therapeutic options. GBM has been shown to predominantly disrupt three core pathways through somatic aberrations, rendering it ideal for precision medicine approaches.
Methods:We describe a 35-year-old female patient with recurrent GBM following surgical removal of the primary tumour, adjuvant treatment with temozolomide and a 3-year disease-free period. Rapid whole-genome sequencing (WGS) of three separate tumour regions at recurrence was carried out and interpreted relative to WGS of two regions of the primary tumour.
Results:We found extensive mutational and copy-number heterogeneity within the primary tumour. We identified a TP53mutation and two focal amplifications involvingPDGFRA,KITandCDK4, on chromosomes 4 and 12. A clonalIDH1 R132H mutation in the primary, a known GBM driver event, was detectable at only very low frequency in the recurrent tumour. After sub-clonal diversification, evidence was found for a whole-genome doubling event and a translocation between the amplified regions ofPDGFRA,KITandCDK4, encoded within a double-minute chromosome also incorpor- ating miR26a-2. The WGS analysis uncovered progressive evolution of the double-minute chromosome converging on theKIT/PDGFRA/PI3K/mTORaxis, superseding theIDH1mutation in dominance in a mutually exclusive manner at recur- rence, consequently the patient was treated with imatinib. Despite rapid sequencing and cancer genome-guided therapy against amplified oncogenes, the disease progressed, and the patient died shortly after.
Conclusion:This case sheds light on the dynamic evolution of a GBM tumour, defining the origins of the lethal sub- clone, the macro-evolutionary genomic events dominating the disease at recurrence and the loss of a clonal driver. Even in the era of rapid WGS analysis, cases such as this illustrate the significant hurdles for precision medicine success.
Key words:glioblastoma, multi-region sequencing, intra-tumour heterogeneity, double minute chromosome
introduction
Glioblastoma (GBM) is the most common malignant brain cancer occurring in adults and is associated with poor prognosis and a median overall survival of only 15 months [1]. Nearly all
†These authors contributed equally to this work.
*Correspondence to:Prof. Charles Swanton, Cancer Research UK London Research Institute, 44 Lincoln’s Inn Fields, London WC2A 3LY, United Kingdom. Tel: +44-207- 269-3463; Fax: +44-207-269-3094; E-mail: charles.swanton@cancer.org.uk
originalarticles
© The Author 2015. Published by Oxford University Press on behalf of the European Society for Medical Oncology.
This is an Open Access article distributed under the terms of the Creative Commons Attribution Non-Commercial License (http://creativecommons.org/licenses/by-nc/4.0/), which permits non-commercial re-use, distribution, and reproduction in any medium, provided the original work is properly cited. For commercial re-use, please contact journals.permissions@oup.com
GBM tumours recur after surgery, radiotherapy and chemother- apy, with a median time to recurrence of 7 months [1].
Accumulating evidence suggests that treatment failure in cancer may be driven by intra-tumour heterogeneity (ITH), and branched tumour evolution involving genetically distinct sub- clones [2]. Recent studies have documented widespread ITH in GBM. Sottoriva et al. [3] found that each individual tumour can harbour multiple distinct copy-number profiles and transcrip- tomic subtypes simultaneously. Johnson et al. [2] revealed spatial and temporal heterogeneity in GBM, confirmed the importance ofTP53andIDH1as early driver mutations [4,5], and demon- strated the impact of temozolomide (TMZ) treatment on tumour evolution, with 6 of 10 tumours showing evidence of TMZ- induced hypermutation at recurrence.
In order to fully assess ITH within the life history of a single tumour and attempt to offer the patient a cancer genome- guided therapy, we implemented rapid multi-region whole- genome sequencing (WGS) in a patient with recurrent GBM.
This analysis reveals the temporal and spatial evolution of a GBM tumour, defining the origins of the lethal sub-clone from a sub-clone in the primary tumour and the associated macro- evolutionary genomic events dominating the disease at recur- rence, confounding treatment success.
methods
ethics
Written informed consent was obtained from the patient in the Hospitaux Universitaires de Geneve‘Analyse de la reponse immunologique contre les tumeurs cerebrales’translational approved protocol IRB 03-126. Tumour material was analysed under the UCL-Cancer Institute and Pathology biobank (UCLHRTB 10/H1306/42). The patient provided written informed consent to tumour sequencing analysis within a compassionate setting. The study was conducted according to the provisions of the Declaration of Helsinki and the Good Clinical Practice Guidelines of the International Conference on Harmonization.
WGS data processing and analysis
WGS was carried out by Illumina, UK. Mutation calling andfiltering was carried out using VarScan2 as described [6], annotation of coding mutations were carried out using ANNOVAR [7]. Structural variant (SV) breakpoint mechanism classification was carried out according to the criteria defined in Yang et al. [8]. Reconstruction of the putative double-minute chromosomes was carried out as described in Sanborn et al. [9] and breakpoints mapping to the focal amplifications were validated by PCR and Sanger Sequencing.
Copy-number variation (CNV) analysis was carried out on the WGS data.
Purity, ploidy and allele-specific copy-number estimates were obtained with Sequenza [10]. Clonal analysis was carried out as described in Bolli et al.
[11], estimating the cancer cell fraction (CCF) by integrating variant allele frequency estimates with copy number, purity and ploidy estimates. Single- sample and multi-sample Dirichlet process clustering was carried out using the DPpackage R package [12]. In this work, mutations are referred to as
‘sub-clonal’if their CCF indicates they are present in only a subset of cancer cells within a given sample (CCF <1). Mutations present in all cancer cells of a given sample (CCF∼1) are referred to as‘clonal’. Genome doubling (GD) was determined from the comparison of the sequencing of the grade II and the grade IV regions and by considering the mutations located in the portion of the genome where a clear doubling of the number of alleles was detected, see supplementary Information, available atAnnals of Oncology
online, for details. All data analysis was carried out in R version 3.0.2, all Pvalues are two sided.
results
clinical case report
A 35-year-old female presented with partial complex seizures in January 2007, increasing in frequency after the delivery of her second child in September 2007 (Figure1A). MRI carried out in June 2008, revealed a right temporal mass (6 × 6.7 × 4.5 cm) with slight contrast enhancement. She underwent complete removal of the tumour on 3 July 2008 and the diagnosis of WHO grade IV astrocytoma (GBM) was established (the tumour consisted of a grade II and grade IV histological components). She received con- comitant treatment with irradiation (60 Gy in 30 fractions) and TMZ, followed by 6 monthly cycles of TMZ (200 mg/m2D1–D5) until March 2009. She was free of symptoms for 2 years but partial seizures reappeared in early 2011. A further MRI showed a multi-focal recurrence in the right temporal area extending to the thalamus and the corpus callosum. Considering the long disease- free interval (3 years) between first treatment and recurrence, TMZ at a similar dose and schedule was prescribed again.
In March 2012, she presented with acute headache and intra- cranial hypertension. MRI showed massive progression mainly in the right frontal area with risk of herniation. She underwent partial removal of the tumour on 29 March 2012. The histology confirmed grade IV astrocytoma with MGMT gene promoter methylation. She received bevacizumab and TMZ; after transi- ent clinical improvement, her clinical condition deteriorated and TMZ was replaced by 800 mg imatinib daily, guided by the WGS data, sequenced and reported within 7 days by Illumina, indicating amplification ofKITandPDGFRA. The tumour pro- gressed rapidly on therapy and she died 3 months after the second surgical debulking procedure.
whole-genome sequencing
Archival formalin-fixed paraffin-embedded (FFPE) specimens of the grade II and IV primary samples along with three fresh- frozen samples from the recurrence and a germline reference were WGS to a depth of 30× (∼1.3 × 10⁶ paired reads per sample; supplementary Table S1 in supplementary Information, available atAnnals of Oncology online). The three recurrence regions were homogeneous at the SNV level indicating limited clonal variation in the recurrence; however, the SNV calling was hampered by stromal contamination (supplementary Table S1, available at Annals of Oncology online). The three recurrent regions, referred to as A1, A2 and A3, respectively, were merged in silicoin a single alignment file, termed As, to increase the resolution and improve the capacity to define the evolutionary trajectory of the recurrence specimen. 1271 and 1935 high- confidence somatic silent and non-silent SNVs were identified in the grade II and IV regions, respectively, and 1435 in the re- currence specimen. When comparing the grade II and grade IV to the recurrence, the grade IV shared 338 mutations with the recurrence not found in the grade II region, while the grade II only shared one mutation with the recurrence not found in the grade IV region (Figure1B, coding mutations only in supple- mentary Figure S1, available at Annals of Oncology online,
Volume 26 | No. 5 | May 2015 doi:10.1093/annonc/mdv127 |
Annals of Oncology
original articles
detailed mutation information in supplementary File, available at Annals of Oncology online). Given that the grade II region exhibited fewer private mutations (69/1271, Figure1B and C), this indicates that it most closely resembles the most recent common ancestor, and that the recurrence specimen evolved from the grade IV region.
extensive mutational variation found between grade II and grade IV regions
Several clonal mutations were found in both primary lesions suggesting a shared clonal origin. These include aTP53Y220C
mutation, a frame shift mutation in ATRX(K1871fs) and an IDH1 mutation, R132H. These genes have previously been described as driver events for GBM [4,13], andATRXmuta- tions has been shown to co-occur withTP53and IDH1muta- tions [2], and to be a driver of alternative telomere lengthening [14]. Clustering the mutation CCFs in the grade II and grade IV regions revealed six distinct clusters (Figure 1D). Most muta- tions were identified as clonal in both primary lesions or as clonal in one but missing from the other (clusters 1, 3 and 6).
However, we also found 202 mutations that were clonal in the grade IV but sub-clonal in the grade II (cluster 2), and two clus- ters of mutations (4 and 5) that were sub-clonal in the grade IV
Primary resection, source of Grade II & Grade IV First seizures
A
B C D
Diagnosis
January 2007
395
338 1032
170
68
Grade II Recurrence
Grade II CCF
Grade IV CCF
1
64 June
2008
Grade IV July 2008
FAM50A Clonal
cluster 3
AVILSLC4A1
BTN1A1 FAM50A SPEF2 TRAF7 TP53
LRP8 IDH1 EPHX2
NUF2 RP1 PYGL SLFN5UNC80RPSA RYR3
SHANK1 LAMA1DNAH1
MAGEC3 PITPNM2 ATP10D
cluster 2 cluster 1
cluster 4
cluster 5
cluster 6 Subclonal
1
0.5
0
0 0.5 1
67 32
142
916 202
437
Grade II Grade IV
Recurrence
ATRX LAMA1 TP53 TRAF7 RYR3 RP1 EPHX2 BTN1A1 SPEF2 NUF2 SLC4A1 UNC80 IDH1 LRP8 MAGEC3 SHANK1 PYGL AVIL ATP 10D SLFN5 PITPNM2 DNAH1 RPSA ZNF865 BRD4 AP3D1 CELF6 B4GALNT4
March 2009
Early 2011
TMZ TMZ, BEV Imatinib
Death
March 29th 2012
May 9th 2012
May 18th 2012
June 2012 Adjuvant TMZ
& radiotherapy
Seizures, diagnosis of relapse
Resection of relapse, source of regions As
Relapse DNA (As) sent to Illumina for sequencing
WGS data (As) sent from Illumina to CRUK
Figure 1. Timeline and clonal structure. Timeline of the patient’s disease from diagnosis to death (A) showing timing of the temozolomide (TMZ), bevacizu- mab (BEV) and imatinib treatments. Timeline is not drawn to scale in terms of length of time. A Euler–Venn diagram (B) displaying the overlaps of non-silent and silent mutations in the joint recurrence cohort and the grade II and grade IV samples. A mutation spectrum of non-synonymous mutations is illustrated as a heatmap of the detected mutations in the two primary tumour sectors and in the joint three recurrence samples (C). Squares in light grey (yellow online) re- present mutations detected in sub-clonal populations in the specific sector while dark grey (red online) squares represent the presence of the mutation in the clonal population of the respective sector. (D) Two-dimensional clustering of mutations in the grade II and grade IV specimens. The axis correspond the cancer cell fraction (CCF), describing the fraction of tumour cells carrying the mutation. The ordinate corresponds to grade IV specimen and the abscissa corre- sponds to grade II specimen. Clusters present on the upper right of the plot correspond to clonal mutations present in both specimen; clusters located in the upper left represent clonal mutations unique of the grade IV and the bottom right correspond to clonal mutations unique of the grade II specimen. The numbers close to each cluster represent the number of non-silent mutations present in the respective cluster, gene symbols represent specific silent mutations present in the cluster.
| Favero et al. Volume 26 | No. 5 | May 2015
and absent in the grade II. The cluster 2 mutations likely re- present a persistent sub-clone within the grade II region that gave rise to the grade IV region, while clusters 4 and 5 may have arisen independently in the grade IV, consistent with further sub-clonal evolution occurring during disease progression.
primary tumour shows heterogeneous acquisition of copy-number changes
CNV and SV analyses identified a number of shared events in the primary regions (supplementary Table S2, available at Annals of Oncologyonline), including copy-neutral loss of het- erozygosity on chromosome 17p followingTP53mutation (sup- plementary Figure S2A and B, available atAnnals of Oncology online); CDK6 and MET amplification via gain of 7q; and two high-level focal amplifications (supplementary Figure S3, available at Annals of Oncology online) of 4q12 (encoding PDGFRAand KIT) and 12q13.3-q14.1 (encodingCDK4,AVIL and miR-26a-2).
ITH was also detected by CNV and SV analyses (supplemen- tary Figure S4, available at Annals of Oncology online):
CDKN2A/Bloss and other CNVs (gain of 6p, 19p and 20p; loss of 10q, 12q, 13, 16q, 17q and 22) were detected only in the grade IV sample. Furthermore, the 4q12 and 12q13.3–14.1 focal amplifications were linked by numerous translocations in the grade IV but not in the grade II sample (supplementary Figures S5 and S6, available atAnnals of Oncologyonline).
Allele-specific CNV analysis revealed that the grade IV region was predominantly tetraploid, while the grade II region was largely diploid. Mutations in the grade IV region also exhibited a bimodal variant allele frequency distribution consistent with a GD event, exclusively in the grade IV region (supplementary Figure S7, available atAnnals of Oncologyonline). As previously reported [15], GD is permissive for chromosome instability (CIN) and accelerated cancer genome evolution. Consistent with a GD event in the grade IV region followed by chromo- some losses due to increasing CIN [15],flow cytometry on the fresh tissue of the three recurrence samples revealed a DNA index of 1.60, 1.58 and 1.55 for each recurrence region (supple- mentary Figure S8, available atAnnals of Oncologyonline).
chromosome 4 rearrangements and evolution of a double-minute chromosome
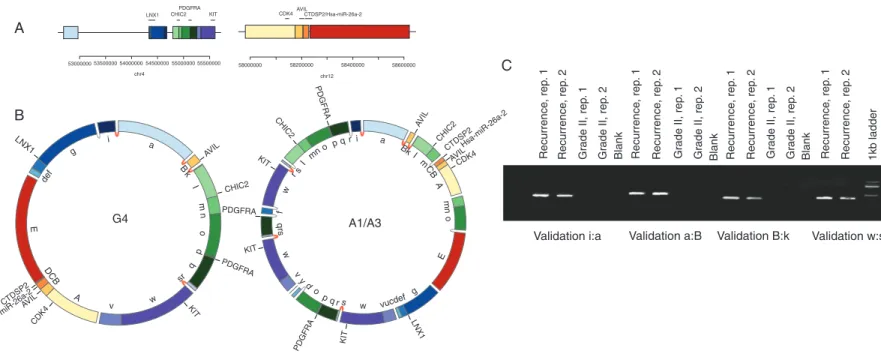
Copy-number analysis of the recurrence tumour revealed focal amplifications in 4q12 and 12q13.3-q14.1 detected in the grade IV region, with comparably high copy number and seemingly identical breakpoints (supplementary Figures S2C and D and S6, available atAnnals of Oncologyonline). Although the grade II sample also shared the 12q13.3-q14.1 amplification, the entire 4q-arm was amplified in this sample. SV analysis revealed complex chromosomal re-arrangements linking the 4q12 and 12q13.3-q14.1 focal amplifications in the higher grade samples only. Taken together, these features are reminiscent of a double- minute chromosome (DM), a relatively frequent cytogenetic event in GBM [9,16].
To investigate this further, we employed a precise amplicon reconstruction method [9]. This involved the identification of breakpoints related to the highly amplified regions, followed by the construction of a breakpoint graph that links the amplified
segments and their associated breakpoints, and afinal search for an optimal path that completely traverses the graph (supple- mentary Figure S9, available atAnnals of Oncologyonline). In the final solution, segment traversal number correlates with observed relative copy number of the segment, and circular paths are indicative of a DM.
Consistent with a DM, the 4q12 and 12q13.3-q14.1 amplifica- tions revealed circular paths, indicating DMs in the grade IV and recurrence samples (Figure2A and B and supplementary Figure S9A, available at Annals of Oncology online). Two chromosomal intervals (Figure2A) replete with putative driver genes (PDGFRA, KIT, CDK4, AVIL and miR-26a-2) are re- configured into circular assemblies. Figure 2B illustrates the optimal paths that account for the observed breakpoints and high copy-number amplifications. The absence of this structure in the grade II sample suggests that the 12q13.3-q14.1 focal amplification preceded DM formation, consistent with a break- age-bridge fusion cycle [17]. However, L1 elements flank the 12q13.3-q14.1 amplification (data not shown), precluding further local SV resolution. There are numerous precisely shared break- points between the DM models, and all breakpoints tested vali- dated (Figure 2C and supplementary Figure S10, available at Annals of Oncologyonline), which suggests a common origin of the extra-chromosomal structures. Moreover, the breakpoints exhibit features of non-homologous end-joining [8] which may be indicative of a single chromothriptic event [18].
To investigate the origin of the DMs, we carried out haplotype analysis in the grade IV and recurrence DMs. This was achieved using allele frequencies of heterozygous SNPs located in the DM locus (supplementary Information, available atAnnals of Oncologyonline). Consistent with a shared origin of the DMs, the allelic composition of the DM haplotypes appears to be identical at the 4q12 and 12q13.3-q14.1 loci (supplementary Figure S11, available atAnnals of Oncology online). Moreover, the DM derived from both higher copy-number haplotypes;
conversely, the higher copy-number haplotypes on 4q12 were predominantly lost in the segments flanking the DM. Such a pattern is consistent with shattering of a‘gained’chromosome 4q followed by‘rescue’of oncogenic fragments within the DM and loss of the remainder of the chromosome.
double-minute chromosome is associated with progression
We computed a distance matrix from all the mutations detected in the primary regions and in the three recurrence regions, establishing a phylogenetic relationship between the sequenced regions. This confirmed that the recurrence specimen was most similar to the grade IV region, with the DM likely arising bet- ween the grade II and grade IV regions (Figure3A). The DM carries the putative GBM driver geneAVIL[19], with a mutation restricted to the grade IV/recurrence lineage and linked to the focal amplification via discordant paired-end reads as well as exhibiting a high-variant allele frequency (chr12:58204830;
supplementary Figure S2F, available at Annals of Oncology online). Additionally, the DM unifies multiple oncogenic com- ponents of the PI3K pathway:PDGFRA,KIT, and a regulator ofPTEN(miR-26a-2) as well asCDK4(Figure2B). To assess if the grade IV tumour shows increased activation of the PI3K
Volume 26 | No. 5 | May 2015 doi:10.1093/annonc/mdv127 |
Annals of Oncology
original articles
a a Bk
Im CB
A
mn o
E
g vucdef s w
qr p v w qrs
f
w r s
I
yd o mn
o p qr i B
AVIL
CHIC2
KIT KIT
KIT KIT
CDK4
CHIC2
AVIL CHIC2
AVILCDK4 CTDSP2Hsa-miR-26a-2 PDGFRA
LNX1 CTDSP2AVIL
Hsa-miR-26a-2
PDGFRA
PDGFRA
PDGFRA k
I
o
p q sr v w
A DCB E
m n i
g LNX1
def
G4 A1/A3
Validation i:a
Recurrence, rep. 1 Recurrence, rep. 2 Grade II, rep. 1 Grade II, rep. 2 Blank Recurrence, rep. 1 Recurrence, rep. 2 Grade II, rep. 1 Grade II, rep. 2 Blank Recurrence, rep. 1 Recurrence, rep. 2 Grade II, rep. 1 Grade II, rep. 2 Blank Recurrence, rep. 1 Recurrence, rep. 2 1kb ladder
Validation a:B Validation B:k Validation w:s
53000000 53500000 54000000 54500000 55000000 55500000 58000000 58200000 58400000 chr12 chr4
58600000 LNX1
A
B
C
CHIC2
PDGFRA AVIL
CTDSP2/Hsa-miR-26a-2 CDK4
KIT
Figure 2. Evolution of the double minute. (A) The upper panel represents the genomic segments before the DM formation, with genes annotated by horizontal lines. The lower panel contains circular chromosome plots representing the double-minute models for the grade IV (G4) and recurrence samples (A1/A3), with validated (and shared) breakpoints denoted by dark grey (red online) links between segments. Light grey (yellow online) links represent un-validated breakpoints for whichde novocontigs could be assembled. Validated breakpoints are illustrated in panels (B and C).
|Faveroetal.Volume26|No.5|May2015
articles
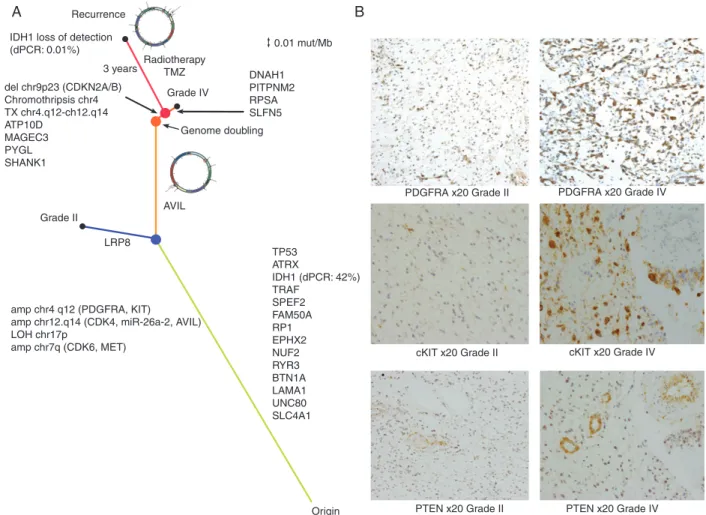
AnnalsofOncologypathway, we carried out immunohistochemistry against PDGFRA, PTEN and cKIT in the grade II and grade IV tumours (Figure 3B). We found increased levels of PDGFRA (215/300 versus 93/300, grade IV versus grade II) and cKIT (222/300 versus 31/300) in the grade IV tumour, but no differ- ence in the PTEN levels (34/300 versus 23/300). This suggests that PTEN is deactivated in both the grade II and grade IV tumours, but that the PI3K pathway is further activated in the grade IV tumour, likely due to amplification of genes encoded within the DM.
IDH1 driver mutation is lost at recurrence
Trunk events including the TP53 and ATRX mutations and PDGFRA/KIT,CDK4/miR-26a-2focal amplifications along with the grade IV private mutation detected in AVIL were identified at high frequency in the recurrence samples. Surprisingly, the IDH1 R132H mutation was not detected in the recurrence samples despite being clonal in the grade II and IV lesions. To
validate this observation, we carried out digital PCR (dPCR) on IDH1andTP53(usingTP53as a control). We confirmed that the R132H mutation was indeed clonal in the grade II and grade IV specimens (found in∼42%–44% of DNA molecules, supple- mentary File, available atAnnals of Oncologyonline), but essen- tially undetected in the recurrence samples, with between 0.01%
and 0.1% of DNA molecules showing the mutation by dPCR.
Conversely, TP53 was found in between 8% and 12% of the DNA molecules (supplementary File, available at Annals of Oncologyonline), consistent with clonal presence in the low- purity recurrence biopsies (estimated at 10%–15% purity, sup- plementary Information, available at Annals of Oncology online). It is therefore likely that the recurrence has experienced loss of the mutatedIDH1allele and retention of the wild-type allele.
A recent report indicates mutual exclusivity between activa- tion of the PI3K pathway and IDH1 activity [20]. As the recur- rence demonstrated increased levels of PDGFRA and KIT amplification encoded on the DM, activators of the PI3K
IDH1 loss of detection (dPCR: 0.01%)
Recurrence
A B
3 years Radiotherapy TMZ
Grade II
Grade IV
LRP8
AVIL del chr9p23 (CDKN2A/B)
Chromothripsis chr4 TX chr4.q12-ch12.q14 ATP10D
MAGEC3 PYGL SHANK1
Genome doubling DNAH1 PITPNM2 RPSA SLFN5
0.01 mut/Mb
Origin PTEN x20 Grade II PTEN x20 Grade IV cKIT x20 Grade II cKIT x20 Grade IV PDGFRA x20 Grade II PDGFRA x20 Grade IV
amp chr4 q12 (PDGFRA, KIT)
amp chr12.q14 (CDK4, miR-26a-2, AVIL) LOH chr17p
amp chr7q (CDK6, MET)
TP53 ATRX
IDH1 (dPCR: 42%) TRAF
SPEF2 FAM50A RP1 EPHX2 NUF2 RYR3 BTN1A LAMA1 UNC80 SLC4A1
Figure 3. Evolution a GBM tumour to recurrence. (A) Phylogenetic tree describing the evolution of the tumour. The length of the branches is calculated using the mutation rate as described in the Methods section. The recurrence specimens are characterised by loss of the IDH1 mutation and by the further evolution of the double minute. Medium grey (blue online) dot represents branching of grade II and grade IV specimens, grey (orange online) dot represents the genome-doubling event, dark grey (red online) dot represents branching of recurrence tumour from the grade IV specimen. Black dots represent tumour sam- pling. ForIDH1, mutant allele frequency detected by dPCR is indicated in parenthesis (B) Immunohistochemistry showing increased expression ofcKITand PDGFRAin the grade IV component of the primary tumour relative to grade II.PTENis highly expressed in the proliferating vessels of both the grade II and IV primary tumour sectors but the neoplastic astrocytes are largely negative.
Volume 26 | No. 5 | May 2015 doi:10.1093/annonc/mdv127 |
Annals of Oncology
original articles
pathway, we addressed whether the GBM data from The Cancer Genome Atlas (TCGA) [16] supports mutual exclusivity betweenIDH1R132H mutation andPDGFRAand/orKITamp- lification.IDH1 and TP53mutations are enriched in the pro- neural subtype [21]. Using the cBIO portal [22], we identified 137 TCGA GBM cases classified as proneural in Brennan et al.
[16], with both sequence and copy-number data. Of these, 12 showed the R132H mutation, 25 showed dualKITandPDGFRA amplification and 10 showed PDGFRAamplification only. No overlap between cases with theIDH1R132H mutation andKIT and/orPDGFRAamplification was observed indicating mutual exclusivity between these oncogenic events (P= 0.036, Fisher’s exact test). This also suggests that the IDH1R132H mutation was indeed an early driver event that was subsequently lost during recurrence, as a more potent poly-oncogene–oncomir cluster was selected for in the DM.
An analysis of TCGA GBM data from 264 tumours with whole-exome sequencing processed by Sanborn et al. [9] to infer DM structures, identified four samples, of these three pro- neural, with amplifications of both PDGFRA and CDK4, pos- sibly encoded in double-minute chromosomes. These data suggest that at least 1.5% (4/264) of GBM tumours overall, and 8% (22/264) of the proneural subtype, are driven by the acquisi- tion of such a macro-evolutionary event typified by PDGRA/
CDK4/miR-26a-2DMs.
discussion
This study is one of thefirst reports of a multi-region longitu- dinal WGS of a GBM from diagnosis to death, carried out spe- cifically with the intention to improve patient outcome by the application of tailored therapy. Unfortunately, despite identify- ing multiple amplified targetable oncogenes and applying tar- geted therapy, disease control was not achieved, and the patient died following disease progression.
To our knowledge, this is thefirst description of a loss of a tier 1 clonal driver event (IDH1, R132H) during disease pro- gression, and may reflect complex epistatic relationships between tumour somatic events and the selection pressure of therapy. We cannot formally exclude the possibility that the IDH1 mutation in the primary samples was a sub clonal event at diagnosis; we have documented in NSCLC and ccRCC that drivers can appear clonally dominant within one region only to find that further tumour sampling reveals the sub clonal nature of the event. However, this would require extensive parallel evo- lution since the majority of somatic aberrations were shared between relapse and the grade IV region. Rather, the progressive enrichment of the DMs from the grade IV to recurrence sug- gests increased oncogenic potential based on the PI3K pathway.
With the waning of the driver IDH1 event, this indicates a macro-evolutionary switch from the dominance of the IDH1- mutated tumour to a DM-driven tumour in a mutually exclusive context. An analysis of the TCGA data also revealed no overlap betweenIDH1R132H mutations andPDGFRA/KITamplification, suggesting that high-levelPDGFRA/KITamplification would not be favourable with an existentIDH1R132H mutation.
These findings have important implications for precision medicine, suggesting a targetable clonal driver event can be se- lectively lost during the disease course, and replaced in its
entirety by an initially low-frequency event in the primary tumour. The clonal dominance of IDH1 driver events might need to be considered within the context of low-frequency oncogenic drivers when examining the efficacy of therapeutics targetingIDH1in this disease [23]. Furthermore, despite rapid WGS at recurrence and cancer genome-directed therapy, imati- nib was unable to control the disease. Following radiotherapy and two surgical debulking procedures, it is unlikely that the blood–
brain barrier was intact, preventing drug penetration into the central nervous system. It is more likely that treatment failure was a consequence of the evolution of the poly-oncogene/oncomir DM targeting the PI3K axis at multiple nodal points.
Moreover, our results emphasize the profound effects of cancer cell GD, resulting in accelerated cancer genome evolution, charac- terised by a tolerance of CIN and propagation of aneuploid progeny [15]. The accelerated CIN permitted following the GD event in the grade IV region of the primary tumour, and possibly a chromothripsis event on chromosome 4, resulted in the forma- tion and subsequent selection of a highly poly-oncogene– oncomir DM encodingmiR-26a-2,PDGFRA,KITandCDK4.
MicroRNA miR-26a-2 effectively targets PTEN [24].
Immunohistochemistry demonstrated that PTEN expression was weak or absent relative to stromal cells in both the grade II and grade IV regions, although no genomic aberrations were detected at thePTENlocus. It is likely therefore, that amplifica- tion ofCDK4/miR-26a-2region, either encoded within the DM in the grade IV region and recurrent tumour or simply due to amplification as observed in the grade II specimen, directly con- tributed to loss of PTEN protein expression.
Taken together, these observations emphasise the complexity of signal transduction cascades activated within individual tumours.
However, it is apparent that the oncogenic drivers involved in GBM pathogenesis are highly constrained and the combination of these events involved in DMs may befinite. There is an unmet need to enrol patients within longitudinal cohort studies to define these genetic constraints in order to accelerate our understanding of GBM evolution throughout the disease course and optimise therapeutic opportunities in this disease.
acknowledgements
Results published here are partially based upon data generated by the Cancer Genome Atlas pilot project established by the NCI and NHGRI. Information about TCGA and the investiga- tors and institutions who constitute the TCGA research network can be found athttp://cancergenome.nih.gov/. The data were retrieved through dbGaP authorisation (Accession No.
phs000178.v8.p7).
funding
This work was supported by Cancer Research UK and the European Commission 7th Framework Programme (HEALTH- 2010-F2-259303); ZS was funded by the Breast Cancer Research Foundation, the Hungarian Academy of Sciences (KTIA_
NAP_13-2014-0021). CS is funded by Cancer Research UK, the Rosetrees Trust, EU FP7 ( projects PREDICT and RESPONSIFY, ID:259303), the Prostate Cancer Foundation, the European Research Council and the Breast Cancer Research Foundation.
| Favero et al. Volume 26 | No. 5 | May 2015
This research is supported by the National Institute for Health Research University College London Hospitals Biomedical Research Centre.
disclosure
JB, JFP, ZK, RJG, SH and DB are employees of Illumina, Inc., a public company that develops and markets systems for genetic analysis. All remaining authors have declared no conflicts of interest.
references
1. Wen PY, Kesari S. Malignant gliomas in adults. N Engl J Med 2008; 359(5):
492–507.
2. Johnson BE, Mazor T, Hong C et al. Mutational analysis reveals the origin and therapy-driven evolution of recurrent glioma. Science 2014; 343(6167):
189–193.
3. Sottoriva A, Spiteri I, Piccirillo SGM et al. Intratumor heterogeneity in human glioblastoma reflects cancer evolutionary dynamics. Proc Natl Acad Sci USA 2013;
110(10): 4009–4014.
4. Watanabe T, Nobusawa S, Kleihues P, Ohgaki H. IDH1 mutations are early events in the development of astrocytomas and oligodendrogliomas. Am J Pathol 2009;
174(4): 1149–1153.
5. Turcan S, Rohle D, Goenka A et al. IDH1 mutation is sufficient to establish the glioma hypermethylator phenotype. Nature 2012; 483(7390): 479–483.
6. De Bruin EC, McGranahan N, Mitter R et al. Spatial and temporal diversity in genomic instability processes defines lung cancer evolution. Science 2014; 346 (6206): 251–256.
7. Wang K, Li M, Hakonarson H. ANNOVAR: functional annotation of genetic variants from high-throughput sequencing data. Nucleic Acids Res 2010; 38(16): e164.
8. Yang L, Luquette LJ, Gehlenborg N et al. Diverse mechanisms of somatic structural variations in human cancer genomes. Cell 2013; 153(4): 919–929.
9. Sanborn JZ, Salama SR, Grifford M et al. Double minute chromosomes in glioblastoma multiforme are revealed by precise reconstruction of oncogenic amplicons. Cancer Res 2013; 73(19): 6036–6045.
10. Favero F, Joshi T, Marquard AM et al. Sequenza: allele-specific copy number and mutation profiles from tumor sequencing data. Ann Oncol 2015; 26(1): 64–70.
11. Bolli N, Avet-Loiseau H, Wedge DC et al. Heterogeneity of genomic evolution and mutational profiles in multiple myeloma. Nat Commun 2014; 5: 2997.
12. Jara A, Hanson TE, Quintana FA et al. DPpackage: Bayesian non- and semi- parametric Modelling in R. J Stat Softw 2011; 40(5): 1–30.
13. Liu X-Y, Gerges N, Korshunov A et al. Frequent ATRX mutations and loss of expression in adult diffuse astrocytic tumors carrying IDH1/IDH2 and TP53 mutations. Acta Neuropathol 2012; 124(5): 615–625.
14. Lovejoy CA, Li W, Reisenweber S et al. Loss of ATRX, genome instability, and an altered DNA damage response are hallmarks of the alternative lengthening of telomeres pathway. PLoS Genet 2012; 8(7): e1002772.
15. Dewhurst SM, McGranahan N, Burrell RA et al. Tolerance of whole-genome doubling propagates chromosomal instability and accelerates cancer genome evolution. Cancer Discov 2014; 4(2): 175–185.
16. Brennan CW, Verhaak RGW, McKenna A et al. The somatic genomic landscape of glioblastoma. Cell 2013; 155(2): 462–477.
17. Bunting SF, Nussenzweig A. End-joining, translocations and cancer. Nat Rev Cancer 2013; 13(7): 443–454.
18. Forment JV, Kaidi A, Jackson SP. Chromothripsis and cancer: causes and consequences of chromosome shattering. Nat Rev Cancer 2012; 12(10):
663–670.
19. Crespo I, Tão H, Nieto AB et al. Amplified and homozygously deleted genes in glioblastoma: impact on gene expression levels. PLoS One 2012; 7(9): e46088.
20. Charitou P, Rodriguez-colman M, Gerrits J et al. FOXOs support the metabolic requirements of normal and tumor cells by promoting IDH 1 expression. EMBO Rep 2015 Feb 3. pii: e201439096 [epub ahead of print].
21. Verhaak RGW, Hoadley KA, Purdom E et al. Integrated genomic analysis identifies clinically relevant subtypes of glioblastoma characterized by abnormalities in PDGFRA, IDH1, EGFR, and NF1. Cancer Cell 2010; 17(1): 98–110.
22. Cerami E, Gao J, Dogrusoz U et al. The cBio cancer genomics portal: an open platform for exploring multidimensional cancer genomics data. Cancer Discov 2012; 2(5): 401–404.
23. Yap TA, Gerlinger M, Futreal PA et al. Intratumor heterogeneity: seeing the wood for the trees. Sci Transl Med 2012; 4(127): 127ps10.
24. Lee DH, Amanat S, Goff C et al. Overexpression of miR-26a-2 in human liposarcoma is correlated with poor patient survival. Oncogenesis 2013; 2: e47.
Volume 26 | No. 5 | May 2015 doi:10.1093/annonc/mdv127 |
Annals of Oncology