Role of anion exchangers in Cl
⫺and HCO
3⫺secretion by the human airway epithelial cell line Calu-3
Dusik Kim,1Juyeon Kim,1Beáta Burghardt,2Len Best,3and Martin C. Steward1
1Faculty of Life Sciences, University of Manchester, Manchester, United Kingdom;2Department of Oral Biology, Semmelweis University, Budapest, Hungary; and3Faculty of Medicine and Human Sciences, University of Manchester, Manchester, United Kingdom
Submitted 19 March 2014; accepted in final form 30 May 2014
Kim D, Kim J, Burghardt B, Best L, Steward MC.Role of anion exchangers in Cl⫺and HCO3⫺secretion by the human airway epithelial cell line Calu-3. Am J Physiol Cell Physiol 307: C208–C219, 2014. First published June 4, 2014; doi:10.1152/ajpcell.00083.2014.—Despite the im- portance of airway surface liquid pH in the lung’s defenses against infection, the mechanism of airway HCO3⫺secretion remains unclear.
Our aim was to assess the contribution of apical and basolateral Cl⫺/HCO3⫺exchangers to Cl⫺and HCO3⫺transport in the Calu-3 cell line, derived from human airway submucosal glands. Changes in intracellular pH (pHi) were measured following substitution of Cl⫺ with gluconate. Apical Cl⫺ substitution led to an alkalinization in forskolin-stimulated cells, indicative of Cl⫺/HCO3⫺exchange. This was unaffected by the anion exchange inhibitor DIDS but inhibited by the CFTR blocker CFTRinh-172, suggesting that the HCO3⫺ influx might occur via CFTR, rather than a solute carrier family 26 (SLC26) exchanger, as recently proposed. The anion selectivity of the recovery process more closely resembled that of CFTR than an SLC26 ex- changer, and quantitative RT-PCR showed only low levels of SLC26 exchanger transcripts relative to CFTR and anion exchanger 2 (AE2).
For pHito rise to observed values (⬃7.8) through HCO3⫺entry via CFTR, the apical membrane potential must reverse to at least⫹20 mV following Cl⫺ substitution; this was confirmed by perforated-patch recordings. Substitution of basolateral Cl⫺evoked a DIDS-sensitive alkalinization, attributed to Cl⫺/HCO3⫺exchange via AE2. This ap- peared to be abolished in forskolin-stimulated cells but was unmasked by blocking apical efflux of HCO3⫺ via CFTR. We conclude that Calu-3 cells secrete HCO3⫺predominantly via CFTR, and, contrary to previous reports, the basolateral anion exchanger AE2 remains active during stimulation, providing an important pathway for basolateral Cl⫺uptake.
cystic fibrosis transmembrane conductance regulator; airway surface liquid; cystic fibrosis; intracellular pH; bicarbonate; Cl⫺/HCO3⫺ex- change; anion exchanger 2; SLC26A4 (pendrin)
AIRWAY SURFACE LIQUID (ASL) plays an important protective role in clearing the upper airways of inhaled particulate matter and microorganisms (3). It consists of a thin aqueous film supporting a mucin raft that traps dust and pathogens and is swept toward the pharynx by cilia (9). ASL must be continu- ously replenished by secretions derived largely from the sub- mucosal glands in the upper airways to counter the effects of evaporation and expectoration. The electrolytes are thought to be secreted mainly by the serous cells, a major site of cystic fibrosis transmembrane conductance regulator (CFTR) expres- sion (8, 25, 53). The depth of the aqueous layer is determined by the balance between Cl⫺secretion and Na⫹reabsorption (4). Both of these processes are disturbed in cystic fibrosis
(CF), with the result that the depth of the aqueous layer is reduced, mucociliary clearance is impaired, the mucus layer is less well hydrated, and the airways become infected and inflamed (3, 44).
ASL is near neutral pH (pH 6.6 –7.0) and becomes slightly more acidic in CF (5, 10, 60), which increases the susceptibil- ity of the airway surface to infection (42). Studies on isolated submucosal glands and airway epithelial cells in primary cul- ture indicate that CFTR is essential for fluid and HCO3⫺ secretion (26, 59, 63). In addition to its role in ASL pH regulation, the secreted HCO3⫺ specifically facilitates the ex- pansion and solubilization of secreted mucin granules (14, 45, 46); thus a reduction of HCO3⫺ secretion, as well as fluid volume, may contribute to the pathophysiology of CF. Under- standing the mechanism of HCO3⫺secretion by human airway serous cells is therefore of prime importance.
The Calu-3 cell line was derived from a human lung carci- noma and has proved to be a useful experimental model for studying CFTR-dependent HCO3⫺secretion (54). Its phenotype resembles that of serous cells of the submucosal glands, it expresses abundant CFTR (15, 57), and it has been shown to secrete a moderately HCO3⫺-rich fluid in vitro (11, 21, 55).
By analogy with other HCO3⫺-secreting epithelia, such as the intestine and pancreatic duct, the secretory mechanism might be expected to involve the combined activity of CFTR and an apical Cl⫺/HCO3⫺ exchanger of solute carrier family 26 (SLC26), typically SLC26A3 or SLC26A6 (31, 66). The CFTR channel itself has a relatively low permeability to HCO3⫺ (19, 32, 39, 43), so the SLC26 Cl⫺/HCO3⫺exchangers are thought to provide the main pathway for HCO3⫺secretion. Indeed, our own preliminary studies, examining the effect of extracellular Cl⫺substitution on intracellular pH (pHi) (27, 35), and similar work by Garnett et al. (11), have pointed to the possible involvement of the anion exchanger pendrin (SLC26A4) in HCO3⫺secretion across the apical membrane of Calu-3 cells. In this model, Cl⫺ secretion via CFTR defines the secretory (volume) flow rate, while the subsequent exchange of secreted Cl⫺ for intracellular HCO3⫺ via pendrin defines the HCO3⫺ concentration of the secreted fluid (11).
There is, however, a substantial body of evidence, much of it from Ussing chamber studies, to suggest that HCO3⫺secre- tion at the apical membrane is mediated mainly by CFTR, rather than by an associated exchanger such as pendrin. The secretory flux of HCO3⫺1) appears to be directly related to its electrochemical driving force at the apical membrane, 2) is abolished by CFTR blockers, 3) is insensitive to the anion exchange inhibitor DIDS, and 4) does not require Cl⫺ in the apical bathing solution (6, 18, 20, 29, 55).
Address for reprint requests and other correspondence: M. C. Steward, Faculty of Life Sciences, Univ. of Manchester, Michael Smith Bldg., Man- chester, M13 9PT, UK (e-mail: martin.steward@manchester.ac.uk).
First published June 4, 2014; doi:10.1152/ajpcell.00083.2014.
The present study investigates these alternative models, with a focus on two aspects. We test whether pHichanges observed in response to extracellular anion substitution, and previously attributed to apical Cl⫺/HCO3⫺ exchange via pendrin, can instead be explained by electrical coupling of Cl⫺and HCO3⫺ fluxes via CFTR. We also reexamine the role of the basolateral Cl⫺/HCO3⫺ exchanger in the light of two other conflicting reports, one suggesting that basolateral AE2 has a key role in HCO3⫺-dependent Cl⫺secretion (16) and the other suggesting the opposite, i.e., that its activity is suppressed during cAMP stimulation to maximize HCO3⫺ secretion (12).
MATERIALS AND METHODS Materials
Cell culture media were obtained from Invitrogen (Life Technol- ogies, Paisley, UK), 2=,7-bis-(2-carboxyethyl)-5-(and 6)-carboxyfluo- rescein acetoxymethyl ester (BCECF-AM) from Molecular Probes (Life Technologies, Paisley, UK), and CFTRinh-172 from Calbiochem (Merck Biosciences, Nottingham, UK). All other compounds were obtained from Sigma-Aldrich (Dorset, UK).
Cell Culture
Calu-3 cells (HTB-55, American Type Culture Collection) were obtained from LGC Promochem (Teddington, UK). Cells were grown in Eagle’s minimum essential medium supplemented with fetal bovine serum (10%), L-glutamine (2 mM), nonessential amino acids (0.1 mM), sodium pyruvate (1 mM), penicillin (100 U/ml), and strepto- mycin (0.1 mg/ml). Cells were incubated at constant humidity in 5%
CO2at 37°C and subcultured at weekly intervals by trypsinization at a 1:10 ratio. For experiments, cells were seeded onto Transwell clear polyester inserts (6.5 mm diameter, 0.4m pore size; Corning Costar, Buckinghamshire, UK) and grown for ⱖ10 days before they were used to establish a polarized monolayer. Transepithelial resistance under these conditions was⬃300⍀·cm2after correction for solution and filter resistances.
Measurement of pHi
Calu-3 cells cultured on Transwell inserts were loaded with the pH-sensitive dye BCECF by incubation with the acetoxymethyl ester BCECF-AM (5M) in a HCO3⫺-buffered solution for 30 min in 5%
CO2 at 37°C. After the loading period, inserts were mounted in a Perspex perfusion chamber on the stage of an inverted fluorescence microscope (Nikon Diaphot TMD). The fluid volumes in the apical and basolateral hemichambers were ⬃100 and 80 l, respectively, and the flow rate through each was 1.5 ml/min. Solutions were prewarmed to 37°C, and the temperature of the chamber was main- tained at 37°C by a thermostatically controlled, heated platform (Warner Instruments, Hamden, CT). Cells were excited alternately at 440 and 490 nm for 1 s at each wavelength. Fluorescence emitted by BCECF was measured photometrically at 530 nm (Cairn Research, Faversham, UK). pHiwas calculated from the ratio of fluorescence at 490 nm to fluorescence at 440 nm using calibration data obtained in situ by the nigericin-K⫹method (64).
A HEPES-buffered solution (in mM: 117 NaCl, 5 KCl, 1 CaCl2, 1 MgSO4, 5 NaHEPES, 5 HEPES, and 10D-glucose) was used as the standard solution for nominally HCO3⫺-free experiments and was gassed with 100% O2. For experiments performed in the presence of HCO3⫺, the standard HCO3⫺-buffered solution contained (in mM) 96 NaCl, 5 KCl, 1 CaCl2, 1 MgCl2, 10D-glucose, and 25 NaHCO3and was bubbled with 95% O2-5% CO2. In solutions containing NH4Cl, 20 mM NaCl was replaced with equimolar NH4Cl. Na⫹was isos- motically replaced with equimolarN-methyl-D-glucamine (NMDG⫹) in all Na⫹-free solutions. The Na⫹-free, HCO3⫺-buffered solution contained 25 mM NMDG-HCO3 in place of NaHCO3. This was
prepared by gassing a 1 M solution of NMDG overnight with 100%
CO2. For the anion substitution experiments, the HCO3⫺-buffered control solution contained (in mM) 116 NaCl, 5 KCl, 1 CaCl2, 1 MgSO4, 2.8 NaHEPES, 2.2 HEPES, 10D-glucose, and 25 NaHCO3. In the Cl⫺-free solutions, Cl⫺was replaced with equimolar gluconate, and the Ca2⫹concentration was raised to 4 mM to compensate for the chelation of Ca2⫹by gluconate. For the anion selectivity experiments, Cl⫺was replaced with equimolar I⫺and formate (HCOO⫺) and by SO42⫺ and succinate at one-half of the Cl⫺ concentration, with isotonicity maintained by addition of 53 mM mannitol.
Perforated-Patch Experiments
Calu-3 cells plated on poly-L-lysine-coated coverslips were placed in a patch-clamp chamber (35 mm diameter) that was constantly perfused at a rate of⬃2 ml/min with a bath solution containing (in mM) 115 NaCl, 25 NaHEPES, 1 MgCl2, 1.2 CaCl2, 4 KCl, 10 HEPES, and 4 glucose (pH 7.4, HEPES-buffered solution) or 115 NaCl, 25 NaHCO3, 1 MgCl2, 1.2 CaCl2, 4 KCl, 10 HEPES, and 4 glucose (pH 7.4, HCO3⫺-buffered solution). Perfusion buffers contain- ing HCO3⫺were bubbled with 95% O2-5% CO2.
Membrane potential was recorded with an EPC-7 amplifier (List, Darmstadt, German) in individual Calu-3 cells using the perforated- patch technique under zero current-clamp conditions. They were studied acutely after dissociation, expressed functional CFTR, and were effectively short-circuited under these experimental conditions.
The basic pipette solution contained (in mM) 135 KCl, 5 NaCl, 1 MgCl2, 1.2 CaCl2, 4 KCl, 10 HEPES, and 4 glucose (pH 7.2). Pipette tips were filled with the gramicidin D-containing pipette solution. The reference electrode was connected to the bath solution via an agar- KCl (140 mM) bridge, in experiments in which the external Cl⫺was removed, to prevent generation of a junction potential. Changes in the membrane potential of the Calu-3 cells were recorded with pCLAMP 6 software (Axon Instruments), and data were acquired at 1-s intervals using LabVIEW 8.2 software (National Instruments, Austin, TX). All patch-clamp experiments were carried out at room temperature (23–
25°C).
RNA Isolation and Quantification
Total RNA was isolated from Calu-3 cells using the RNeasy Micro Kit (Qiagen, West Sussex, UK) according to the manufacturer’s instructions. Prior to the analysis of gene expression, purified total RNA quality and quantity were evaluated with a spectrophotometer (model ND-1000, NanoDrop Technologies, Wilmington, DE). Values of 1.9 –2.1 for the ratio of OD at 260 nm to OD at 280 nm were considered to indicate adequate purity. Purified RNA was stored at
⫺80°C prior to use for further experiments.
RT-PCR
Single-strand cDNA synthesis was performed on high-quality, purified RNA samples using a high-capacity RNA-to-cDNA kit (Ap- plied Biosystems, Warrington, UK). The incubation was performed at 37°C for 60 min, stopped at 95°C for 5 min, and then held at 4°C in a thermal cycler. The PCR products were then electrophoresed on 1.5% agarose-Tris-acetate-EDTA gel incorporating ethidium bromide (0.5 mg/ml) in 0.5⫻ agarose-Tris-acetate-EDTA running buffer at 110 V. After electrophoresis, the DNA bands were visualized and photographed under UV light using a gel documentation and analysis system (Uvitec, Cambridge, UK). A 100-bp DNA ladder (Promega, Madison, WI) was used to determine the size of the bands.
Quantitative PCR
Real-time quantitative PCRs (qPCRs) were performed using TaqMan gene expression assays (Applied Biosystems). Ten microliters of master mix and 1l of predesigned primers (from inventoried assays that had been validated by the manufacturer; Table 1) were added to
each cDNA sample. The plates were analyzed in a real-time PCR thermocycler using SDS software (model 7500, Applied Biosystems).
Amplification was performed with the following cycle parameters: 10 min at 95°C and 40 cycles of 15 s at 95°C and 60 s at 60°C. The threshold value was manually adjusted to pass through the linear portion of the curve corresponding to the exponential phase of amplification. The raw cycle threshold (CT) values obtained from the TaqMan assays were normalized to 18S rRNA using the 2⫺⌬⌬CT method (33) to compare the mRNA expression levels of the individual transporters.
Statistical Analysis
Individual measurements are presented as means ⫾SE, where n indicates the number of experiments. Averaged time courses of pHi
changes from n identical experiments are shown as a solid line representing the mean and dashed lines representing SE. To assess statistical significance, Student’st-test or ANOVA followed by a post hoc Tukey’s test was carried out using Excel and GraphPad Prism 6, respectively. P ⬍ 0.05 was chosen as the threshold for statistical significance. Rates of change in pHiwere estimated by linear regres- sion over a 1-min period during the first 2 min of pHirecovery.
RESULTS
Basolateral Cl⫺/HCO3⫺Exchange
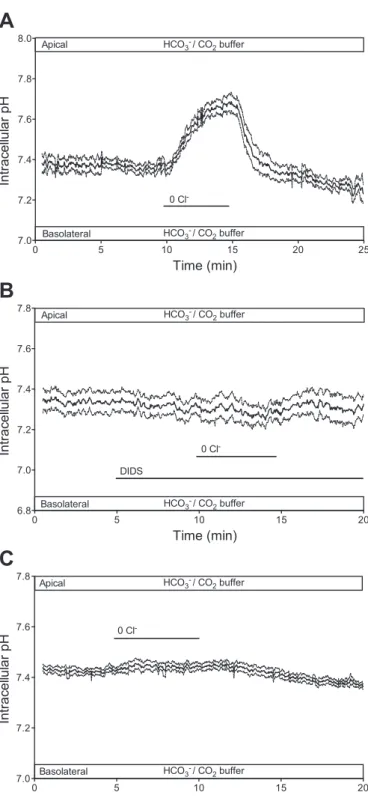
Previous studies on Calu-3 cells indicate that the Cl⫺/HCO3⫺ exchanger AE2 is expressed at the basolateral membrane (16, 34, 55). To confirm this, we studied the effect of removing Cl⫺ from the basolateral perfusate in the presence of HCO3⫺. The expectation was that pHiwould increase as a result of HCO3⫺ uptake via AE2, driven by the reversed Cl⫺ concentration gradient. As shown in Fig. 1A, substitution of basolateral Cl⫺ with gluconate caused a significant increase in pHi (⌬pHi ⫽ 0.27⫾ 0.062,P ⬍0.05, paired Student’st-test).
To determine whether this alkalinization was due to Cl⫺/ HCO3⫺exchange via AE2, the experiment was repeated in the presence of basolateral DIDS, an anion exchanger inhibitor (Fig. 1B). As expected, 100M DIDS completely inhibited the alkalinization [⌬pHi ⫽ ⫺0.04 ⫾ 0.02, n ⫽ 6, P ⬎ 0.05 compared with zero (by 1-sample t-test)], consistent with the presence of a DIDS-sensitive anion exchanger at the basolat- eral membrane.
Apical Cl⫺/HCO3⫺Exchange
The presence or absence of an anion exchanger at the apical membrane of Calu-3 cells has been become the subject of some debate (11, 50, 55). We therefore examined the effect of Cl⫺ substitution in the apical bath solution. Figure 1Cshows that when Cl⫺was replaced with gluconate at the apical membrane, there was no significant increase in pHi (⌬pHi ⫽ 0.038 ⫾
0.023,n⫽ 12,P⬎ 0.05). This suggests that in unstimulated cells there is no measurable anion exchanger activity at the apical membrane.
However, HCO3⫺ secretion by Calu-3 cells is markedly increased in response to cAMP stimulation. To investigate whether an apical exchanger becomes active following eleva- tion of intracellular cAMP, forskolin (10M) and IBMX (100
M) were applied 5 min prior to the Cl⫺substitution period.
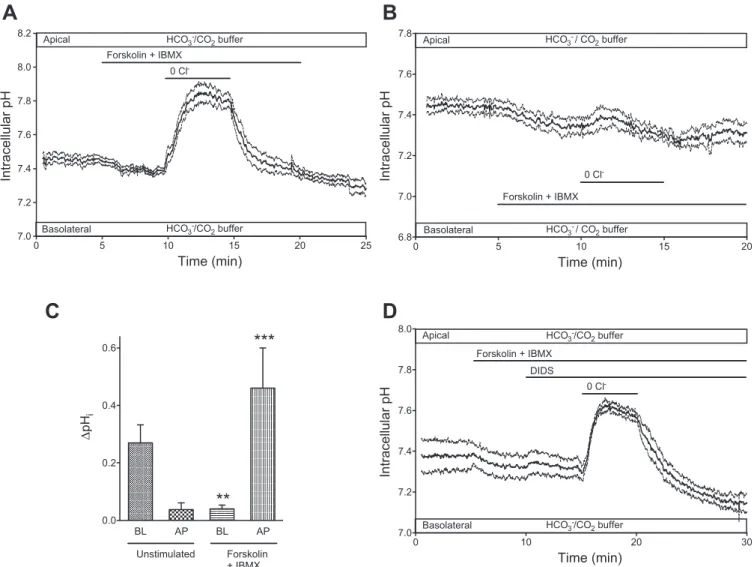
As observed by others (17), cAMP stimulation alone elicited a small drop in pHi to a new steady-state value (⌬pHi ⫽ ⫺0.18⫾ 0.01,n⫽7; Fig. 2). This drop is most likely due to a transient imbalance between the increased HCO3⫺ efflux across the apical membrane and the uptake of HCO3⫺ via Na⫹-HCO3⫺ cotransporter NBC1 (and/or extrusion of H⫹ via Na⫹/H⫹ exchanger NHE1) at the basolateral membrane. A new steady state is only achieved when these fluxes are again balanced at the slightly lower pHivalue.
As shown in Fig. 2A, removal of Cl⫺at the apical membrane of cAMP-stimulated Calu-3 cells resulted in a large increase in pHi(⌬pHi⫽0.46⫾0.14,n⫽9). Conversely, when basolat- eral Cl⫺was substituted (Fig. 2B), the increase in pHithat had been observed in unstimulated conditions (Fig. 1A) was greatly reduced by pretreatment with forskolin and IBMX. Taken at face value, these results, summarized in Fig. 2C, suggest that elevation of intracellular cAMP activates an anion exchanger at the apical membrane and suppresses anion exchange at the basolateral membrane, as reported elsewhere (11).
To investigate whether the alkalinization induced by apical Cl⫺substitution in the stimulated cells was due to the activity of an apical anion exchanger, the cells were pretreated with 100 M DIDS. As shown in Fig. 2D, apical application of DIDS had only a small effect on the alkalinization (⌬pHi ⫽ 0.29⫾0.13, not significantly different from the value obtained in the absence of DIDS). This was in marked contrast to the complete inhibition of basolateral Cl⫺/HCO3⫺ exchange by DIDS shown in Fig. 1B.
One possible explanation for these results is that Calu-3 cells express an apical anion exchanger that is activated by cAMP and is relatively insensitive to DIDS. It could, for example, be a member of the SLC26 family of anion transporters, which are widely expressed at the apical membrane of secretory epithelia.
Selectivity of Anion Exchange at the Apical Membrane Members of the SLC26 family transport a diverse range of monovalent and divalent anions (7, 36). The next series of experiments tested the anion selectivity of the apical anion exchanger in cAMP-stimulated Calu-3 cells. Instead of return- ing Cl⫺ to the apical perfusate after the Cl⫺-free period, alternative anions were applied to determine whether they Table 1. Gene-specific primers used for RT-PCR and real-time quantitative PCR using TaqMan gene expression assays
Gene Assay ID No. Accession No. Amplicon Length, bp
CFTR Hs00357011_m1 NM_000492.3 93
SLC4A2 (AE2) Hs015867776_m1 NM_003040.3 131
SLC26A2 Hs00164423_m1 NM_000112.3 73
SLC26A3 Hs00230798_m1 NM_000111.2 117
SLC26A4 Hs00166504_m1 NM_000441.1 89
SLC26A6 Hs00370470_m1 NM_022911.2, NM_134263.2, NM_134426.2, NM_001040454.1 81
SLC26A7 Hs01104163_m1 NM_134266.1, NM_052832.2 85
SLC26A9 Hs00369451_m1 NM_134325.2, NM_052934.3, NM_001142600.1 67
would support exchange with intracellular HCO3⫺, thereby returning pHito its normal value. As shown in Fig. 3A, I⫺was able to quickly restore pHito normal after gluconate substitu- tion of apical Cl⫺, suggesting that the apical anion exchanger is also able to transport I⫺. The rate of recovery of pHi was
⫺0.13⫾0.027 min⫺1(n⫽6), approximately one-half of the value obtained when Cl⫺was returned to the apical bath (Fig.
3C). In contrast, when gluconate substitution was followed by SO42⫺(Fig. 3B), the recovery of pHiwas much slower (⫺0.025⫾ 0.024 min⫺1,n⫽7).
pHirecovery rates measured with these and other anions are summarized in Fig. 3C. While the monovalent organic anion HCOO⫺ appeared to be as effective as Cl⫺ in supporting exchange with HCO3⫺, virtually no recovery of pHi was ob- served with the divalent organic anion succinate. The selectiv- ity sequence was as follows: Cl⫺⬃HCOO⫺⬎I⫺⬎⬎SO42⫺
⬃ succinate. This suggests that the cAMP-stimulated anion exchanger at the apical membrane of Calu-3 cells is selective to monovalent anions and, unlike most members of the SLC26 family, does not transport SO42⫺.
Inhibitor Sensitivity of Anion Exchange at the Apical Membrane
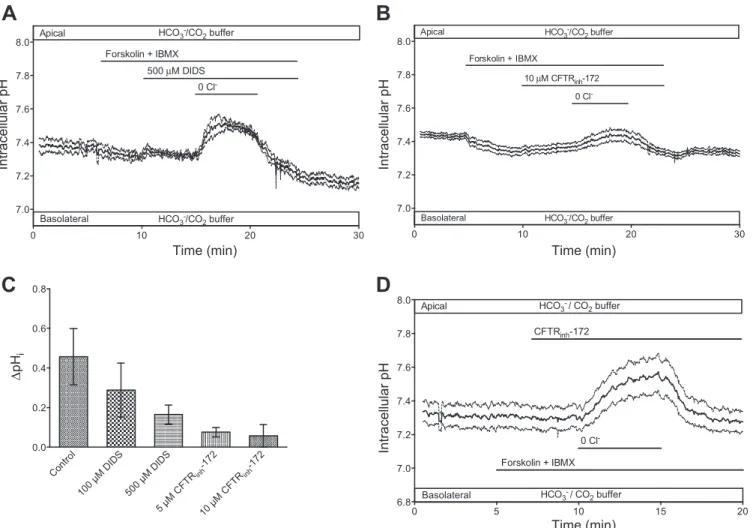
To further characterize the putative apical anion exchanger, we next examined its inhibitor sensitivity. DIDS at 100 M, which totally blocked the basolateral exchanger (Fig. 1B), showed only a small inhibitory effect on the apical exchanger (Fig. 2D). Increasing the concentration of DIDS to 500 M was only slightly more effective (Fig. 4A), suggesting that, whatever the mechanism of apical Cl⫺/HCO3⫺exchange, it is quite insensitive to DIDS.
An alternative pathway for anion movements across the apical membrane of cAMP-stimulated cells could be provided by CFTR. We therefore examined the effect of the CFTR channel blocker CFTRinh-172. In cells stimulated with forsko- lin and IBMX, the addition of CFTRinh-172 (10 M) to the apical membrane substantially reduced the alkalinization evoked by apical Cl⫺ substitution (Fig. 4B). The effects of different concentrations of DIDS and CFTRinh-172 are sum- marized in Fig. 4C. The results suggest that the alkalinization resulting from Cl⫺/HCO3⫺ exchange across the apical mem- brane is markedly dependent on CFTR and might even occur via the channel itself, rather than an associated anion ex- changer.
Unmasking of Basolateral Anion Exchange
Because cAMP stimulation appears to activate Cl⫺/HCO3⫺ exchange at the apical membrane, it is possible that any alkalinization resulting from Cl⫺substitution at the basolateral membrane might be masked by HCO3⫺ efflux at the apical membrane. To test this possibility, we repeated the experiment shown in Fig. 2B in the presence of apical CFTRinh-172 to block apical HCO3⫺conductance. Under these conditions, sub- stitution of basolateral Cl⫺ caused a marked alkalinization (Fig. 4D) that was comparable to the response in the unstimu- lated cells (Fig. 1A). This suggests that stimulation does not inhibit Cl⫺/HCO3⫺exchange via AE2 at the basolateral mem- brane, as previously reported (11, 12). It is, however, consis- tent with the recent suggestion that the basolateral exchanger
0 5 10 15 20 25
7.0 7.2 7.4 7.6 7.8 8.0
Time (min)
Intracellular pH
HCO3- / CO2 buffer HCO3- / CO2 buffer Apical
Basolateral
0 Cl-
A
0 5 10 15 20
6.8 7.0 7.2 7.4 7.6 7.8
Time (min)
Intracellular pH
HCO3- / CO2 buffer HCO3- / CO2 buffer Apical
Basolateral
0 Cl- DIDS
B
0 5 10 15 20
7.0 7.2 7.4 7.6 7.8
Time (min)
Intracellular pH
HCO3- / CO2 buffer HCO3- / CO2 buffer Apical
Basolateral 0 Cl-
C
Fig. 1. Effects of apical and basolateral Cl⫺substitution on intracellular pH (pHi) in unstimulated Calu-3 cells in the presence of HCO3⫺. Cells were superfused with a HCO3⫺-buffered solution, and apical or basolateral Cl⫺was replaced with gluconate.A: changes in pHiin response gluconate replacement of Cl⫺at the basolateral membrane (n⫽7).B: inhibitory effect of DIDS (100
M) on the response to basolateral Cl⫺substitution (n⫽6).C: effect of apical Cl⫺substitution (n⫽12). Solid lines represent averaged pHitime course from nidentical experiments, and dashed lines represent SE. Horizontal bar labeled 0 Cl⫺indicates period of Cl⫺substitution.
contributes to Cl⫺ uptake across the basolateral membrane during stimulated secretion (55).
Expression of SLC26 Transporters
RT-PCR was used to assess the expression of a number of SLC26 transporters that might be responsible for Cl⫺/HCO3⫺ exchange across the apical membrane of Calu-3 cells. Of the 10 members of the SLC26 family, those examined were SLC26A2 (because of its widespread tissue distribution), SLC26A3, SLC26A4, and SLC26A6 (the Cl⫺/HCO3⫺ ex- changers), and SLC26A7 and SLC26A9 (the Cl⫺channels).
As shown in Fig. 5A, 18S rRNA was used as a positive control and reference. CFTR and AE2, which are expected to be abundant in Calu-3 cells, were readily detected by RT-PCR and appeared as strong bands. All the SLC26 gene family members tested were detectable, and their expected PCR prod- uct sizes were confirmed.
The next step was to quantify their mRNA expression relative to other transporters known to be functionally impor-
tant. Using real-time qPCR, the relative mRNA expression levels of the SLC26 family members were compared with CFTR and AE2 after normalization to 18S rRNA.
As shown in Fig. 5B, the qPCR measurements showed only low levels of SLC26 transporter mRNA compared with the much higher levels for CFTR and AE2. Of the SLC26 family members examined, only SLC26A2 and SLC26A6 showed significant levels of mRNA expression at 26.4 ⫾ 7.9% and 11.1 ⫾ 2.6% of the CFTR level, respectively (n ⫽ 6).
SLC26A4 (0.13 ⫾ 0.04%), SLC26A7 (1.5 ⫾ 0.8%), and SLC26A9 (0.08⫾0.02%) showed very low levels of expres- sion compared with CFTR. The CT value of SLC26A3 was undetermined in the qPCR analysis, although the SLC26A3 PCR product was just visible as a very faint band on the gel.
Driving Force for Apical Cl⫺Efflux
For the alkalinization evoked by apical Cl⫺substitution to be sustained (Fig. 2A), there must be continuous uptake of Cl⫺ across the basolateral membrane. Since this is mediated, at
0 5 10 15 20 25
7.0 7.2 7.4 7.6 7.8 8.0 8.2
Time (min)
Intracellular pH
HCO3-/CO2 buffer Apical
Forskolin + IBMX 0 Cl-
HCO3-/CO2 buffer Basolateral
A
0 5 10 15 20
6.8 7.0 7.2 7.4 7.6 7.8
Time (min)
Intracellular pH
HCO3- / CO2 buffer HCO3- / CO2 buffer Apical
Basolateral
0 Cl- Forskolin + IBMX
B
C
BL AP BL AP
0.0 0.2 0.4 0.6
Unstimulated Forskolin + IBMX pHi
***
**
0 10 20 30
7.0 7.2 7.4 7.6 7.8 8.0
Time (min)
Intracellular pH
HCO3-/CO2 buffer Apical
Forskolin + IBMX
0 Cl-
HCO3-/CO2 buffer Basolateral
DIDS
D
Fig. 2. Effects of apical and basolateral Cl⫺substitution on pHiin cAMP-stimulated Calu-3 cells. Cells were superfused with a HCO3⫺-buffered solution and stimulated with 10M forskolin and 100M IBMX.A: changes in pHievoked by gluconate substitution of Cl⫺at the apical membrane (n⫽9).B: effects of basolateral Cl⫺substitution (n⫽4).C: changes in pHievoked by basolateral (BL) and apical (AP) Cl⫺substitution in unstimulated and forskolin-stimulated cells. Values are means⫾SE. **P⬍0.01, ***P⬍0.001 compared with unstimulated control (by Student’st-test).D: lack of effect of DIDS (100M) on the response of stimulated cells to apical Cl⫺substitution (n⫽4). InA, B, andD, solid lines represent averaged pHitime course fromnidentical experiments and dashed lines represent SE.
least in part, by the basolateral Na⫹-K⫹-2Cl⫺ cotransporter NKCC1, we examined the effect of applying the NKCC1 inhibitor bumetanide (300 M) at the basolateral membrane.
As shown in Fig. 6A, pretreatment with bumetanide halved the initial magnitude of the alkalinization (⌬pHi ⫽ 0.18⫾ 0.03) compared with Fig. 2A (⌬pHi ⫽ 0.46 ⫾ 0.14), and the pHi
declined slowly during the substitution period.
An additional pathway for Cl⫺uptake across the basolateral membrane is provided by the AE2 Cl⫺/HCO3⫺ exchanger working in parallel with the transporters that accumulate in- tracellular HCO3⫺, namely, NBC1 and NHE1. Since AE2 is inhibited by 100M DIDS, this was applied, in combination with bumetanide, to block both uptake pathways in the exper- iment shown in Fig. 6B. Although an initial alkalinization was observed, it was transient and vanished in ⬍5 min. The most straightforward interpretation of these results is that Cl⫺ up- take across the basolateral membrane via NKCC1, and espe- cially AE2, is vital for sustaining the alkalinization observed during apical Cl⫺ substitution.
Driving Force for Apical HCO3⫺Influx
In forskolin-stimulated cells, CFTR provides a major path- way for Cl⫺ efflux across the apical membrane. How could CFTR alone mediate what appears to be Cl⫺/HCO3⫺exchange at the apical membrane? After gluconate substitution of apical Cl⫺, rapid Cl⫺ efflux will inevitably depolarize the apical membrane, and this depolarization could, if large enough, reverse the normally outwardly directed electrochemical gra- dient for HCO3⫺. Given that CFTR is also permeable to HCO3⫺, this could result in simultaneous entry of HCO3⫺and efflux of Cl⫺ via CFTR, and this might account for the alkalinization and its sensitivity to CFTRinh-172.
To test the feasibility of this hypothetical mechanism, we examined the effect of hyperpolarizing the cells by applying the K⫹ channel opener 5,6-dichloro-1-ethyl-1,3-dihydro-2H- benzimidazol-2-one (DCEBIO; 10M) on the basolateral side (6). As shown in Fig. 6C, although the initial alkalinization response to apical Cl⫺ removal was similar to that observed under control conditions (Fig. 2A), it was not sustained. This suggests that the driving force for HCO3⫺ entry across the apical membrane had been reduced, which is what we would expect if the depolarizing effect of Cl⫺efflux had been coun- teracted by the hyperpolarizing effect of DCEBIO.
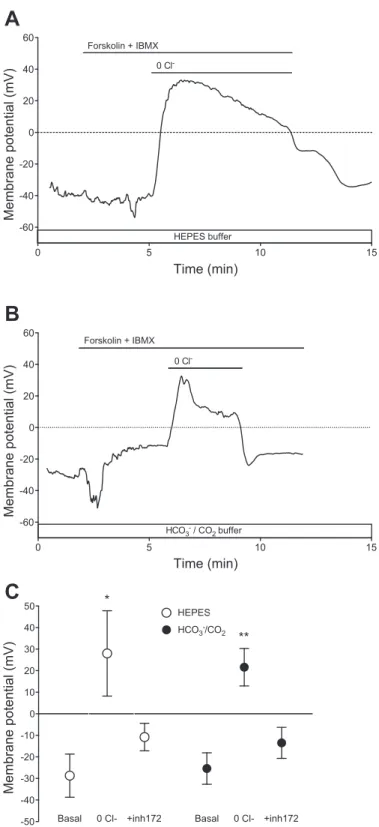
To estimate the magnitude of the depolarization that was induced by substituting Cl⫺in the bath, we used the perforat- ed-patch technique to measure the associated membrane po- tential changes in Calu-3 cells freshly isolated from fully differentiated, polarized monolayers. The resting potential of cells bathed in the HEPES-buffered solution was⫺28.7⫾10.0 mV (n ⫽ 12). When the Cl⫺ in the bathing medium was replaced with gluconate during forskolin stimulation (Fig. 7A), the membrane potential depolarized rapidly, presumably as a result of Cl⫺efflux via CFTR, and reversed to⫹28.0⫾19.8 mV (n⫽6,P⬍0.05). It then repolarized slowly, probably as a result of the gradual depletion of intracellular Cl⫺, since these isolated cells were completely bathed in the Cl⫺-free solution.
In cells bathed with the HCO3⫺-buffered solution, the resting membrane potential (⫺25.4 ⫾ 7.3 mV, n ⫽ 12) was not significantly different from that in cells bathed with the
0 5 10 15 20 25
7.0 7.2 7.4 7.6 7.8 8.0
Time (min)
Intracellular pH
HCO3-/CO2 buffer Apical
Forskolin + IBMX 0 Cl-
HCO3-/CO2 buffer Basolateral
Sulfate
B
C
Cl- I- SO42- HCOO- Succ- 0.0
0.1 0.2 0.3 0.4 0.5
a
b
c a,b
c
-dpHi / dt (min-1)
0 5 10 15 20 25
7.0 7.2 7.4 7.6 7.8
8.0 Apical HCO3-/CO2 buffer Forskolin + IBMX
0 Cl-
HCO3-/CO2 buffer Basolateral
Iodide
Time (min)
Intracellular pH
A
Fig. 3. Anion selectivity of recovery of pHifrom alkalinization induced by substitution of apical Cl⫺. Cells were superfused with a HCO3⫺-buffered solution and stimulated with 10M forskolin and 100M IBMX.AandB:
after 5 min of Cl⫺substitution with gluconate, gluconate was replaced by I⫺ and SO42⫺. Solid lines represent averaged pHi time course from 6 and 7 experiments, respectively, and dashed lines represent SE. C: initial rates of recovery of pHi(dpHi/dt) when apical gluconate was replaced by Cl⫺, I⫺, SO42⫺, HCOO⫺, and succinate (Succ⫺). Values are means⫾ SE fromⱖ6 experiments.a,bandcindicate groups identified by post hoc Tukey’s test as statistically distinct from each other (P⬍0.05).
HEPES-buffered solution. Stimulation with forskolin and IBMX caused a transient hyperpolarization (Fig. 7B), which could be due to electrogenic HCO3⫺ uptake via NBC1, as previously observed in pancreatic duct cells (24). Substitution of extracellular Cl⫺ with gluconate again caused a rapid depolarization and reversal to a positive membrane potential (⫹21.6⫾8.7 mV,n⫽4,P⬍0.01). After partial repolariza- tion, membrane potential remained markedly depolarized (⫹13.6 ⫾ 7.4 mV after 2 min) before returning to its initial value when Cl⫺ was restored to the bath. When these experi- ments were repeated in the presence of 10 M CFTRinh-172, the voltage change induced by Cl⫺ substitution was greatly reduced, and there was no reversal of the membrane potential (Fig. 7C). This indicates that the changes in membrane poten- tial evoked by Cl⫺ substitution were due to Cl⫺ efflux via CFTR, rather than another electrogenic pathway.
The key finding here is that, during Cl⫺ substitution, the membrane potential increased sufficiently to reverse the elec- trochemical gradient for HCO3⫺ and, therefore, would drive HCO3⫺ entry through CFTR channels. HCO3⫺ entry by this mechanism, which was not excluded in previous studies, could
explain the intracellular alkalinization evoked by apical Cl⫺ substitution in polarized Calu-3 monolayers. It would also account for the acute sensitivity of the intracellular alkaliniza- tion to CFTRinh-172 and the fact that we have been unable to detect significant AE or SLC26 activity at the apical mem- brane.
DISCUSSION
A standard experimental approach for detecting Cl⫺/HCO3⫺ exchange across cell membranes is to substitute extracellular Cl⫺ with a nontransported anion, such as gluconate, and to record the resulting change in pHi. This method has been used to characterize anion exchangers in a wide range of polarized and unpolarized cells (2, 56, 58, 61). The assump- tion is that if a Cl⫺/HCO3⫺ exchanger is present, sudden reversal of the Cl⫺ gradient will drive intracellular Cl⫺ out of the cell in exchange for extracellular HCO3⫺, and the resulting entry of HCO3⫺ will cause a rise in pHi. However, the same phenomenon can arise as a result of electrically coupled Cl⫺and HCO3⫺movements through an anion chan-
0 10 20 30
7.0 7.2 7.4 7.6 7.8
8.0 Apical HCO3-/CO2 buffer Forskolin + IBMX
0 Cl-
HCO3-/CO2 buffer Basolateral
500 µM DIDS
Time (min)
Intracellular pH
A
C
Cont rol
100 µM DIDS
500 µM DIDS
5 µM CFTR inh
-172
10 µ M CFTR
inh -172 0.0
0.2 0.4 0.6 0.8
pHi
0 10 20 30
7.0 7.2 7.4 7.6 7.8
8.0 Apical HCO3-/CO2 buffer Forskolin + IBMX
0 Cl- 10 µM CFTRinh-172
HCO3-/CO2 buffer Basolateral
Time (min)
Intracellular pH
B
0 5 10 15 20
6.8 7.0 7.2 7.4 7.6 7.8 8.0
HCO3- / CO2 buffer HCO3- / CO2 buffer Apical
Basolateral
0 Cl- Forskolin + IBMX
CFTRinh-172
Intracellular pH
Time (min)
D
Fig. 4. Effects of DIDS and CFTRinh-172 on pHichanges evoked by apical Cl⫺substitution in cAMP-stimulated Calu-3 cells. Cells were superfused with a HCO3⫺-buffered solution and stimulated with 10M forskolin and 100M IBMX.A: changes in pHievoked by gluconate substitution of Cl⫺at the apical membrane in the presence of 500M DIDS (n⫽4).B: effects of apical Cl⫺substitution in the presence of 10M CFTRinh-172 (n⫽4).C: effects of different concentrations of DIDS and CFTRinh-172 on pHichanges evoked by apical Cl⫺substitution. Values are means⫾SE. All are significantly different from control (P⬍0.05, by Student’s unpairedt-test).D: effect of apical CFTRinh-172 (10M) on pHichanges evoked by basolateral Cl⫺substitution in forskolin-stimulated cells (n⫽5). InA, B, andD, solid lines represent averaged pHitime course fromnidentical experiments and dashed lines represent SE.
nel such as CFTR, and this possibility was not excluded in previous studies of Calu-3 cells (11, 12).
At first sight, the Cl⫺ substitution data presented here suggest that unstimulated Calu-3 cells show Cl⫺/HCO3⫺ ex- change at the basolateral membrane, but not at the apical membrane. After forskolin stimulation, Cl⫺/HCO3⫺ exchange at the basolateral membrane disappeared, and brisk Cl⫺/HCO3⫺ exchange became evident at the apical membrane. The sim- plest interpretation of these data is that elevated cAMP inhibits the basolateral exchanger, known to be AE2 (34), and activates a different exchanger, possibly a member of the SLC26 family, at the apical membrane. Indeed, this was our conclusion when we first reported our preliminary results (35). It is also the conclusion of a more recent study by Garnett et al. (11).
Similar to our findings, Garnett et al. attributed the apical Cl⫺/HCO3⫺exchange in cAMP-stimulated Calu-3 cells to the SLC26 transporter pendrin (SLC26A4). This was based mainly on its selectivity to monovalent anions and its insensitivity to inhibition by DIDS.
A
M 18S CFTR AE2 A2 A3 A4 A6 A7 A9 SLC26
B
CFTR AE2 A2 A3 A4 A6 A7 A9
0.00 0.02 0.04 0.06 0.08
Relative mRNA expression
SLC26
*** ***
Fig. 5. mRNA expression of anion transporters in polarized Calu-3 cells assessed by quantitative RT-PCR.A: agarose gel showing products of con- ventional RT-PCR using the primers listed in Table 1. 18S rRNA was used as the endogenous control gene reference, and the strong single band indicates that the cDNA was of good quality. RT-negative control lanes (⫺), omitting the RT step, confirm the absence of contamination. B: quantitative PCR measurements of mRNA expression normalized to 18S rRNA. Relative mRNA expression was calculated by the cycle threshold (2⫺⌬⌬CT) method (33). Values are means ⫾ SE from 6 experiments. Analysis of variance indicated that mRNA expression levels of each of the solute carrier family 26 (SLC26) transporters (A2, A3, A4, A6, A7, and A9) differed significantly from CFTR and anion exchanger 2 (AE2) (P⬍0.001) and that SLC26A2 and SLC26A6 transcripts were present at significantly higher levels than the other SLC26 transporters. ***P⬍0.001.
0 5 10 15 20 25 30
6.8 7.0 7.2 7.4 7.6 7.8 8.0
HCO3- / CO2 buffer HCO3- / CO2 buffer Apical
Basolateral
0 Cl- Forskolin + IBMX
Bumetanide DIDS
Time (min)
Intracellular pH
B
0 5 10 15 20 25
6.8 7.0 7.2 7.4 7.6 7.8 8.0 8.2
Time (min)
Intracellular pH
HCO3- / CO2 buffer HCO3- / CO2 buffer
Basolateral
0 Cl- Forskolin + IBMX
DCEBIO Apical
C
0 5 10 15 20 25 30
6.8 7.0 7.2 7.4 7.6 7.8 8.0
HCO3- / CO2 buffer HCO3- / CO2 buffer Apical
Basolateral
0 Cl- Forskolin + IBMX
Bumetanide
Time (min)
Intracellular pH
A
Fig. 6. Alkalinization evoked by apical Cl⫺substitution in forskolin-stimulated Calu-3 cells is dependent on basolateral Cl⫺uptake and membrane potential.
Cells were superfused with the HCO3⫺-buffered solution, stimulated with forskolin and IBMX, and exposed to a Cl⫺-free solution at the apical surface.
A: effect of pretreatment with bumetanide (300M) to inhibit the basolateral Na⫹-K⫹-2Cl⫺cotransporter 1 (NKCC1;n⫽5).B: effect of pretreatment with DIDS (100M), in addition to bumetanide, to inhibit basolateral AE2 and NKCC1 (n⫽5).C: effect of the K⫹channel opener 5,6-dichloro-1-ethyl-1,3- dihydro-2H-benzimidazol-2-one (DCEBIO, 10M) to hyperpolarize the cells (n ⫽ 4). Solid lines represent averaged pHitime course fromn identical experiments, and dashed lines represent SE.