Comparison of the “ Real-life ” Diagnostic Value of Two Recently Published Electrocardiogram Methods for the Differential Diagnosis of Wide QRS Complex Tachycardias
Zsuzsanna Szelenyi, MD, Gabor Duray, MD, PhD, Gabor Katona, MD, Gabor Frituz, MD, Eszter Szego,} MD, Enik}o Kovacs, MD, Gabor Szenasi, PhD, and Andras Vereckei, MD, PhD
Abstract
Objectives:The diagnostic values of the aVR lead or“Vereckei algorithm,” and the lead II R-wave peak time (RWPT) criterion, recently devised for the differential diagnosis of wide QRS complex tachycardias (WCTs), were compared.
Methods: A total of 212 WCTs (142 ventricular tachycardias [VTs], 62 supraventricular tachycardias [SVT], and eight preexcitation SVTs) from 145 patients with proven electrophysiologic diagnoses were retrospectively analyzed by seven examiners blinded to the electrophysiologic diagnoses.
Results:The overall test accuracy of the Vereckei algorithm was superior to that of the RWPT criterion (84.3% vs. 79.6%; p=0.0003). The sensitivity of the Vereckei algorithm for VT diagnosis was greater than that of RWPT criterion (92.4% vs. 79.1%; p<0.0001). The negative predictive value (NPV) for the Vereckei algorithm was also greater (77.8%; 95% confidence interval [CI]=73.6% to 82.1%) than that of the RWPT criterion (61.6%; 95% CI=57.6% to 65.6%). The specificity of the Vereckei algorithm was lower than that of the RWPT criterion (64.7% vs. 80.9%; p<0.0001). The positive predictive value (PPV) was also lower for the Vereckei algorithm (86.4%; 95% CI=84.4% to 88.4%) than for the RWPT criterion (90.9%; 95% CI=89.1% to 92.8%). Incorrect diagnoses made by the Vereckei algorithm were mainly due to misdiagnosis of SVT as VT (65.7% of cases), and those made by the RWPT criterion were due to the more dangerous misdiagnosis of VT as SVT (72.5% of cases).
Conclusions:The Vereckei algorithm was superior in overall test accuracy, sensitivity, and NPV for VT diagnosis and inferior in specificity and PPV to the RWPT criterion. All of these parameters were lower in“real life”than those reported by the original authors for each of the particular electrocardiographic methods.
ACADEMIC EMERGENCY MEDICINE 2013; 20:1121–1130©2013 by the Society for Academic Emergency Medicine
E
lucidation of the mechanism of sustained, mono- morphic wide QRS complex tachycardia (WCT) is a common diagnostic dilemma for the emer- gency physician. When confronted with the 12-lead WCT electrocardiogram (ECG), a correct diagnosis is vital not only for acute dysrhythmia treatment, but for further prognosis and subsequent work-up, as well as management. Because ventricular tachycardia (VT) and supraventricular tachycardia (SVT) with aberrant intra-ventricular conduction account for the vast majority of WCTs (80 and 15% to 20%, respectively), the clinically relevant problem is the distinction of VT from SVT with aberrant intraventricular conduction (SVT-A) in the dif- ferential diagnosis of WCTs. Other rare causes of WCT, such as SVT with anterograde conduction over an accessory pathway (preexcitation SVT), drug toxicity, electrolyte disorders (hyperkalemia), ventricular paced rhythm, or ECG artifact, account for only a small
From the Heart Center (ZS), the Department of Medicine (GK, AV), the Department of Anesthesiology and Intensive Therapy (GF, ES, EK), and the Institute of Pathophysiology (GS), Semmelweis University, Budapest, Hungary; and the Department of Car- diology, National Health Center (GD), Budapest, Hungary.
Received March 10, 2013; revisions received April 29 and May 23, 2013; accepted May 28, 2013.
The authors have no relevantfinancial information or potential conflicts of interest to disclose.
Supervising Editor: Brian C. Hiestand, MD, PhD.
Address for correspondence and reprints: Andras Vereckei, MD, PhD; e-mail: vereckei@kut.sote.hu.
doi: 10.1111/acem.12247 PII ISSN 1069-6563583 1121
©2013 by the Society for Academic Emergency Medicine ISSN 1069-6563 1121
minority (1% to 5%) of WCTs.1–5However, these num- bers reflect the relative frequency of underlying causes of WCT obtained from studies of consecutive patients with WCT referred to electrophysiologic testing centers.
Thus, the great preponderance of VT as the underlying cause of WCT might reflect the bias of difficult cases referred to electrophysiologic testing centers. Accord- ing to some observations, the emergency physician might encounter VT less frequently and more commonly encounter other underlying causes of WCT in the emer- gency department.6
The ECG remains the cornerstone of distinguishing SVT-A from VT. Numerous ECG criterion and algo- rithms have been published for the differential diagno- sis of WCTs, including the landmark publications of Sandler and Marriott,7 Swanick et al.,8 and Marriott and Sandler,9in 1965, 1966, and 1972; Wellens et al. in 197810; Coumel et al. in 198411; Kindwall et al. in 198812; and Brugada et al. in 199113; as well as the most recent publications of Vereckei et al.14,15 and Pava et al.16 Using all of these ECG methods, an accurate diagnosis is now possible in about 90% of WCTs.17–19 A certain ECG diagnosis of the WCT mechanism obviates the need for a subsequent expensive and invasive electro- physiologic study. However, overreliance on ECG algo- rithms and criteria may be potentially dangerous, because they still misdiagnose the underlying cause of WCTs in up to 10% of cases. It seems prudent to con- sider and treat all sustained, regular WCTs as VT unless the diagnosis of SVT can be definitely established, because it is far better to be wrong with a few cases of SVT treated as VT than the reverse situation,1,14 since treating a VT as SVT may result in potentially disastrous consequences (e.g., intravenous [IV] verapamil injection may cause severe hypotension and/or VT acceleration and ventricularfibrillation20,21). When ECG methods for WCT differentiation were applied by physicians, the reported diagnostic accuracy of a particular ECG method is usually lower than that reported by the origi- nal authors.22–27 Therefore, we sought to compare the diagnostic value of two recently published simple ECG methods, the aVR lead “Vereckei algorithm,”15 and the lead II R-wave peak time (RWPT) criterion,16 for differ- ential diagnosis of WCTs in“real life.”
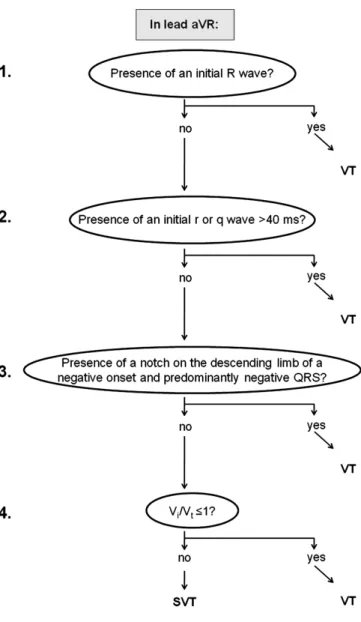
Figure 1 shows the lead aVR Vereckei algorithm, which contains two new criteria: 1) the vi/vt criterion based on the estimation of initial (vi) and terminal (vt) ventricular activation velocity ratio (vi/vt) and 2) the presence of an initial R wave in lead aVR.
The rationale behind the vi/vt criterion is that during WCT due to SVT, the initial activation of the septum (occurring either left-to-right or right-to-left) should be invariably rapid over the normal His-Purkinje system, and the intraventicular conduction delay causing the wide QRS complex occurs in the mid to terminal part of the QRS, thus the vi/vt >1 during SVT. During WCT due to VT, however, an initial slower muscle-to-muscle spread of activation occurs until the impulse reaches the His-Purkinje system, after which the rest of the ventric- ular muscle is more rapidly activated, thus, the vi/vt≤ 1 during VT. This assumption should hold true regardless of the mechanism of VT or presence or absence of structural heart disease.
The presence of an initial R wave in lead aVR is similar to the traditional northwest axis criterion, which suggests VT, but is not the same, because the range of the resultant QRS vector that yields an initial R wave in lead aVR is between –60 and +120 degrees.
The initial ventricular activation wavefront during SVT and sinus rhythm should go away from lead aVR, yielding a negative QRS complex (an rS complex in lead aVR may be present as a normal variant or in patients with inferior myocardial infarction due to loss of initial inferiorly directed forces, but with an R/S ratio<1). Thus, an initial dominant R wave (such as R or Rs complex) in lead aVR should not be present in SVT-A and suggests VT.
The principle on which the lead II RWPT criterion is based is that most VTs (myocardial VTs) are associated with slow initial ventricular activation close to the site of origin due to slow muscle-to-muscle conduction, resulting in a more significantly prolonged QRS dura- tion or time to the intrinsicoid deflection when the mechanism of WCT is VT versus SVT.
Figure 1. The aVR Vereckei algorithm. SVT=supraventricular tachycardia; VT=ventricular tachycardia.
METHODS Study Design
This was a retrospective cohort study, in which 12-lead ECG tracings of WCTs from patients with proven elec- trophysiologic diagnosis were analyzed by board-certi- fied cardiologists and emergency physicians as well as internal medicine, emergency medicine, and cardiology residents blinded to the electrophysiologic diagnoses and the patients’ clinical data. The study complies with the Declaration of Helsinki. An informed consent exemption was obtained from the Indianapolis Univer- sity Institutional Review Board for this analysis of a deidentified data set.
Study Setting and Population
A subset of 12-lead ECGs (212 tracings out of the total 483 tracings) recorded from consecutive patients during electrophysiologic studies conducted from June 1998 to June 2005 at Indiana University (those with clearly established electrophysiologic diagnoses) were evalu- ated. The same recordings were used in our previous studies.14,15 The 12-lead ECG printouts were sent to us in series (series“A,” “B,” “C,”etc.) during the study and we selected two series (series “B” and “C”) containing sufficient tracings (the chosen 212 tracings that were recorded from consecutive patients) for this study. A total of 212 regular WCT ECGs (142 VTs, 62 SVTs, and eight preexcitation SVTs), recorded from 145 consecu- tive patients out of the total 287 consecutive patients, were retrospectively analyzed by seven observers blinded to the electrophysiologic diagnoses and patients’clinical data.
Study Protocol
WCT was defined as a rhythm with a rate of ≥100 beats/min and a QRS duration of ≥120 milliseconds.
Only regular, monomorphic WCTs were analyzed.
Despite the fact that preexcitation SVT is an SVT by mechanism, preexcitation SVT behaves as a VT origi- nating from the base of the ventricles both electrophysi- ologically and regarding its ECG morphology. For this reason, and because neither of the two ECG methods used in this study, nor other ECG methods for WCT dif- ferentiation, are able to differentiate preexcitation SVT from VT unless atrioventricular dissociation is present, when the mechanism of WCT was preexcitation SVT, we considered a final VT diagnosis correct and an SVT diagnosis incorrect.15,28
The reviewers were given complete 12-lead standard ECGs obtained during tachycardia for analysis. The WCT ECG tracings were obtained from all kinds of patients with and without structural heart disease, pre- existent bundle branch block, or antiarrhythmic drug treatment. Before examiners started to evaluate the study ECGs, they all were provided with copies of the published articles about the two ECG methods to be used and received brief training on a different set of 30 ECGs to elucidate the potential pitfalls and caveats in the application of the two ECG methods. The distribu- tion of the seven examiners was the following: two board-certified cardiologists, two board-certified emer- gency physicians, one emergency medicine resident,
one internal medicine resident, and one cardiology fellow who recently finished residency in internal med- icine and started fellowship in cardiology.
The aVR Vereckei algorithm arrived at a diagnosis of VT and the analysis was stopped if any of the following criteria was met in lead aVR: 1) an initial R wave was present, 2) the QRS started with an r or q wave of>40 millisecond width, or 3) there was a notch on the down- sloping limb of a predominantly negative QRS with a negative onset. When none of the first three criteria were met, in the fourth step we estimated the initial (vi) and terminal (vt) ventricular activation velocity ratio (vi/ vt) by measuring the distance in mV the impulse trav- eled vertically during the initial (vi) and terminal 40 mil- liseconds (vt) of the QRS complex. In the fourth step, when the vi/vt was ≤1 the diagnosis of VT was made and if the vi/vt was >1 the diagnosis of SVT. Figures 2 and 3 show examples of how to apply the aVR Vereckei algorithm. For more details see the original publica- tion.15The RWPT criterion suggested VT if the interval from the QRS onset to the peak of the first positive or negative wave was ≥50 milliseconds in lead II, and it suggested SVT if the interval was <50 milliseconds (see Figures 4 and 5). For further details see the original publication.16 The accurate determination of the onset and end of the QRS complex is very important for the proper application of the ECG methods. The onset and end of the QRS were defined by determination of the earliest and latest ventricular depolarization, respec- tively, in the three simultaneously recorded limb leads (aVR, aVL, aVF; or I, II, III).
Data Analysis
Occurrence of true as well as false-positive and -negative results, as well as sensitivity and specificity, were com- pared between two ECG methods by first constructing 292 tables demonstrating where the two ECG methods agreed or disagreed. Thereafter, the nonparametric McNemar’s test was used to compare two related pro- portions, to determine which ECG method was better.
SPSS 13 for Windows software package (IBM SPSS, Armonk, NY) was used for statistical analysis. A p<0.05 value was considered statistically significant. The type I error rate was not adjusted for multiple testing of the same variables. The above-described method was not suitable for the comparison of the predictive values, because the denominators for the two ECG methods dif- fer (unlike specificity and sensitivity, in which the denom- inators are the same). Lacking an entirely appropriate statistical method to compare the predictive values, these are presented simply with 95% confidence intervals (CIs) without statistical comparison. A significant between- groups difference in ECG methods is suggested by disjoint (nonoverlapping) CIs. Some patients are in the data set more than once (several VTs with different mor- phology were induced in some patients, while a few had WCTs due to both SVT and VT during the same electro- physiologic study). Because these episodes behaved as independent, unrelated events, they were analyzed as different WCT tracings in the study.
The kappa statistic was performed to determine interobserver agreement using the SAS statistical soft- ware package (SAS Software Release 6.12, SAS Institute
Inc., Cary, NC). Overall interobserver agreement was defined as near complete if j>0.8, good if j =0.61 to 0.8, moderate if j =0.41 to 0.6, fair if j=0.21 to 0.4, and poor ifj <0.2.29
RESULTS
Patient Characteristics
The patients were younger in the preexcitation SVT and SVT groups than in the VT group, and far more patients had structural heart disease and histories of prior myo- cardial infarction or cardiomyopathy in the VT group than in the preexcitation SVT and SVT groups (see Table 1). No patient in the preexcitation SVT group and fewer patients in the SVT group took antiarrhythmic drugs than in the VT group. There were more females in the SVT group than in the two other groups, and 20% to 30% of the baseline ECG tracings showed pre- existing bundle branch block in both the SVT and VT groups.
Overall Test Accuracy
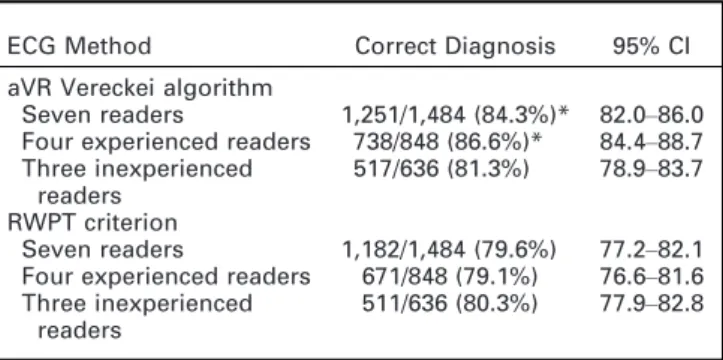
The results are shown in Table 2. The seven examiners together correctly classified 1,251 of 1,484 (84.3%) WCT
tracings using the aVR Vereckei algorithm and 1,182 out of 1,484 (79.6%) WCT tracings with the lead II RWPT criterion. The mean overall test accuracy of the aVR Vereckei algorithm was superior to that of the lead II RWPT criterion (p=0.0003). In a post hoc analysis, the seven observers were divided into subgroups of experienced observers (four board-certified physicians) and inexperienced observers (three residents). The experienced observers achieved a significantly better mean overall test accuracy with the aVR Vereckei algo- rithm than with the lead II RWPT criterion (738 of 848, or 86.6% vs. 671 of 848, or 79.1%; p<0.001), while the inexperienced observers obtained similar mean overall test accuracy with the two ECG methods (517 of 636, or 81.3% vs. 511 of 636, 80.3%, p=0.68). The mean overall test accuracy obtained by the seven observers with the aVR Vereckei algorithm was lower in the current study than in the original article (84.3% vs. 90.3%). Overall test accuracy was not published for the lead II RWPT criterion in the original article.
The incorrect diagnoses (233 of 1,484; 15.7%) were mostly due to SVTs misdiagnosed as VTs (153 of 233;
65.7%) by the seven observers together using the aVR Vereckei algorithm. In contrast, the incorrect diagnoses Figure 2. Examples for the positivity of the first three steps of the new aVR algorithm. The figure demonstrates three different wide QRS tachycardia WCT ECGs where one of the first three steps of the new aVR algorithm was positive (i.e., suggested a diagnosis of VT). Only the simultaneously recorded leads aVR, aVL, and aVF are shown from each 12-lead ECG. In the left panel an initial R-wave is present in lead aVR; thus the first step suggests VT. The crossing point of the vertical line with the contour of the last QRS denotes the onset of the QRS. In the middle panel an rS complex is seen in lead aVR, with an R-wave width of 70 milliseconds; therefore, the second step of the algorithm suggests VT. The right panel displays a notch on the downstroke of a negative onset and predominantly negative QRS; thus VT is diagnosed in the third step. The crossing points of the two vertical lines with the contour of the sixth QRS complex mark the onset and end of the QRS. Reproduced, with permission, from Vereckei A, Duray G, Szenasi G, Altemose GT, Miller JM. A new algorithm using only lead aVR for the differential diagnosis of wide QRS complex tachycardia. Heart Rhythm 2008;5:89–98.15 ECG=electrocardiogram; SVT=supraventricular tachycardia; VT=ventricular tachycardia; WCT = wide QRS complex tachycardia.
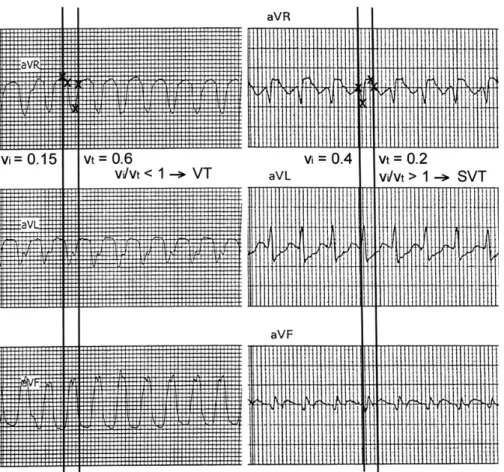
Figure 3. The use of vi/vtcriterion in the fourth step of the new aVR algorithm. In both panels the crossing points of the vertical lines with the QRS contour in lead aVR show the onset and end of the QRS complex in lead aVR. The crossing points and initial and terminal 40 milliseconds of the chosen QRS complex are marked by small crosses. In the left panel, during the initial 40 milli- seconds of the QRS the impulse traveled vertically 0.15 mV; therefore, the vi=0.15 and during the terminal 40 milliseconds of the QRS the impulse traveled vertically 0.6 mV; therefore, the vt=0.6, and thus the vi/vt<1 yields a diagnosis of VT. In the right panel the vi=0.4 and vt=0.2 determined the same way as in the left panel, and thus vi/vt>1 suggests a diagnosis of SVT. Reproduced, with permission, from Vereckei A, Duray G, Szen asi G, Altemose GT, Miller JM. A new algorithm using only lead aVR for the differ- ential diagnosis of wide QRS complex tachycardia. Heart Rhythm 2008;5:89–98.15VT=ventricular tachycardia; SVT=supraventricu- lar tachycardia; WCT=wide QRS complex tachycardia.
Figure 4. The use of the lead II RWPT criterion. (A) Twelve-lead WCT tracing recorded from a patient with SVT and a right bundle branch block pattern. (B) Magnified view of lead II fromA. The RWPT, which is the interval between the two vertical arrows, was
<50 milliseconds; thus SVT diagnosis was made with the lead II RWPT criterion. RWPT=R-wave peak time; SVT=supraventricular tachycardia; WCT=wide QRS complex tachycardia.
(302 of 1,484; 20.4%) were mostly due to VTs misdiag- nosed as SVTs (219 of 302; 72.5%) by the seven observ- ers together using the lead II RWPT criterion, which is the more dangerous type of misclassification. The diag- nosis was established in the first step in approximately 25% of the cases and in the fourth step in 50% to 60%
of WCTs using the aVR Vereckei algorithm, although there was some variation among the observers.
Sensitivity, Specificity, and Predictive Values
Table 3 demonstrates the sensitivity, specificity, and predictive values of the two ECG methods. Because only two final diagnoses (VT or SVT) were possible with the ECG methods used, the specificity and positive predic- tive value (PPV) for VT diagnosis were the same as the sensitivity and negative predictive value (NPV) for SVT diagnosis (respectively), and inversely, the sensitivity
and NPV for VT diagnosis were the same as the speci- ficity and PPV for SVT diagnosis (respectively). For this reason only data for VT diagnosis are reported, which can be applied accordingly for the appropriate parame- ters in SVT diagnosis (Table 3). The seven observers together, as well as the experienced and inexperienced observers subgroups, achieved significantly superior sensitivity and inferior specificity for VT diagnosis using the aVR Vereckei algorithm compared with the lead II RWPT criterion.
The mean PPV for VT diagnosis reached by the seven observers together was significantly greater for the lead II RWPT criterion than that for the aVR Vereckei algo- rithm. However, there was no difference in the PPVs for the lead II RWPT criterion compared with that for the aVR Vereckei algorithm in the experienced or in the Figure 5. The use of the lead II RWPT criterion. (A) Twelve-lead WCT tracing recorded from a patient with VT and left bundle branch block pattern. (B) Magnified view of lead II fromA. The RWPT, which is the interval between the two vertical arrows, was
≥50 milliseconds; thus VT diagnosis was made with the lead II RWPT criterion. RWPT=R-wave peak time; VT=ventricular tachy- cardia; WCT=wide QRS complex tachycardia.
Table 1
Clinical Characteristics
Characteristic SVT VT
Preexcitation SVT
WCT ECG tracings,n 62 142 8
Patients,n 58 79 8
Age (yr), mean (SD) 44 (19) 54 (18) 39 (21)
Female/male 25/33 14/65 1/7
Antiarrhythmic drugs,%* 5 44 0
Preexisting bundle branch block†
29 25 0
Past history*
Post MI,% 2 44 0
Cardiomyopathy,% 3 15 0
No structural heart
disease,% 91 39 100
*% of patientn.
†% of WCT ECG tracingsn.
ECG=electrocardiogram; MI=myocardial infarction;
SVT=supraventricular tachycardia; VT=ventricular tachy- cardia; WCT=wide QRS complex tachycardia.
Table 2
The Percentage of Correct Diagnoses (Overall Test Accuracy) Made Using the Two ECG Reading Methods
ECG Method Correct Diagnosis 95% CI
aVR Vereckei algorithm
Seven readers 1,251/1,484 (84.3%)* 82.0–86.0 Four experienced readers 738/848 (86.6%)* 84.4–88.7 Three inexperienced
readers
517/636 (81.3%) 78.9–83.7 RWPT criterion
Seven readers 1,182/1,484 (79.6%) 77.2–82.1 Four experienced readers 671/848 (79.1%) 76.6–81.6 Three inexperienced
readers
511/636 (80.3%) 77.9–82.8
The numbers represent number of correct diagnoses/total number of tracings investigated with the ECG method (per- centage=test accuracy). The overall (for both VT and SVT diagnosis test accuracy of the two ECG methods were com- pared statistically.
*p<0.001 vs. the RWPT criterion evaluated by the same number of observers.
RWPT=lead II R-wave peak time criterion; SVT=supraven- tricular tachycardia; VT=ventricular tachycardia.
inexperienced observers subgroups. The aVR Vereckei algorithm had a greater mean NPV for VT diagnosis in the hands of the seven observers together and of the experienced observers subgroup compared with that for the lead II RWPT criterion (Table 3).
The sensitivity, specificity, and predictive values for VT diagnosis of the seven observers together using either ECG method were lower than those reported in the original publications (sensitivity 92.4% vs. 96.5%, specificity 64.7% vs. 75%, PPV 86.4% vs. 92.7%, NPV 77.8% vs. 86.6% for the aVR Vereckei algorithm; sensi- tivity 79.1% vs. 93.2%, specificity 80.9% vs. 99.3%, PPV 90.9% vs. 98.2%, NPV 61.6% vs. 93.3% for the lead II RWPT criterion).
The mean kappa value of the seven observers together suggested a moderate interobserver agreement for both ECG methods (j=0.49, 95% CI=0.46 to 0.52 for the aVR Vereckei algorithm;j =0.60, 95% CI=0.57 to 0.63 for the lead II RWPT criterion). However, the in- terobserver agreement of the experienced observers was good, far superior to the fair to moderate agree- ment of the inexperienced observers for both ECG methods (j=0.73, 95% CI=0.67 to 0.78 vs. j =0.27, 95% CI=0.19 to 0.35 for the aVR Vereckei algorithm;
j=0.73, 95% CI=0.67 to 0.78 vs. j=0.46, 95%
CI=0.38 to 0.54 for the lead II RWPT criterion).
DISCUSSION Main Findings
The mean overall test accuracy of the aVR Vereckei algorithm achieved by all seven observers was superior to that of the lead II RWPT criterion, which was mainly due to the better overall test accuracy achieved by the experienced four observers. The aVR Vereckei algo- rithm was superior in sensitivity and NPV and inferior in specificity and PPV to the lead II RWPT criterion when mean values of all seven observers were com- pared. The incorrect diagnoses of the aVR Vereckei algorithm were mainly due to misdiagnosis of SVT as VT (in 65.7% of cases), and those of the lead II RWPT criterion were mostly due to the potentially more dan- gerous misdiagnosis of VT as SVT (in 72.5% of cases).
This study revealed the real-life diagnostic value of the two ECG methods as we found lower overall test accu- racy, sensitivity, specificity, and predictive values in the current study than in the original publications for the two ECG methods. It seems likely that in the hands of experienced physicians, the four-step, but still simple, aVR Vereckei algorithm has a greater diagnostic value than the single-step, very simple lead II RWPT criterion.
However, both ECG methods have comparable diagnos- tic value when used by inexperienced physicians. The effect of experience on the results achieved is also reflected in the far better interobserver agreement among the experienced than among the inexperienced observers. The results of this analysis should be inter- preted with caution given its post hoc nature and the small sample size.
The Potential Utility of the aVR Vereckei Algorithm and Lead II RWPT Criterion in Real Life
These two ECG methods can be well applied in real life in the stressful and urgent setting of a WCT, because both are simple, use only one lead for analysis, and eliminate the difficult-to-recall morphologic criteria. In the hands of experienced observers, the aVR Vereckei algorithm proved to be superior to the lead II RWPT criterion. When the two ECG methods were applied by inexperienced physicians, the two ECG methods had comparable diagnostic value.
Because the differential diagnosis of WCTs is a quite complicated task requiring experience in cardiology, it may be recommended for an inexperienced physician to consult with a supervisor, if possible, and apply together the simple and more accurate aVR Vereckei algorithm. If there is no supervisor available for consul- tation, the inexperienced physician alone can apply the simpler lead II RWPT criterion at the expense of a somewhat greater likelihood of misdiagnosis.
Head-to-head Comparison of Different ECG Methods for WCT Differential Diagnosis by Independent Authors
The only other study25 that compared the diagnostic value of the aVR Vereckei algorithm and lead II RWPT Table 3
Sensitivity, Specificity, and Predictive Values of the Two ECG Methods for VT Diagnosis
ECG Method Sensitivity Specificity PPV NPV
aVR Vereckei algorithm
Seven readers 92.4†(90.8–94) 64.7†(60.3–69.2) 86.4‡(84.4–88.4) 77.8‡(73.6–82.1) Four experienced 93.0* (91.0–95.0) 71.0* (65.3–76.6) 88.6 (86.1–91.1) 80.7‡(75.5–86) Three inexperienced 91.6* (89.0–94.1) 56.5* (49.3–63.6) 83.6 (80.3–86.8) 73.4 (66.2–80.7) RWPT criterion
Seven readers 79.1 (76.7–81.6) 80.9 (77.2–84.6) 90.9 (89.1–92.8) 61.6 (57.6–65.6) Four experienced 76.3 (72.9–79.7) 85.9 (81.6–90.2) 92.9 (90.6–95.2) 60.0 (54.9–65.1) Three inexperienced 82.9 (79.4–86.4) 74.2 (67.9–80.5) 88.6 (85.6–91.6) 64.2 (57.8–70.6) Numbers represent percentage values; numbers in parentheses are 95% CI. A significant between ECG methods difference refer- ring to the same number of observers in predictive values (‡) is indicated by disjoint (nonoverlapping) 95% CIs.
*p<0.001 vs. that of the RWPT criterion evaluated by the same number of observers.
†p<0.0001 vs. that of the RWPT criterion evaluated by the same number of observers.
RWPT=lead II R-wave peak time criterion; NPV=negative predictive value; PPV=positive predictive value; VT=ventricular tachycardia.
criterion comparedfive ECG methods for differentiation of WCT (the lead II RWPT criterion, Brugada, Griffith,30 Bayesian,31 and aVR Vereckei algorithms) and did not find any significant differences between the diagnostic accuracy of the five ECG methods, although the diag- nostic accuracy of lead II RWPT criterion tended to be slightly lower than that of the aVR Vereckei algorithm (68.8% vs. 71.9%, respectively). Similar to our results, they verified a superior specificity and inferior sensitiv- ity for VT diagnosis of the lead II RWPT criterion com- pared with those of the aVR Vereckei algorithm (82.7%
vs. 48% for specificity and 60% vs. 87.1% for sensitivity, respectively) and failed to reproduce the high diagnostic accuracy, sensitivity, and specificity reported for the four algorithms and the lead II RWPT criterion in their respective original publications. However, in a study by Jastrzebski et al.,25in contrast to our approach and the recommendation of Brugada and coworkers32 and of Fernando Pava (personal communication), when the mechanism of WCT was preexcitation SVT and the final diagnosis by the applied aVR Vereckei, Brugada algo- rithms, or lead II RWPT criterion was VT, they consid- ered it as an incorrect diagnosis and the SVT diagnosis as a correct one. This important discrepancy renders difficult the comparison of the results of the two studies.
However, the potential misclassification of their 23 pre- excitation SVTs out of the total 260 WCTs might not have significantly changed the conclusions of Jastrzeb- ski et al.25 In a recent report, four emergency resident reviewers analyzed WCT ECG tracings using the aVR Vereckei algorithm.26 When two of the four reviewers who left disproportionately high numbers of ECGs unclassified at thefinal step of the algorithm were elimi- nated from the analysis, the two remaining reviewers achieved a somewhat lower but similar overall test accuracy (70 and 74%) to the mean overall test accuracy of our three inexperienced observers (81.3%). In a pedi- atric population, lower diagnostic accuracy for both the Brugada and the aVR Vereckei algorithms (69% vs.
66%, respectively) has been reported with no difference in the diagnostic accuracy between the two algo- rithms.25
Practical Application of ECG Methods for WCT Differentiation
Although we failed in real life to reproduce the high overall test accuracy, sensitivity, specificity, and predic- tive values reported by the original authors, the two investigated ECG methods showed good-to-very good overall test accuracies, sensitivities, and PPVs and fair- to-good specificities and NPV values. Currently there is no single and very simple ECG method available (and very likely such a method will not be available in the future) that is able to diagnose the mechanism of WCT with a close to 100% diagnostic accuracy regardless of the level of experience of the physician applying the method. Thus, there is no simple ECG criterion that can obviate the experience of the evaluating physician.
When confronted with a hemodynamically stable WCT, a useful practical approach is to look for clinical signs of AV dissociation (e.g., “cannon” A waves) and assess the patient’s clinical characteristics. A history of prior myocardial infarction, congestive heart failure,
and angina strongly suggests VT, while age <35 years, recurrent tachycardia over a period of more than 3 years, and absence of structural heart disease favor SVT.2 One should evaluate the 12-lead WCT ECG for the most specific criteria in a sequence of decreasing specificity such as AV dissociation, <1:1 AV ratio, >1:1 VA ratio, northwest axis (between 180 and –90 degrees), initial R or Rs wave in lead aVR, absence of RS complex in the precordial leads, and concordant pat- tern in the precordial leads. The presence of any of the above criteria strongly suggests VT. If our results are confirmed by other investigators, a lead II RWPT ≥50 milliseconds might be also used in the future to strongly suggest VT. SVT diagnosis is highly likely if the mor- phology of the WCT corresponds to any combination of a typical bundle branch block or fascicular block and the vi/vt ratio >1. If the morphology of WCT definitely does not correspond to any combination of typical bun- dle branch block or fascicular block VT or preexcitation SVT diagnosis is very likely, a vi/vt≤1 strongly suggests VT or preexcitation SVT as well.1When a sinus rhythm ECG is available and the QRS morphology in the sinus rhythm ECG is identical to that of the WCT ECG, SVT diagnosis (or rarely antidromic AV reentrant tachycar- dia) is highly likely.1,33 However, bundle branch reentry VT, fascicular VT, and high midseptal VT may be associ- ated with identical QRS morphology during WCT to that during sinus rhythm as well, and this way may masquerade as SVT in patients withfixed intraventricu- lar conduction disturbances.34 Using the Valsalva maneuver, carotid sinus massage, or adenosine admin- istration may help elucidate the WCT mechanism. The termination of tachycardia strongly suggests SVT; how- ever, idiopathic outflow tract VT may be terminated as well by these maneuvers. Even if the tachycardia itself remains unaffected, these maneuvers may clarify the WCT mechanism by inducing AV or VA block or slow- ing down the sinus or atrial rate.2,3When all these mea- sures fail to establish a certain diagnosis of SVT, then the WCT should be treated as a VT. One should keep in mind that the differential diagnosis of regular mono- morphic WCT is not absolutely necessary for acute management, because it can be successfully treated with electrical cardioversion regardless of the mechanism.
LIMITATIONS
Certain circumstances in this study might have influ- enced the results. The observers were blinded not only to the electrophysiologic diagnosis, but also to the clini- cal characteristics of the patients. The knowledge of patients’histories might have improved the results, and would have better mimicked real life. On the other hand, the short training the observers received before starting the evaluation might have improved the results.
In contrast to some other studies13,16,30,31
from which patients with antiarrhythmic drug treatment, idiopathic VT, and either preexistent bundle branch block were excluded or their presence was not specified, we chose to include WCT tracings obtained from patients with the above features in our study, which might have decreased the diagnostic accuracy of the ECG methods used.
A limitation of the ECG methods was their inability to differentiate pre-excitation SVT from VT. From a thera- peutic standpoint it is not so vital whether the diagnosis of preexcitation SVT as VT or SVT is considered cor- rect, because until one refrains from the administration of agents that are contraindicated in WCTs of unknown origin (such as verapamil) it is no matter what is its exact mechanism. IV adenosine administration is con- sidered safe in regular, monomorphic WCTs of unknown origin and might terminate a preexcitation SVT. IV procainamide is a recommended treatment for both VT and preexcitation SVT, and it may be also effective (or at least not harmful) in SVT-A; direct cur- rent cardioversion can terminate almost all kinds of WCTs as well.
The vi/vt criterion in the fourth step of the aVR Vere- ckei algorithm is a bit more complicated than the first three steps of the algorithm. The use of the fourth step was necessary to establish the diagnosis in approxi- mately 50% to 60% of cases, which is a limitation of this ECG method compared with the very simple, one-step lead II RWPT criterion. As the sample size was not cal- culated prior to performing the study, our ability to make any conclusions regarding failure to reject the null hypothesis is substantially limited by not knowing what the potential effect size we would have been able to elucidate.
CONCLUSIONS
The aVR lead Vereckei algorithm had a superior overall test accuracy, sensitivity, and negative predictive value for ventricular tachycardia diagnosis and inferior specificity and positive predictive value for ventricular tachycardia diagnosis compared to those of the lead II R-wave peak time criterion. The incorrect diagnoses made by the aVR Vereckei algorithm were mainly due to misdiagnosis of supraventricular tachycardia as ventric- ular tachycardia, while the majority of incorrect diagno- ses made by the lead II R-wave peak time criterion were mostly due to misdiagnosis of ventricular tachycardia as supraventricular tachycardia, which is the more danger- ous error. We failed to reproduce the excellent overall test accuracy, sensitivity, specificity, and predictive val- ues reported originally for both electrocardiographic methods. A post hoc analysis suggests that the two elec- trocardiographic methods have similar diagnostic value when applied by inexperienced physicians, and the diag- nostic value of the aVR Vereckei algorithm is superior in the hands of experienced physicians.
References
1. Miller JM, Das MK. Differential diagnosis for wide QRS complex tachycardia. In: Zipes DP, Jalife J, eds.
Cardiac Electrophysiology. From Cell to Bedside.
5th ed. Philadelphia, PA: Saunders Elsevier, 2009, pp 823–30.
2. Issa F, Miller JM, Zipes DP. Approach to wide QRS complex tachycardias. In: Clinical Arrhythmology and Electrophysiology. 2nd ed. Philadelphia, PA:
Elsevier Saunders, 2012, pp 499–511.
3. Pellegrini CN, Scheinman MM. Clinical management of ventricular tachycardia. Curr Probl Cardiol. 2010;
35:453–504.
4. Alzand BS, Crijns HJ. Diagnostic criteria of broad QRS complex tachycardia: decades of evolution. Eu- ropace. 2011; 13:465–72.
5. Miller JM, Bhakta D, Scherschel JA, Yadav AV.
Approach to the patient with wide complex tachy- cardia. In: Electrophysiology. The Basics. A Com- panion Guide for the Cardiology Fellow During the EP Rotation. Philadelphia, PA: Wolters Kluwer, Lippincott Williams and Wilkins, 2010, pp 186–94.
6. Charlton N, Brady WJ. The differential diagnosis of wide complex tachycardia-ED diagnostic and man- agement considerations. In: Grossman SA, Brady WJ, Brown DF, et al., eds. Cardiovascular Problems in Emergency Medicine. A Discussion-based Review. Hoboken, NJ: John Wiley & Sons, 2011, pp 108–22.
7. Sandler IA, Marriott HJ. The differential mor- phology of anomalous ventricular complexes of RBBB-type in lead V1. Ventricular ectopy versus aberration. Circulation. 1965; 31:551–6.
8. Swanick EJ, LaCamera F, Marriott HJ. Morphologic features of right ventricular ectopic beats. Am J Cardiol. 1972; 30:888–91.
9. Marriott HJ, Sandler IA. Criteria old and new for differentiating between ectopic ventricular beat and aberrant ventricular conduction in the presence of atrial fibrillation. Prog Cardiovasc Dis. 1966; 9:18– 28.
10. Wellens HJ, Bar FW, Lie KL. The value of the elec- trocardiograms in the differential diagnosis of a tachycardia with a widened QRS complex. Am J Med. 1978; 64:27–33.
11. Coumel P, Leclercq JF, Attuel P, Maisonblanche P.
The QRS morphology in post myocardial infarction ventricular tachycardia. A study of 100 tracings compared with 70 cases of idiopathic ventricular tachycardia. Eur Heart J. 1984; 5:792–805.
12. Kindwall KE, Brown J, Josephson ME. Eelectrocar- diographic criteria for ventricular tachycardia in wide complex left bundle branch block morphology tachycardias. Am J Cardiol. 1988; 61:1279–83.
13. Brugada P, Brugada J, Mont L, Smeets J, Andries EW. A new approach to the differential diagnosis of a regular tachycardia with a wide QRS complex.
Circulation. 1991; 83:1649–59.
14. Vereckei A, Duray G, Szenasi G, Altemose GT, Miller JM. Application of a new algorithm in the dif- ferential diagnosis of wide QRS complex tachycar- dia. Eur Heart J. 2007; 28:589–600.
15. Vereckei A, Duray G, Szenasi G, Altemose GT, Miller JM. A new algorithm using only lead aVR for the differential diagnosis of wide QRS complex tachycardia. Heart Rhythm. 2008; 5:89–98.
16. Pava LF, Parafan P, Badiel M, et al. R-wave peak time at DII: a new criterion to differentiate between wide complex QRS tachycardias. Heart Rhythm.
2010; 7:922–6.
17. Barold S. Bedside diagnosis of wide QRS tachycar- dia. PACE. 1995; 18:2109–15.
18. Akhtar M, Shenasa M, Jazayeri M, Caceres J, Tchou PJ. Wide QRS complex tachycardia. Reappraisal of a common clinical problem. Ann Intern Med. 1988;
109:905–12.
19. Drew BJ, Scheinman MM. ECG criteria to distin- guish between aberrantly conducted supraventricu- lar tachycardia and ventricular tachycardia:
practical aspects for the immediate care setting.
PACE. 1995; 18:2194–208.
20. Dancy M, Camm AJ, Ward D. Misdiagnosis of chronic recurrent ventricular tachycardia. Lancet.
1985; 2:320–3.
21. Buxton AE, Marchlinski FE, Doherty JU, Flores B, Josephson ME. Hazards of intravenous verapamil for sustained ventricular tachycardia. Am J Cardiol.
1987; 59:1107–10.
22. Grimm W, Menz V, Hoffmann J, Maisch B. Value of old and new electrocardiographic criteria for differ- ential diagnosis between ventricular tachycardia and supraventricular tachycardia with bundle branch block] [German. Z Kardiol. 1996; 85:932–42.
23. Alberca T, Almendral J, Sanz P, Almazan A, Cant- alapiedra JL, Delcan JL. Evaluation of the specificity of morphological electrocardiographic criteria for the differential diagnosis of wide QRS complex tachycardia in patients with intraventricular con- duction defects. Circulation. 1997; 96:3527–33.
24. Isenhour JL, Craig S, Gibbs M, Littmann L, Rose G, Risch R. Wide-complex tachycardia: continued eval- uation of diagnostic criteria. Acad Emerg Med.
2000; 7:769–73.
25. Jastrzebski M, Kukla P, Czarnecka D, Kawacka-Jas- zcz K. Comparison of five electrocardiographic methods for differentiation of wide QRS-complex tachycardias. Europace. 2012; 14:1165–71.
26. Baxi RP, Hart KW, Vereckei A, et al. Vereckei crite- ria as a diagnostic tool amongst emergency medi- cine residents to distinguish between ventricular
tachycardia and supraventricular tachycardia with aberrancy. J Cardiol. 2012; 59:307–12.
27. Ceresnak SR, Liberman L, Avasarala K, Tanel R, Motonaga KS, Dubin AM. Are wide complex tachy- cardia algorithms applicable in children and patients with congenital heart disease? J Electrocar- diol. 2010; 43:694–700.
28. Vereckei A, Miller JM. Classification of pre-excita- tion tachycardias by electrocardiographic methods for differentiation of wide QRS-complex tachycar- dias [letter]. Europace. 2012; 14:1674.
29. Viera AJ, Garrett JM. Understanding interobserver agreement: the kappa statistic. Fam Med. 2005;
37:360–3.
30. Griffith MJ, Garratt CJ, Mounsey P. Ventricular tachycardia as default diagnosis in broad complex tachycardia. Lancet. 1994; 343:386–8.
31. Lau EW, Pathamanathan RK, Ng GA, Cooper J, Skehan JD, Griffith MJ. The Bayesian approach improves the electrocardiographic diagnosis of broad complex tachycardia. Pacing Clin Electro- physiol. 2000; 23:1519–26.
32. Antunes E, Brugada J, Steurer G, Andries E, Brug- ada P. The differential diagnosis of a regular tachy- cardia with a wide QRS complex on the 12-lead ECG: ventricular tachycardia, supraventricular tachycardia with aberrant conduction and supra- ventricular tachycardia with anterograde conduc- tion over an accessory pathway. PACE. 1994;
17:1515–24.
33. Blomstr€om-Lundqvist C, Scheinman MM, Aliot EM, et al. ACC/AHA/ESC guidelines for the manage- ment of patients with supraventricular tachycardia:
executive summary. Eur Heart J. 2003; 24:1857–97.
34. Littmann L, McCall MM. Ventricular tachycardia may masquerade as supraventricular tachycardia in patients with preexisting bundle-branch block. Ann Emerg Med. 1995; 26:98–101.