Yehia El-Mashad
Ass. Prof. Dr. Eng Head of Delta Institute for Computer Science
M. S. Showky
Computer Consultant Urology and Nephrology Center Egypt sshowky@hotmail. com
DECISION SUPPORT SYSTEMS USING ARTIFICIAL NEURAL NETWORKS IN PREDICTING SINGLE TIME
POINT SURVIVAL
Abstract
One of the purposes of the evolving of the field of medical informatics is to de- velop decision support systems that enhance the human ability to diagnose, treat, and assess prognoses of pathologic conditions. This work is to compare the ability of an artificial neural network and a model of logistic regression to predict individual survival status at 2 years after renal transplant. Artificial neural networks (ANN's) are new computational tools, which once trained, can recall proper outputs for a specific set of inputs never encountered before.
Between 1976 and 1997, 1000 patients with End-Stage-Renal-Disease (ESRD) were subject to renal transplant. Survival status at 2 years was known in 725 pa- tients, while censored cases with less than that period were excluded, Logistic re- gression (LR) model was built and a neural network was trained on randomly select- ed 80% of patients (580 patients) to predict individual status at 2 years (status = "1"
for "graft loss" and "0" for "graft survival"). We classified the risk factors into pre- transplant, transplant (technical), and post-transplant predictors.
The performance of the LR and ANN models, revealed a sensitivity (percentage of correctly predicted deaths) of 10.6% and 87.6%, a specificity (percentage of cor- rectly predicted survivors) of 99% and 84%, with an overall accuracy of 85.3% and 85.8% respectively.
The results show that neural network has a higher accuracy in predicting the sen- sitivity at the 2-years survival status. It has also a better balance between the correct prediction of losses and survivors. Probably, still some new markers are needed to differentiate those, whose survival status was not correctly predicted.
Keywords
Artificial neural network, Survival analysis, Regression analysis, Renal trans- plant, computer decision-support system, medical informatics.
1 Introduction
The construction of computer decision-support systems from patient databases has played an important role in medical informatics. For example, researchers inves- tigated the use of Bayesian rule to construct diagnostic systems that assume condi- tional independence of findings given a disease state[1]. As clinical information is increasingly stored in computer databases, tremendous opportunities exist for ex- ploiting this information to help improve patient care and reduce health care costs.
Often, standard statistical methods, such as logistic regression, are used currently to construct predictive models in medicine. Numerous articles within the past decade have appeared discussing unsupervised as well as supervised machine-learning re- search in medicine [2-8].
"Survival analysis " is the phrase used to describe the analysis of data that corre- spond to the time from a well-defined " time origin " until occurrence of some par- ticular event or " end-point ". Modeling survival of populations and establishing prognoses for individual patients are important activities in the practice of medicine.
The objective of the present study is to use artificial neural networks and statistical techniques -logistic regression- in predicting 2-years survival of patients with end- stage renal disease (ESRD) treated by renal transplant. This is to help the clinician:
(1) to identify patients with good prognosis,
(2) to identify patients with high risk for whom adjuvant therapy or another ther- apeutic procedure might be beneficial.
Artificial neural networks, also known as connectionist systems, are relatively new computational tools which found a way in solving pattern recognition and deci- sion support problems in various areas of the biomedical sciences after the develop- ment of the backpropagation of errors algorithm. As contrasted to "expert systems", which must have their rules laboriously constructed, neural networks can build their own rules through self adoption and better suited for probabilistic and sometimes ill-defined medical problems since they can have some degree of generalization. A neural network is "trained" by supplying a series of input patterns and the corre- sponding expected output (supervised). During "training" their internal structures change in a way so as to reinforce "correct decisions" by the network and make
"incorrect decisions" less likely. Once trained the net can recall proper outputs for a specific set of inputs.
725 patients of ESRD, treated by renal transplant underwent the study. The theo- retical advantages and disadvantages of using different methods for predicting sur- vival have seldom been tested in real data sets. Although the use of artificial data sets facilitates the control of data, the use of real data sets provide more useable and convincing information [9, 10]. In real data sets, censoring of observations, noise, and missing data are frequently present and hard to control. A good survival predic- tor has to be able to deal with these obstacles. In this work, we test the hypothesis that neural networks may outperform advanced statistical methods in case of rare category recognition on a rather ill-defined problem, such as that of the "renal trans- plant" database, for living-related kidney transplantation at 1 center.
2 ANN in Medical Informatics
The so-called "support systems" have many concepts and principles in common, yet they vary in the kind of user to be supported, nature of the task, kinds of tech- nology used, and methodology of development. They are among the most important and valuable type of computer based system, because they increase the efficiency and effectiveness of upper-level information workers. Thus, the ability to build, develop, install, and use these systems generates higher productivity increases and business value than more traditional transaction processing or reporting systems.
Over the past decade, neural networks have been used, in biomedicine, to help interpret imaging (12] and laboratories studies [13], and for clinical diagnosis [14].
Several statistical methods such as Cox's proportional hazards [15] and logistic re- gression [16] have been employed to study survival patterns in different cohorts of cancer patients. Such approaches are valuable, but suffer from a number of limita- tions. In situations where prognostic markers interact in a complex fashion, the pro- cessing rules or mathematical equations are often very difficult to determine. This is compounded by the fact that, in the case of censored data, conventional statistical techniques may suffer great limitations in their final estimation.
Although relatively new to clinical medicine, neural computation has evolved slowly since 1986 [17]. ANNs are used, nowadays, to make predictions and interpret data in almost every field of human endeavor, including investments, medicine, science, engineering, marketing, manufacturing, management, and even horse racing and sport wagers.
The advantage of the neural networks is that few assumptions have to be made about the distribution of the data, as they do not follow a rigid set of mathematical rules. Also, they can detect complex interaction and relations between individual prognostic variables. Another advantage of neural networks is that no previous knowledge of the data is needed. In contrast, neural nets learn by exposure to the data and the desired responses, which in our study were "the patient and tumor char- acteristics" and survival status respectively. Thus neural networks could be used as decision support tools after they are passed through a learning and test phase. Also it could be used to assess the contribution of the new markers as prognostic factors without the need of randomized studies. Their main disadvantage is that they pro- vide little insight on which variables are most influential in the model.
3 Materials and Methods
3.1 Patients data sets
Between 1976 and 1997, 1000 patients with end-stage renal disease were subject to renal transplantation at the Urology and Nephrology Center, Mansoura Universi- ty. After excluding missing values 860 patients were entered the study. Among those patients the graft survival was known in 725 patients after 2 years of follow up, aged (mean SD; 24.89.9) with a male to female ratio of 71.9% (521):28.1% (204),
where the graft follow up ranged from 2 to 18.5 years. The remaining 135 patients have a functioning graft but didn't reach the period of 2 years of follow up, i.e. cen- sored, and were excluded by both models. Of these 725 patients, only 113 (15.6%) underwent graft loss after 2 years of follow up, i.e. a rare category.
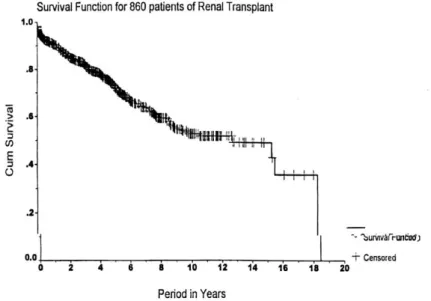
Patients with known survival status at 2-years (725) were randomly divided into 80% (580) for training a neural network or building a logistic regression (LR) model (training set) and 20% (145) for testing the performance of these techniques (inde- pendent test set). The 2-year survival status was chosen for training the network and building the LR model, because of medical considerations. Fig.l shows the survival function for all patients (860) of renal transplant in this study. The figure illustrates the follow up and censored cases for all patients for period of 18 years. For example, after 2 year the cumulative survival value is 0.83 means that success of renal trans- plant operation = 83% of patients.
Figure 1. Survival function for all patients of the renal transplant entered in the study (860 cases).
3.2 Risk Factors and Relevant Variables We classified the risk factors into:
Pre-transplant, Transplant (technical), and Post-transplant predictors.
The pre-transplant variables included personal, haematological, immunological, histopathological, prior transplant hypertension, and bilharziasis, while the trans- plant predictors consisted of ischemia time, number of renal arteries and onset of diuresis. On the other hand, post-transplant risk factors comprised of type of immu-
nosuppression, number of acute rejection, steroid dose in the first 3 months, donors consanguinity, and post transplant hypertension. There are 31 risk factors/variables.
To identify the relevant variables that represent the input parameters to ANN and LR it is required to perform a sensitivity analysis for each variable on the survival function. The sensitivity analysis is performed for 31 variables using the Kaplan- Meier technique. If the value of the probability of Kaplan-Meier is less than 0.05, then the difference is significant and the risk variable is relevant significant.
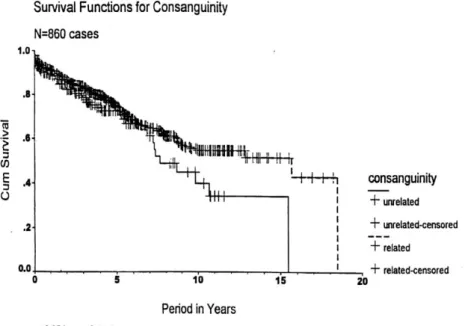
Fig.2 shows the Kaplan-Meier survival function for consanguinity variable. The dotted line show the related consanguinity between donor and recipient, (first and second degree of consanguinity). The unrelated consanguinity means friends, wife, ... etc. From the figure we find that the related consanguinity has much survival probability. The log rank test has p < 0.05 for the consanguinity variable. After con- sidering the Kaplan-Meier estimates and the log rank test, and taking into account the medical advise 13 out of 31 risk factors were classified as relevant variables and considered in this study. The statistical sensitivity analysis identified 13 varia- bles/factors that affect the survival status predictor at 2 years. So, the input parame- ters to ANN and LR are 13 factors.
Figure 2. The Kaplan-Meier survival function for consanguinity
3.3 Network architecture & Input Parameters:
We trained several neural networks to predict the disease-free 2-year survival outcome in the training set and the one which performed consistently best on the test
set was chosen. All Networks were trained and tested using the developed infor- mation system software for supervised and unsupervised ANN [11].
Each network consists of three layers of neuron-like units (Fig.3).
Fig.3 Neural network for renal transplant at 2 years.
The first layer is the input layer where the 13 risk factors are fed to the network.
The second layer (often called the hidden layer) is connected to the input layer via an adapting set of weights. The purpose of the hidden second layer is to find a repre- sentation of the inputs that facilitates the prediction the network is learning to make.
The third layer is the output layer where the prediction of 2-year survival is made by
the network. It is attached to the hidden layer through another set of adapting weights. The basic element of a neural network is the neuron. The neuron multiplies each of its incoming inputs with appropriate weights, adds all products and then passes the product to a nonlinear function, and the resulting value is the response of the neuron.
The input layer had 33 neurons, which represent a pattern of 6 categorical varia- bles and 7 binary variables and no continuous variable.
The 6 categorical variables are: Human leucocyte antigen "HLA", Ischemia time, Primary plan for immunosuppression, Number of acute rejection, Total dose of steroid in the lst 3 months, and Type of rejection of the graft during 1st four weeks.
The 7 binary variables are: Consanguinity, Secondary immunosuppression, Ter- tiary immunosuppression, Acute tubular necrosis "ATN", Surgical complications during 1st 4 months, Urological complications, and Time to diuresis.
In fact, continuous variables like total dose of steroids were categorized(e.g., <5 mg, 5-10 mg, > 10 mg). Each input variable was scaled between 0 & 1 to be compat- ible with the network transfer function (sigmoid). An input neuron was assigned for each categorical value of a categorical variable with the value of 1 when the catego- ry is present and 0 otherwise. Binary variables were given values 0 or 1 and were represented by only one input neuron. The output layer consists of one neuron giv- ing the class value "1" for death graft loss and the class value "0" for disease-free survival. The number of hidden nodes (5) was chosen by the" best "performance on the separate Test set, through a cascade learning algorithm.
4. Neural Network's Training and Testing Strategies
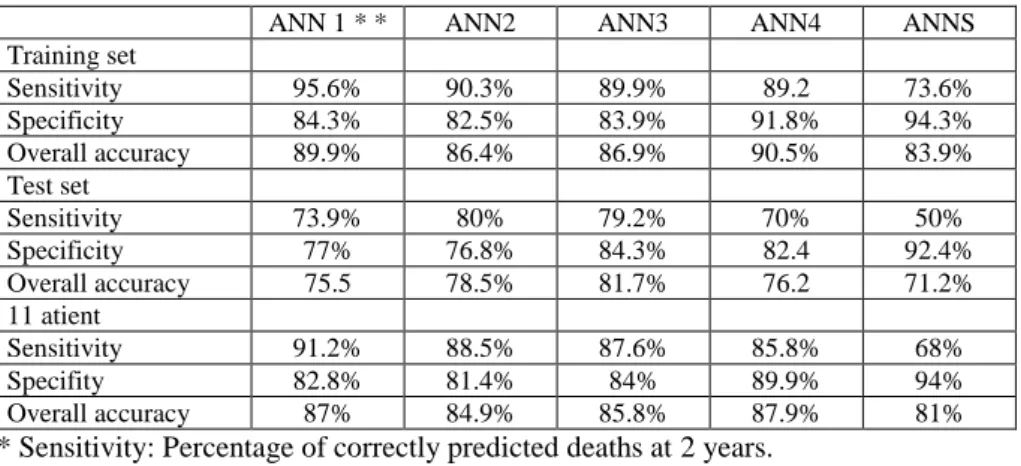
We used feed forward networks with back-propagation of error training algo- rithm. Learning is supervised, and training usually begins by setting the connection weights randomly and trying different sets of random weights' initializations. Then the network is presented with sets of pairs of input and known output patterns. The input pattern is used, by the network, to produce its own output value, which is then compared with the target output. If they were different, it uses the back-propagation of errors, to adjust the connection weights to minimize the error. This readjustment was performed after a complete set of training patterns have been processed, and continues until the weights settle into a stable state. During training, performance of the network was periodically evaluated on the test set, and the network which per- formed best was chosen. The use of such internal independent test set will avoid over-training or over-fitting of the model which may be fatal to the networks ability to generalize. The cross-validation (leaving n out) method was used in our case. The sample 725 patients, is divided into 5 groups, each contain 145 patients. All groups except one are used to train the network. The group that is left out is used for testing the network, and the results are recorded. A different group is then chosen to be left out, and another network is trained with all other groups, and tested with the one left out. This process is repeated until all groups have been left out once for testing. This means that at the end we have 5 networks trained. Table 1 shows the sensitivity, specificity and overall accuracy of the 5 networks, predicting 2 years graft survival
for the renal transplant patients. Network 3 was chosen for comparison purposes with the LR model. It has 5 hidden nodes.
Table-1: Sensitivity, specificity and overall accuracy of the 5 networks for 2 years prediction.
ANN 1 * * ANN2 ANN3 ANN4 ANNS
Training set
Sensitivity 95.6% 90.3% 89.9% 89.2 73.6%
Specificity 84.3% 82.5% 83.9% 91.8% 94.3%
Overall accuracy 89.9% 86.4% 86.9% 90.5% 83.9%
Test set
Sensitivity 73.9% 80% 79.2% 70% 50%
Specificity 77% 76.8% 84.3% 82.4 92.4%
Overall accuracy 75.5 78.5% 81.7% 76.2 71.2%
11 atient
Sensitivity 91.2% 88.5% 87.6% 85.8% 68%
Specifity 82.8% 81.4% 84% 89.9% 94%
Overall accuracy 87% 84.9% 85.8% 87.9% 81%
* Sensitivity: Percentage of correctly predicted deaths at 2 years.
* Specificity: percentage of correctly predicted survivors at 2 years.
** ANN: Artificail neural Network
5 Logistic Regression Model
The logistic regression model is based on the sigmoid equation:
P =1/(1-Exp. (-Z)), Where;
P is the probability of graft loss, P ranged between [0-1], P > 0.5 means graft loss while
P < 0.5 means graft survival, and Z is equal a constant plus sum of Bi * Xi.
In that case, X: is a relevant risk factor defined by the model and B; is the specif- ic coefficient of that variable or its categories. The model was built using the SPSS software statistical package, utilizing the backward likelihood ratio selection.
6 Comparison Between ANN and LR Model
The sensitivity (percentage of correctly predicted deaths), specificity (percentage of correctly predicted survivors) and overall accuracy in the test sets of both tech- niques were compared. There have been 2 logistic regression models, and we have chosen the best for comparison.
Table 2 shows the comparison between neural network and logistic regression for prediction of graft survival at 2 years among 725 patients, which underwent renal transplantation. The training set contains 80% of patient(580) and test set contains the remaining 20% (145) patients. From Table 2 we find that evaluating the perfor-
mance of the LR and ANN models on the independent test set, revealed a sensitivity (percentage of correctly predicted deaths) of 10.6% and 87.6%, a specificity (per- centage of correctly predicted survivors) of 99% and 84%, with an overall accuracy of 85.3% and 85.8% respectively.
Table 2: Comparison between neural network and logistic regression for 2 year prediction
Neural network (%) Logistic regression (%) Training set (580)
Sensitivity 89.9% 9%
Specificity 83.9% 99.2°/a
Overall accuracy 86.9% 85.4%
Test set (145)
Sensitivity 79.2% 16.7%
Specificity 84.3% 98.3%
Overall accuracy 81.7% 84.9%
All patient (725)
Sensitivity 87.6% 10.6%
Specifity 84% 99%
Overall accuracy 85.8% 85.3
Sensitivity: Percentage of correctly predicted deaths at 2 years.
Specificity: percentage of correctly predicted survivors at 2 years.
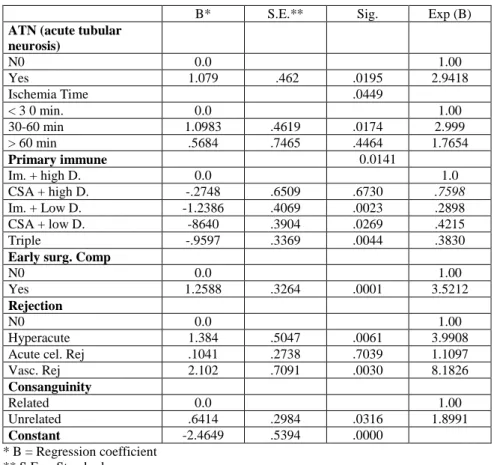
Table 3 shows the results of identifying the effective input parameters/risk fac- tors for logistic regression model. The LR model showed that the most relevant prognostic variables are consanguinity, ischemia time, primary immunosuppression, ATN, and early surgical complications, and type of rejection). The LR model was derived using the backward likelihood selection.
Table 4 shows the result of using Goodman-Kruskal Gamma, as a measure of the association between the ANN output and the input parameters/risk factors. The risk variable with signficane < 0.00001 and increass the ANN output is considered as significant risk factor. The ANN model revealed that the most significant risk fac- tors are ATN, primary immunosuppression, time to diuresis, surgical complications, number of acute rejection, ischemia time, and rejection type. The association be- tween the outcome and the input variables by the ANN model was obtained by the Goodman-Kruskal Gamma, which is an association between two ranked variables.
Table 3: The logistic regression model (Relevant Risk Factors)
B* S.E.** Sig. Exp (B)
ATN (acute tubular neurosis)
N0 0.0 1.00
Yes 1.079 .462 .0195 2.9418
Ischemia Time .0449
< 3 0 min. 0.0 1.00
30-60 min 1.0983 .4619 .0174 2.999
> 60 min .5684 .7465 .4464 1.7654
Primary immune 0.0141
Im. + high D. 0.0 1.0
CSA + high D. -.2748 .6509 .6730 .7598
Im. + Low D. -1.2386 .4069 .0023 .2898
CSA + low D. -8640 .3904 .0269 .4215
Triple -.9597 .3369 .0044 .3830
Early surg. Comp
N0 0.0 1.00
Yes 1.2588 .3264 .0001 3.5212
Rejection
N0 0.0 1.00
Hyperacute 1.384 .5047 .0061 3.9908
Acute cel. Rej .1041 .2738 .7039 1.1097
Vasc. Rej 2.102 .7091 .0030 8.1826
Consanguinity
Related 0.0 1.00
Unrelated .6414 .2984 .0316 1.8991
Constant -2.4649 .5394 .0000
* B = Regression coefficient
** S.E. = Standard error
Table 4: The Goodman- Kruskal Gamma as a measure of association between the network's outcome and the risk variables
Neural network (%) Significance
ATN (acute tubular necrosis) .666 .0000
Primary immunosuppression .6157 .0000
Time to Diuresis .5948 .0000
Surgical complications .5162 .0000
No. of acute rejection .5057 .0000
Tertiary immunosuppression .4928 .0006
Ischemia time .4611 .0000
Rejection type .4497 .0000
Consanguinity .3046 .0001
Total dose of steroids .2452 .0015
Secondary immunosuppression .2419 .0000
Urological complications .2247 .0001
HLA. (Human lucocyte antigen) .2051 .0001
7 Discussion
Chronic Renal Failure (CRF) is the irreversible loss of function of the kidneys, the organs which normally clean the blood of waste materials. Unless the kidney function can be replaced, the retention of these waste materials results in patient's death. There are two main methods of replacing kidney function currently in use:
dialysis and renal transplantation. The dimensions comprising quality of life, physi- cal, emotional and social well-being, have been explored in a sample of ESRD pa- tients receiving haemodialysis, continuous ambulatory peritoneal dialysis (CAPD) or transplantation. On almost all measures, however, transplanted patients appear to have the highest quality of life. Again, there is no doubt that the graft is shown to be vulnerable to several risk factors that affect the graft survival.
There have been no similar work on the renal transplant in the literature, neither by predicting a single time point outcome nor by classifying patients into risk cate- gories. The method of using multiple networks as a mixture of experts is new to the best of our knowledge. However, artificial neural networks have been used in the field of renal transplantation for interpretation of captopril transplant renography, diagnosis of early acute reanal allograft rejection, and for evaluation of complica- tions of renal transplantation[18-21]. In this work, the neural net shows reasonable generalization on an independent test set. Further application of the neural network on a new validation set of patients for 5 years survival is underway and the results will be available when follow up data of survival at 5 years will be available in large number of patients.
We should note the fact that selecting patients in the class with poorer survival estimates (survival status="1") for adjuvant therapy, will include some of the cases who are alive and free of disease and consequently will receive unnecessary treat- ment. On the contrary some patients in low risk group actually suffered from disease recurrence and thus might miss a beneficial adjuvant therapy. In medical practice because the data are not always consistent and have different degree of noise, such issue will always persist. As mentioned, a neural network could also be used to pre- dict survival status at a single point of time (S years) for individual cases, but proba- bly other prognostic markers are needed to help prediction with high accuracy. This will identify directly who might need further adjuvant therapy.
In this work only one center study was considered. The used database included 31 different risk factors. Neural network could identify some other complex interac- tions in all input variables. Further improvement of the neural network prediction could be achieved by inclusion of other recently identified prognostic factors in input variables. These new prognosticators include, among others, DNA content analysis, chromosomal abnormalities and molecular biological markers. Traditional- ly, the value of these parameters needs to be determined in prospective trials and multivariate analysis and correlated with histopathological findings. Inclusion of these new possible prognosticators in a neural network, together with the conven- tional ones, might avoid such prospective randomized trials.
8 Conclusions
The results show that neural network has a higher accuracy in predicting the sen- sitivity at the 2-years survival status. It has also a better balance between the correct prediction of deaths and survivors. Probably, still some new markers are needed to differentiate those, whose survival status was not correctly predicted.
The purpose of a neural network is to produce a formula that captures essential relationships in data between inputs and outputs. Once developed, this formula is used to interpolate from a new set of inputs to corresponding outputs. Thus, neural network analysis must be done with test set because during training a neural net- work's performance evolves, gradually improving on the set used to train the net- work. This improvement is the result of two processes, the recognition of general predictive features of the variables, but also the gradual recognition of the idiosyn- cratic features of the individual cases. Over time the recognition of idiosyncratic features dominate the situation, and the Network's performance on independent test sets decline "overtraining".
The ability to classify patients into risk groups reproducible in test and validation sets will help to avoid randomization which is generally adopted to define the popu- lation likely to benefit from adjuvant therapy.
Refinement in prediction and classification of survival of renal transplant pa- tients by the neural network is possible. Techniques other than the back-propagation of error algorithm may lead to improvement in the network performance and predic- tion. Furthermore, algorithms for inclusion of censored which might contain im- portant information, are not yet fully established, Such algorithms are underway.
Utopia will be achieved if we could develop a network that could predict surviv- al status of individual patients with accuracy close to 100°/o in independent test and validation sets of patients. This might be possible in the future, if all possible prog- nostic factors, including established, newly identified and future ones, are fed as input variables to neural network which could manage censored cases.
We conclude that ANN can be used to classify patients of renal transplant into two different risk categories with different survival estimates after the operation.
The concept could be applied to other types of diseases to allow identification of those who are at high risk.
References
1- Turban, E. and Aronsn J.E.: Decision support systems and intelligent systems. Prentice-Ha11, Inc., London; Sydney; Toronto, 1998.
2- Astion, M. L. and Wilding, P.: Application of neural networks to the interpretation of labora- tory data in cancer diagnosis. Clin. Chem., 38: 34, 1992.
3- Wu, Y., Griger, M. L., Doi, K., Vyborny, C. I, Schmidt, K A. and Metz, C. E.: Artificial neural networks in mammography: application to decision making in the diagnosis of breast cancer. Radiology, 187: 81, 1993.
4- Snow, P. B., Smith, D. S. and Catalona, W. J.: Artificial neural networks in the diagnosis and prognosis of prostate cancer: A pilot study. 5. Urol., 152: 1923-1926,1994.
5- Burke, H. B., Goodman, P. H., Rosen, D. B., Henson, D. E., Weinstein, J. N., Harrell, F. E., Marks, J. R., Winchester, D. P. and Bostwick, D. 0.: Artificial neural networks im- prove the accuracy of cancer survival prediction. Cancer, 79:4, 857-862,1997.
6- Naguib, R. N. G., Sherbet, K. N.: Artificial neural networks in cancer diagnosis, prognosis, and patient management. CRC Press LLC,2001
7- Pantazopoulos, D., Karakitsos, P., Iokim-Liossi, A., Pouliakis, A„ Botsoli Stergiou, E. and Dimopoulos, C.: Backpropagation neural network in the discrimination of benign from malignant lower urinary tract lesions. 5. Urol., 159:1619-1623,1998.
8- Faragi, D. and Simon, R.: A neural network model for survival data. Statistics in Medicine, 14: 73-82,1995.
9- Ravdin, P. M. and Clark, G. M.: A practical application of neural network analysis forpredict- ing outcome of individual breast cancer patients. Breast Cancer Res. Treat., 22: 285- 293, 1992,
10- Ohno-Machado, L., Walker, M. 0. and Musen, M. A.: Hierarchial neural networks for sur- vival analysis. MEDINFO 95 Proceedings. R. A. Greenes et al. (editors). C 1995 IMIA, p 828 -832.
11- A. M. Riad, and A. K. Mahmoud," Information system based-on unsupervised/supervised neural networks for daily electric load forecasting process", Egyptian Computer Journal, ISSR, Cairo University, Egypt 2001.
12- Goldberg, V., Manduca, A., Ewert, D. L„ Gisvold, J. S. and Greenleaf J. F.: Improvement in specificity of ultrasonography for diagnosis of breast tumors by means of artificial intelligence. Med. Phys., 19: 1475, 1992.
13- Kratzer, M. A. A„ Ivandic, B. and Fateh-Moghadam, A.: Neural network analysis of serum electrophoresis. 5. Clin. Patho1.,45:612, 1992.
14- Baxt, W. G. and Skora, J.: Prospective validation of artificial neural network trained to identify acute myocardial infarction, Lancet, 347: 8993, 12-5, 1996.
15- Cox, D. R.: Regression models and life tables. 5. Roy. Stat. Soc., 34: 187, 1972.
16- Lilford, R. I. and Braunholtz, D.: The statistical basis of public policy: a paradigm shift is overdue. B, M. J., 313: 603-607, 1996.
17- Rumelhart, D.E., Hinton GE, Williams RI: Learning representations by back propagating errors. Nature, 323: 533-536, 1986.
18- Kazi JI, Furness PN, Nichelson M.: Diagnosis of early acute renal allograft rejection by evaluation of multiple histological features using a Bayesian belief network. J Clin.
Pathol. 1988 Feb;51(2):108-13.
19- Sheppard D, McPhee D, Darke C, Shrethra B, Moore R, Jurewitz A, Gray A.: Predicting cytomegalovirus disease after renal transplantation: an artificial neural network ap- proach. Int J Med Inf. 1999 Apr;54(1):55-76.
20- Furness PN, Kazi J, Levesley J, Taub N, Nichelson M.: A neural network approach to the diagnosis of early acute allograft rejection. Transplant Proc. 1999 Dec;31(8):3151.
21- Shoskes DA, Ty R, Barba L., Sender M.: Prediction of early graft function in renal trans- plantation using a computer neural network. Transplant Proc. 1998 Jun. 30(4):1316- 7.