1
Supplementary Material
Detecting the Oak lace bug infestation in oak forests using MODIS and meteorological data
Anikó Kern
1,*, Hrvoje Marjanović
2,*, György Csóka
3, Norbert Móricz
4, Milan Pernek
5, Anikó Hirka
3, Dinka Matošević
5, Márton Paulin
3, Goran Kovač
61 Department of Geophysics and Space Sciences, Eötvös Loránd University, Pázmány P. st. 1/A, Budapest H-1117, Hungary
2 Department of Forest Management and Forestry Economics, Croatian Forest Research Institute, Cvjetno naselje 41, Jastrebarsko HR-10450, Croatia
3 Department of Forest Protection, NARIC Forest Research Institute, Hegyalja str. 18, Mátrafüred H-3232, Hungary
4 Department of Ecology and Forest Management, NARIC Forest Research Institute, Várkerület 30/A., Sárvár H-9600, Hungary
5 Department of Forest Protection and Game Management, Croatian Forest Research Institute, Cvjetno naselje 41, Jastrebarsko HR-10450, Croatia
6 Forest Management Service, Sector for Planning, Analysis, Forest Management and Informatics, Croatian Forests Ltd., Ulica kneza Branimira 1, Zagreb HR-10000, Croatia
* Correspondence: hrvojem@sumins.hr (H. Marjanović); anikoc@nimbus.elte.hu (A. Kern)
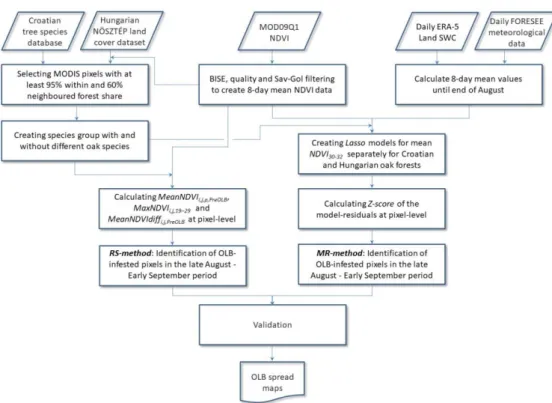
Figure S1. Flowchart of the applied methodologies.
2
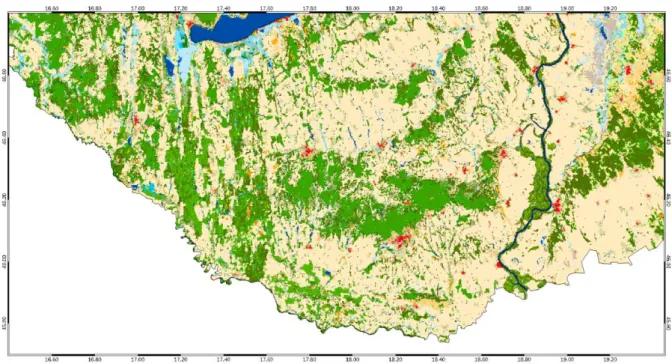
Figure S2a. Land cover map of the Hungarian study area at MODIS QKM grid (250 × 250 m) with the dominant Level-3 NÖSZTÉP land cover category in the case of every pixel. For the detailed legend see Fig. S2b.Figure S2b. Detailed legend of the NÖSZTÉP National Ecosystem Base Map land cover database Level-3 categories.
3
Figure S3. Intersection of the spatial data on forest sub-compartments from HŠFond database (yellow lines and letters mark borders and ID of the sub-compartment) and MODIS QKM grid (white lines and numbers). Polygon marked green is an example of the MODIS pixel in this study, while polygon marked with red dashed line was discarded from the study due to the fact that pixels to the south and to the west of it do not meet selection criteria (although the pixel is >95% forested and side-neighbouring pixels are not > 60% forested).4
Figure S4. Distributions of the NDVI30–32 anomaly showing the progression of the OLB infestation in the forest categories Pedunculate oak with narrowed leaved ash (top row), All pedunculate oak (second row), Turkey oak (third row), Sessile oak with common hornbeam (fourth row) and All oaks (bottom row) for the Hungarian part of the study area. The anomaly distributions for the infestation not detected, not continuously detected, and continuously detected pixels are indicated with grey, yellow and red colour, respectively.5
Figure S5. Distributions of the NDVI30–32 anomaly showing the progression of the OLB infestation in the forest categories Pedunculate oak with narrowed-leaved ash (top row), Sessile oak with common hornbeam (second row), Sessile oak with common beech (third row) and Pure ash (bottom row) for the Croatian part of the study area. The NDVI anomaly distributions for the infestation not detected, not continuously detected, and continuously detected pixels are indicated with grey, yellow and red colour, respectively.6
Table S1. The number of the so-called “pure category” QKM pixels (at 250 m) of the NÖSZTÉP National Ecosystem Base Map land cover database in each Level-3 category of the Forest and Woodlands Level-1 category in the study area. Data from the different Level-2 classifications (indicated with *,**,***) were merged to create unified categories for the given tree species.Level 2 NÖSZTÉP
category Level 3 90-
100%
91- 100%
92- 100%
93- 100%
94- 100%
95- 100%
96- 100%
97- 100%
98- 100%
99- 100%
Without extra soil water effect
4101 Beech 2088 2005 1869 1731 1595 1449 1299 1110 953 777
4102 Sessile oak (Q. petraea) with hornbeam ****
1052 985 914 844 769 693 599 525 437 355 4103 Turkey oak (Q. cerris) *** 1629 1535 1413 1289 1160 1028 865 707 564 411 4104 Pubescent oak (Quercus
pubescens) *****
109 96 87 83 75 65 59 47 39 28
4105 Scots pine (Pinus silvestris) in Western Hungary
380 353 317 285 254 227 200 148 108 80
4106 Scots pine (Pinus silvestris) in Western Hungary mixed with broadleaf forests
27 24 24 22 19 14 13 10 6 5
4107 Poplars 8 8 8 8 5 5 5 3 2 1
4108 Mountainous pionir forests 0 0 0 0 0 0 0 0 0 0
4109 Pedunculate oak (Q. robur) with hornbeam **
89 84 76 66 59 55 51 41 33 26
4110 Only pedunculate oak (Q. robur), or, pedunculate oak mixed with narrow-leafed ashes *
17 16 14 14 13 9 9 8 7 7
4111 Other native species without extra soil water effect
592 553 496 454 410 366 314 260 200 151
4112 Other mixed broadleaf forests 422 399 372 344 311 279 242 200 155 119
Natural forests 4201 Softwoods on floodplains 144 134 120 109 96 91 74 60 51 34 4202 Hardwoods on floodplains 258 232 197 171 145 128 103 74 58 36
Under extra soil water effect
4301 Only pedunculate oak (Q. robur), or, pedunculate oak mixed with narrow-leafed ashes *
869 789 690 608 533 433 340 247 180 132
4302 Alders 408 364 320 274 232 202 167 121 92 64
4303 Pedunculate oak (Q. robur) with common hornbeam **
343 314 282 253 217 185 151 106 67 42
4304 Willows outside of floodplains 0 0 0 0 0 0 0 0 0 0
4305 Poplars outside of floodplains 3 3 2 0 0 0 0 0 0 0
4306 Birches 8 8 6 5 4 4 3 2 1 1
4307 Turkey oak (Q. cerris) *** 20 18 16 14 10 8 7 4 3 1
4308 Other native species 24 20 19 19 17 17 13 10 7 5
4309 Other mixed broadleaf forests 9 8 7 6 2 2 1 1 1 1
Alien species dominated plantations
4401 Needle-leaf dominated plantations 289 266 235 214 177 146 120 90 62 44 4402 Robenia dominated plantations 2159 1982 1807 1645 1469 1294 1140 939 738 550 4403 Populus x euramericana
dominated plantations
248 231 213 199 187 169 142 118 100 76
4404 Other alien species dominated broadleaf forests
196 181 159 138 122 103 82 65 50 40
Registered as forests, but without stands
4501 Stemmed forests 26 25 22 20 18 15 13 9 7 5
4502 Under reconstruction 312 289 270 242 214 195 171 148 131 106
Others 4600 Other, not classifiable woody plants
653 609 555 506 457 412 377 338 301 241
7
Table S2. The statistics of the constructed model coefficients (estimates, standard errors, t-statistics, p-values).M12000–2016
independent
variable Intercept Tmax 5-6 Tmax 21-22 Tmin 25-26 Tmin 27-28 Prec 29-30 SWC3 1-2 NDVI 25-26 - - coefficient estimate 0.26899 0.00091 -0.00189 0.00427 -0.00273 0.00031 0.02975 0.67971 - - standard error 0.00240 0.00001 0.00003 0.00004 0.00005 0.000004 0.00088 0.00232 - - t-statistic 112.24 70.94 -73.86 103.10 -59.61 81.06 33.71 293.55 - - p-value 0.0000 0.0000 0.0000 0.0000 0.0000 0.0000 0.0000 0.0000 - -
M22000–2012
independent
variable Intercept Tmin 1-2 Tmin 9-10 Prec 1-2 Prec 9-10 SWC3 1-2 SWC3 7-8 SWC3 29-30 SWC4 29-30 NDVI 25-26
coefficient estimate 0.19767 -0.00111 -0.00210 0.00020 0.00031 -0.09954 -0.24562 0.08909 0.26704 0.76656 standard error 0.00136 0.00001 0.00002 0.00000 0.00001 0.00120 0.00265 0.00117 0.00343 0.00147 t-statistic 145.06 -98.08 -129.86 59.17 58.03 -83.26 -92.74 75.84 77.89 523.02 p-value 0.0000 0.0000 0.0000 0.0000 0.0000 0.0000 0.0000 0.0000 0.0000 0.0000
Table S3. Ordinal numbers and dates of the regular 8-day periods in not leap-years.
Number of the 8-day
period
Julian day of the start
Date
Number of the 8-day
period
Julian day of the start
Date
1 001 01–08 January 24 185 04–11 July
2 009 09–16 January 25 193 12–19 July
3 017 17–24 January 26 201 20–27 July
4 025 25 January – 01 February 27 209 28 of July – 4th of August
5 033 02–9 February 28 217 5–12 of August
6 041 10–17 February 29 225 13–20 of August
7 049 18–25 February 30 233 21–28 of August
8 057 26 February – 05 March 31 241 28 of August – 5th of September
9 065 06–13 March 32 249 6–13 of September
10 073 14–21 March 33 257 14–21 of September
11 081 22–29 March 34 265 22–29 of September
12 089 30 March – 06 April 35 273 30 September - 07 October
13 097 07–14 April 36 281 08-15 October
14 105 15–22 April 37 289 16-23 October
15 113 23–30 April 38 297 24-31 October
16 121 01–08 May 39 305 01-08 November
17 129 09–16 May 40 313 09-16 November
18 137 17–24 May 41 321 17-24 November
19 145 25 May – 01 June 42 329 25 November - 02 December
20 153 02–09 June 43 337 03-10 December
21 161 10–17 June 44 345 11-18 December
22 169 18–25 June 45 353 19-26 December
23 177 26 June – 03 July 46 361 27-31 December
8
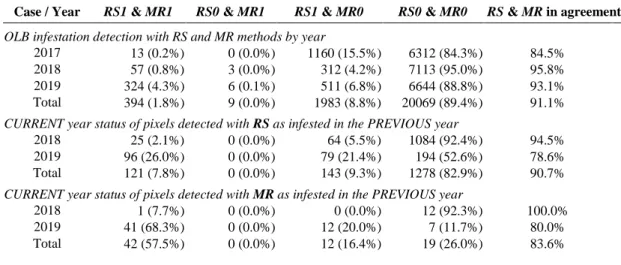
Table S4. Comparison of RS and MR methods for detection of the OLB infestation and of the continuity in detection by year for Hungary. (0 – not infested; 1 – infested).Case / Year RS1 & MR1 RS0 & MR1 RS1 & MR0 RS0 & MR0 RS & MR in agreement OLB infestation detection with RS and MR methods by year
2017 13 (0.2%) 0 (0.0%) 1160 (15.5%) 6312 (84.3%) 84.5%
2018 57 (0.8%) 3 (0.0%) 312 (4.2%) 7113 (95.0%) 95.8%
2019 324 (4.3%) 6 (0.1%) 511 (6.8%) 6644 (88.8%) 93.1%
Total 394 (1.8%) 9 (0.0%) 1983 (8.8%) 20069 (89.4%) 91.1%
CURRENT year status of pixels detected with RS as infested in the PREVIOUS year
2018 25 (2.1%) 0 (0.0%) 64 (5.5%) 1084 (92.4%) 94.5%
2019 96 (26.0%) 0 (0.0%) 79 (21.4%) 194 (52.6%) 78.6%
Total 121 (7.8%) 0 (0.0%) 143 (9.3%) 1278 (82.9%) 90.7%
CURRENT year status of pixels detected with MR as infested in the PREVIOUS year
2018 1 (7.7%) 0 (0.0%) 0 (0.0%) 12 (92.3%) 100.0%
2019 41 (68.3%) 0 (0.0%) 12 (20.0%) 7 (11.7%) 80.0%
Total 42 (57.5%) 0 (0.0%) 12 (16.4%) 19 (26.0%) 83.6%
Table S5. Comparison of RS and MR methods for detection of the OLB infestation and of the continuity in detection by year for Croatia. (0 – not infested; 1 – infested).
Case / Year RS1 & MR1 RS0 & MR1 RS1 & MR0 RS0 & MR0 RS & MR in agreement OLB infestation detection with RS and MR methods by year
2013 65 (0.4%) 7 (0.0%) 133 (0.8%) 16808 (98.8%) 99.2%
2014 612 (3.6%) 174 (1.0%) 237 (1.4%) 15990 (94.0%) 97.6%
2015 973 (5.7%) 51 (0.3%) 441 (2.6%) 15548 (91.4%) 97.1%
2016 2985 (17.5%) 108 (0.6%) 768 (4.5%) 13152 (77.3%) 94.9%
2017 4119 (24.2%) 21 (0.1%) 3095 (18.2%) 9778 (57.5%) 81.7%
2018 6107 (35.9%) 232 (1.4%) 1224 (7.2%) 9450 (55.5%) 91.4%
2019 9489 (55.8%) 823 (4.8%) 1114 (6.5%) 5587 (32.8%) 88.6%
Total 24350 (20.4%) 1416 (1.2%) 7012 (5.9%) 86313 (72.5%) 92.9%
CURRENT year status of pixels detected with RS as infested in the PREVIOUS year
2014 89 (44.9%) 1 (0.5%) 15 (7.6%) 93 (47.0%) 91.9%
2015 406 (47.8%) 7 (0.8%) 122 (14.4%) 314 (37.0%) 84.8%
2016 1257 (88.9%) 9 (0.6%) 86 (6.1%) 62 (4.4%) 93.3%
2017 2941 (78.4%) 6 (0.2%) 356 (9.5%) 450 (12.0%) 90.4%
2018 5154 (71.4%) 87 (1.2%) 584 (8.1%) 1389 (19.3%) 90.7%
2019 6127 (83.6%) 130 (1.8%) 590 (8.0%) 484 (6.6%) 90.2%
Total 15974 (76.9%) 240 (1.2%) 1753 (8.4%) 2792 (13.4%) 90.4%
CURRENT year status of pixels detected with MR as infested in the PREVIOUS year
2014 51 (70.8%) 1 (1.4%) 1 (1.4%) 19 (26.4%) 97.2%
2015 492 (62.6%) 9 (1.1%) 116 (14.8%) 169 (21.5%) 84.1%
2016 972 (94.9%) 7 (0.7%) 20 (2.0%) 25 (2.4%) 97.4%
2017 2872 (92.9%) 4 (0.1%) 146 (4.7%) 71 (2.3%) 95.2%
2018 3987 (96.3%) 35 (0.8%) 45 (1.1%) 73 (1.8%) 98.1%
2019 5684 (89.7%) 128 (2.0%) 350 (5.5%) 177 (2.8%) 92.5%
Total 14058 (91.0%) 184 (1.2%) 678 (4.4%) 534 (3.5%) 94.4%