sub-critical CO 2 cycle
Aram Mohammed Ahmed
1,2pand Attila R. Imre
1,31Department of Energy Engineering, Faculty of Mechanical Engineering, Budapest University of Technology and Economics, M}uegyetem rkp. 3, H-1111 Budapest, Hungary
2Technical College of Kirkuk, Northern Technical University, 36001 Kirkuk, Iraq
3Department of Thermohydraulic, Centre for Energy Research, POB. 49, H-1525 Budapest, Hungary
Received: December 1, 2020 • Revised manuscript received: January 10, 2021 • Accepted: January 12, 2021 Published online: April 23, 2021
ABSTRACT
Thermodynamic efficiency is a crucial factor of a power cycle. Most of the studies indicated that efficiency increases with increasing heat source temperature, regardless of heat source type. Although this assumption generally is right, when the heat source temperature is close to the critical temperature, increasing the heat source temperature can decrease efficiency. Therefore, in some cases, the increase in the source temperature, like using improved or more collectors for a solar heat source can have a double negative effect by decreasing efficiency while increasing the installation costs. In this paper, a com- parison of the CO2subcritical cycle and the Trilateral Flash Cycle will be presented to show the po- tential negative effect of heat source temperature increase.
KEYWORDS
subcritical carbon dioxide cycle, Trilateral Flash Cycle, critical temperature, heat source, maximum efficiency
1. INTRODUCTION
The demand for energy in the world increases; this increase is preferably satisfied by modern power plants using a clean, renewable source. A special class of these power plants is the one operated by low heat sources, using organic Rankine cycles or carbon dioxide power cycle.
The transcritical CO2 power cycle (working with heat sink temperature below and heat source temperature above the critical temperature (Tcr) of CO2, namely 318C) has significant and sufficient potential to convert the heat to produce power (electricity) by using the carbon dioxide as a working fluid due to its good thermodynamic and environmental properties [1, 2]. Many thermodynamics cycles are applicable in the temperature below 350 8C, like the CO2 transcritical power cycle, Organic Rankine Cycle (ORC) and Trilateral Flash Cycle (TFC), instead of high-temperature steam Rankine Cycle (RC) [1, 3–5]. CO2has a low critical temperature, which makes it appropriate for utilizing a low heat source–geothermal [6, 7]. CO2 power cycles are widely used in air conditioning, heat pumps, refrigerating systems, and power cycles [8–11]. CO2power cycle can be used to utilize solar heat, but due to the weather-dependence of this source, a heat storage system is required to provide continuous heating. Also, integration of the absorption refrigeration system with reheat transcritical power cycle leads to improve the efficiency and maintain stable productivity by keeping the low condensation temperature at all different weather conditions. Using the compressed air energy storage help to overcome the decrease or interruption for solar energy and improves the technicalflexibility in solar thermal power and storage [12, 13]. Using a regenerative heat exchanger (recuperator) in the CO2transcritical cycle improves overall net power and overall thermal efficiency [14]. At the low and high heat source temperature, the transcritical CO2power cycle using mixed CO2is better than the cycle that using pure carbon dioxide, thermodynamically, and exergo-economically. It has been shown by analyzing
Pollack Periodica • An International Journal for Engineering and Information Sciences
16 (2021) 2, 73–79
DOI:
10.1556/606.2021.00310
© 2021 The Author(s)
ORIGINAL RESEARCH PAPER
pCorresponding author.
E-mail:arammohammed@energia.
bme.hu
binary mixtures of carbon dioxide with other refrigerants (R32, R1270, R161, R1234yf, R1234ze, R152a), and alkanes (butane, pentane, propane, isobutene or isopentane) that the highest exergy efficiency and the lower levelized cost per unit of exergy product was with CO2/propane at the high-tem- perature heat source. At lower heat source temperature, the highest exergy efficiency was with CO2/R32, and the lowest levelized cost per unit of exergy product was with CO2/R161 [15]. With CO2 mixtures that consist of binary mixture of CO2 with one of these refrigerants (R152a, R161, R290, R1234yf, R1234ze, and R1270) with a transcritical power cycle at geothermal water temperature between 100 and 150 8C and temperature of cooling tower 10–30 8C, it has been observed that the better thermal performance and economic performance was with R161/CO2, while the R290/CO2 was the worst due to low thermal performance.
The cost per net power reduction, decrease of operating pressure and extension of the range of condensing temper- ature, all these occur with the blends of CO2more than the CO2 in a pure state. At the low cooling water temperature, R152a/CO2 mixed working fluid is not suitable with the proposed system [16]. The comparison between basic, recuperator, reheat, and regenerative systems for tran- scritical CO2 power cycle demonstrated that reheat tran- scritical CO2 cycle is the best one, concerning thermo- economic performance, and reheat system showed an in- crease in net power produced, energy efficiency, and effi- ciency of exergy compared the basic transcritical CO2cycle while the total investment cost is higher for reheat system due to largest heat transfer area [17]. Condensing is one of the problems facing the conventional CO2 trans- and subcritical CO2 power cycles by using traditional water cooling, but with self-condensing, the CO2 carbon dioxide transcritical power cycle overcome this problem and can operate well with the cooling water as warm as 308C [18, 19]. The CO2transcritical power cycle has a better economic performance than the organic Rankine cycle in terms of cost per net power output and under a certain turbine inlet pressure. The cost per net power output in the regenerative CO2 transcritical power cycle is even lower than that of the basic CO2 transcritical power cycle, that which observed by analyzing the organic Rankine cycle and CO2 transcritical cycle with a geothermal heat source and different working fluids for example isobutane, R123, pentane R245fa [20].
The subcritical CO2 power cycle (CO2 Rankine cycle) can use the ambient temperature or low-temperature geothermal as a heat source; these two sources are classified as a low enthalpy source [21]. To properly characterize the transcritical cycle, it requires a deep knowledge of the subcritical carbon cycle [22]. When the ambient temperature or some other source with similar temperature (for example, thermal water not above 35–408C) are used as a heat source, then - depending on the weather conditions - transcritical cycles might shift to the sub-critical region (i.e., the maximum temperature will be below the critical temperature of CO2). In that case, it is better to use a subcritical CO2 cycle. Still, engineers should know that there is a narrow
temperature range near to the critical temperature, where the thermodynamic efficiency has inverse maximum cycle temperature dependence. Therefore, there is a temperature range, which should be avoided during this application. The aim of the study is to demonstrate to engineers and re- searchers that the efficiency does not always increase with increasing heat source temperature, but sometimes the increasing of the heat source temperature close to the critical temperature leads to decreasing the efficiency. That can also happen with other thermodynamics cycles using various working fluids, for example Rankine cycle and organic Rankine cycle. This study focused on the subcritical CO2 power cycle with low heat source temperature close to the critical points.
2. METHODS
The water and some organic materials are working fluids used in the power plants using steam and organic Rankine cycles, respectively. In contrast, in the CO2 power cycle, carbon dioxide is used as a working fluid. The subcritical CO2 power cycle operates under temperature and pressure not exceeding the critical point for CO2. Therefore, the low heat source temperature, like ambient temperature (Tamb) or geothermal, is sufficient for the subcritical CO2power cycle.
The ideal cycle was used in this study that was an isobaric process at the heat exchangers and isentropic steps at the expansion and compression.
2.1. Components and processes of CO
2power cycle
The subcritical CO2cycle is very similar to the simple steam Rankine cycle; therefore it is called the CO2Rankine cycle.
Evaporator, turbine, condenser, and pump are demand to configuration the CO2power cycle, as it is shown inFig. 1a.
The T–s diagram shows the processes of the CO2 power cycle inFig. 1b. The CO2compressed from point 1 to point 2 by a pump in an isentropic process. A slight increase in temperature occurs, together with the rise of the pressure.
Then, CO2 enters the heat exchanger (sometimes called evaporator) at point 2; here, in the initial part, the temper- ature will increase. Then, after reaching the boiling tem- perature for the given pressure, evaporation happens, even the total mass of thefluid reaches a vapor state (point 3). At point 3, thefluid is in high pressure and high temperature saturated vapor state. Here, the working fluid enters the turbine (or expander) with high pressure and temperature to produce the mechanical work by expansion between points 3 and 4. During this process (taken as ideal adiabatic, i.e., isentropic one) pressure and temperature of the workingfluid is decreased. In stage 4, thefluid is in a low- enthalpy, low-temperature, low-pressure saturated vapor state. Between points 4 and 1, part of the heat is removed from the system isobarically in a second heat exchanger, called condenser, causing complete condensation from saturated steam to saturated liquid state in order to start a new cycle.
There is a slightly different cycle, called TFC; it is char- acterized by its simplicity. Heat addition terminates, when the saturated liquid state reached (point 3, Fig. 2). In this way, the fluid volume between points 2 and 3 is not significantly different, and therefore the heat exchanged for TFC can be simpler, than for ORC. In general, the process 1–2–3–4 is similar to the CO2 cycle used in the study. The two differences are the lack of evaporation in the ‘evapo- rator’and the“wet expansion”(i.e., expansion starting from
the liquid state) in the expander [23]. The difference can be seen in detail inFig. 1b and c.
2.2. Characteristics of CO
2as working fl uid
Due to the thermal stability, the CO2 is one of the natural workingfluids considered suitable for the refrigeration and power cycles, also; it has significant advantages compared to other workingfluids that lack whole or part of these char- acteristics, which include physical, chemical, environmental, and economic features. There are some crucial factors that must be considered when selecting a working fluid, or it characterizes the workingfluids, for chemically factors like non-flammability, low toxicity; physical factors, like high critical pressure (Pcr), low critical temperature, low boiling point (Bp), and good heat transfer; the environmental ones, like low Global Warming Potential (GWP), low Ozone- Depleting Potential (ODP), and environmentally friendli- ness (very safe to use); andfinally, low cost as the economic factor. Carbon dioxide is one of the liquids whose properties satisfy the above-mentioned characteristics; additionally, it is a“natural”fluid. The CO2properties and American Society of Heating, Refrigerating and Air-Conditioning Engineers (ASHRAE) for CO2, are shown inTable 1. The CO2can be used in all types of CO2cycles like subcritical, transcritical, supercritical; also, it can be used as purefluid as well as in mixtures with other working fluids especially with hydro- carbons, especially because of its ability to reduce the flammability of hydrocarbons while preserving all the other desired thermodynamic properties [24]. According to the traditional workingfluid classification, CO2is a wet working fluid; in the novel classification, it belongs to the so-called ACZ class [25].
Table 1.Properties of carbon dioxide (Source:on the basis of [26])
Type Category
ASHRAE
NO. Formula
ASHRAE level for
safety ODP GWP
Critical temperature [K]
Critical Pressure [MPa]
Boiling Point [K]
Wet ACZ 744 CO2 A1 0 1 304.1282 7.3773 194.75
Fig. 1.Schematic diagram for CO2power cycle, a) Main compo- nents of cycle, b)T–sdiagram for CO2power cycle, and c)T–s
diagram for TFC cycle
Fig. 2. T–sdiagram for carbon dioxide as wet workingfluid with characteristic points (see in text)
2.3. Thermodynamic analysis
A calculation was performed to find the efficiency of the CO2power cycle with the temperature variation of the heat source by using the MATLAB software and data from the NIST webbook [27]. On the T–sdiagram of CO2, A and Z marks the minimum temperature for liquid and vapor phases, and C is the critical point, as shown inFig. 2. The blue solid line represents the saturated liquid state, and the red dashed line represents the saturated vapor state. General equations were used. The efficiency was calculated by
h¼ðh3h4Þ ðh2h1Þ
ðh3h2Þ ; (1) where the (h3 h4), (h2 h1), and (h3 h2), are the dif- ference in enthalpy at the turbine, pump, and evaporator respectively, and the enthalpy and other data values as en- tropy, pressure, and dryness fraction found by NIST web- book.
In this study, some assumptions and parameters applied like the steady-state of the operation cycle, and ignored the pressure losses during the flow. At the saturated vapor phase, the working fluid entering the turbine, and the inlet pressure changes based on the increasing the heat source temperature, while in the TFC cycle, the working fluids enter the turbine at the saturated liquid. Depended on the condenser temperature and dryness fraction, the working fluid enters the condenser then leaves it at the saturated liquid. Ten thousand steps, using different temperature pairs were used in this study (with 1,000 readings for each curve, 500 for the CO2 cycle, and 500 for the TFC cycle). The condenser line, green solid line is at low temperature, for example, 217 K, and all the horizontal lines above the condenser line, green solid line are the evaporator lines (increase with increasing heat source temperature starting from orange dot line to dark blue long dash line), up to the critical point. First, the 1–2–3–4 cycle efficiency was calculated then evaporation temperature was shifted to a higher value, while the condensation temperature was kept and the efficiency of the new cycle (1–2a–3a–3b) was determined. The process continued upwards, to the vicinity of the critical temperature (see cycle 1–2d–3d–4d) as it is shown in Fig. 3. In the next step, a new (increased) condenser temperature was taken (238 K instead of 217 K green solid line shifts upward). For this new value, efficiencies related to changing evaporation temperature (orange dot, gold dash, purple long dash dot, blue long dash dot dot, and dark blue long dash lines), were also calculated. In the following steps, the process was repeated with new condenser temperatures. Finally, obtained the whole set of efficiency
values for various condensation and evaporation temperature pairs from 217 K to the critical temperature was obtained.
The same processes were applied for the TFC cycle, except that the entering parameter in the turbine would be saturated liquid, as it is shown inFig. 4. All boundary conditions are shown inTable 2.
3. RESULTS AND DISCUSSION
Carbon dioxide can be applied as working fluid in refrig- eration cycles as well as in and power cycles. This study focused on the sub-critical CO2power cycle by utilizing low- temperature heat sources for example ambient temperature or geothermal one with several of condenser temperatures.
In general, the efficiency increases with increasing the heat
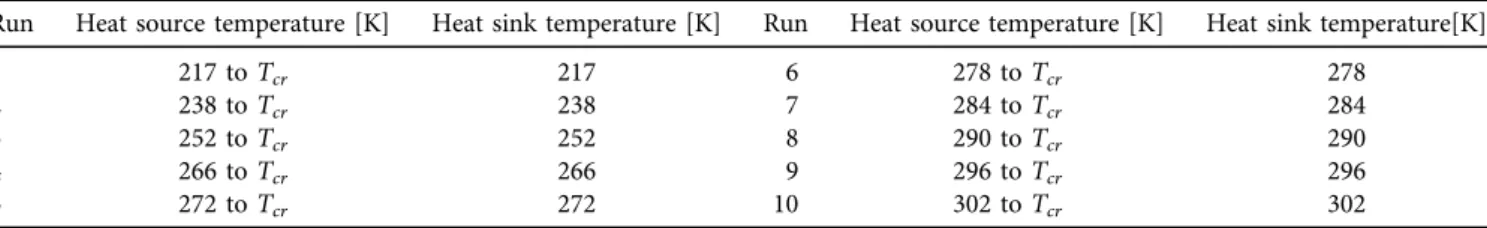
Table 2.The boundary conditions
Run Heat source temperature [K] Heat sink temperature [K] Run Heat source temperature [K] Heat sink temperature[K]
1 217 toTcr 217 6 278 toTcr 278
2 238 toTcr 238 7 284 toTcr 284
3 252 toTcr 252 8 290 toTcr 290
4 266 toTcr 266 9 296 toTcr 296
5 272 toTcr 272 10 302 toTcr 302
Fig. 3.The procedure of the calculation on aT–sdiagram for CO2
power cycle
Fig. 4.The procedure of the calculation on aT–sdiagram for TFC power cycle
source temperature. It has been found in sub-critical CO2 cycles (and can be generalized to all cycles having similar, ACZ-type T–s diagram) that while this increase is usually true, choosing the maximal cycle temperature close to the critical point, inverse dependency can be seen a narrow, but definitely non-zero temperature range. In contrary, for TFC, the maximum efficiency was at the critical temperature as it is shown inFig. 5; the upper curves represent the efficiency values of CO2 power cycles and the lower curves for TFC cycles. For example, the first curve for CO2 and TFC, the range of evaporator temperature (heat source temperature) between 217 and 304.1282 K, calculated point by point with an increment equal to (total temperature range)/500, with fixed condenser temperature 217 K. For the next curve, the condenser temperature was increased, and the calculation was repeated.
Separate lines in Fig. 6 represent the variation of effi- ciency for CO2 power cycle with increasing heat source temperature and with fixed condenser temperature (repre- sented by the lowest temperature value on each curve), the efficiency increases for a while with increasing heat source temperature, but then a maximum appears, close, but defi- nitely below the critical temperature, followed by an effi- ciency decrease, supported by results obtained with other working fluids for ORC and TFC [28]. The red dots (dia- mond marker) show the positions of the efficiency
maximum, which is always below the critical temperature (located at the end of the curves), also the dots showing that maximum efficiency shifted close to the critical temperature with a minimum value of efficiency in the and the maximum condenser temperature 302 K. However, even this new maximum is definitely below (although closer, than the previous maximum) the critical point. It is approaching the critical temperature and its value is very small; 0.066, located at 304.10 K (while the critical temperature is 304.1282 K).
Figure 7shows efficiency for the CO2cycle and TFC cycle in the range where this maximum appears, up to the critical temperature. The curve represents the case with condenser temperature located at 217 K, and showing that the two efficiency curves meet at one point at the critical tempera- ture.Figure 8 shows the efficiency values at the maximum, together with the temperature of this maximum and how it decreases with increasing condenser temperature.
4. CONCLUSION
The CO2 power cycle has reasonably good efficiency oper- ating with low-temperature heat sources. It uses CO2 as a working fluid, with suitable physical, chemical, environ- mental, and economic characteristics, compared to other working fluids. It has been known to researchers and
Fig. 5.Efficiency variation with heat source temperature for CO2
and TFC cycle
Fig. 6.Maximum efficiency (red spots) for CO2power cycle
Fig. 7.Efficiency for CO2and TFC at Condenser temperature 217 K
Fig. 8.The shift of the efficiency-maxima
engineers that for thermodynamic cycles the efficiency in- creases with the increase in the source temperature. This study showed that the efficiency of the cycle does not always increase with increasing maximal cycle temperature (and heat source temperature); close to the critical temperature;
on the contrary, it reduces efficiency. It means that an effi- ciency maximum can exist, and the existence of this maximum should be considered upon designing subcritical CO2Rankine cycles with maximal cycle temperature close to the critical one. In some cases (like with solar heat), the increase of the heat source temperature goes together with the increase in installation costs. This cost increase is justi- fied only when it is associated with proper efficiency in- crease; in the vicinity of the critical temperature, it is not justified. The maximum of the efficiency goes closer to the critical temperature as the condenser temperature increased, while its absolute value decreases. Also, it has been shown that the efficiency of the subcritical CO2power cycle higher than the efficiency of TFC and their efficiency equal at the critical point.
ACKNOWLEDGEMENTS
This work was performed in the frame of the FIEK_16-1- 2016-0007 project, implemented with the support provided from the National Research, Development and Innovation Fund of Hungary, financed under the FIEK_16 funding scheme. Part of the research reported in this paper and carried out at BME has been supported by the NRDI Fund (TKP2020 NC, Grant No. BME-NC) based on the charter of bolster issued by the NRDI Office under the auspices of the Ministry for Innovation and Technology.
REFERENCES
[1] E. Cayer, N. Galanis, M. Desilets, H. Nesreddine, and P. Roy,
“Analysis of a carbon dioxide transcritical power cycle using a low temperature source,”Appl. Energ., vol. 86, no. 7–8, pp. 1055–1063, 2009.
[2] Y. T. Ge, L. Li, X. Luo, and S. A. Tassou,“Performance evaluation of a low-grade power generation system with CO2transcritical power cycles,”Appl. Energ., vol. 227, pp. 220–230, 2018.
[3] L. Li, T. Ge, X. Luo, and S. A. Tassou,“Experimental investigations into power generation with low grade waste heat and R245fa Organic Rankine Cycles (ORCs),” Appl. Therm. Eng., vol. 115, pp. 815–824, 2017.
[4] C. Zamfirescu and I. Dincer,“Thermodynamic analysis of a novel ammonia-water trilateral Rankine cycle,” Thermochim. Acta, vol. 477, no. 1–2, pp. 7–15, 2008.
[5] O. Al-Oran and F. Lezsovits, “Enhance thermal efficiency of parabolic trough collector using Tungsten oxide/Syltherm 800 nanofluid,”Pollack Period., vol. 15, no. 2, pp. 187–198, 2020.
[6] S. Mondal and S. De,“Transcritical CO2power cycle - Effects of regenerative heating using turbine bleed gas at intermediate pressure,”Energy, vol. 87, pp. 95–103, 2015.
[7] C. Tonko,“Criterion for the discharge of geothermal waste water into surface water sources in Hungary,” Pollack Period., vol. 7, no. 2, pp. 129–138, 2012.
[8] X. Lei, R. Peng, Z. Guo, H. Li, K. Ali, and X. Zhou,“Experimental comparison of the heat transfer of carbon dioxide under subcritical and supercritical pressures,”Int. J. Heat Mass Transf., vol. 152, Paper no. 119562, 2020.
[9] H. Tuo,“Analysis of a reheat carbon dioxide transcritical power cycle using a low temperature heat source,” inASME 2011 In- ternational Conference on Environmental Engineering and Appli- cations, Parts A and B, Denver, Colorado, USA, November 11–17, 2011, 2011, pp. 219–225.
[10] H. Chen, D. Y. Goswami, and E. K. Stefanakos, “A review of thermodynamic cycles and workingfluids for the conversion of low-grade heat,” Renew. Sustain. Energ. Rev., vol. 14, no. 9, pp. 3059–3067, 2010.
[11] P. Dutta and P. Kumar,“Supercritical carbon dioxide-based power cycles,” in Encyclopedia of Sustainable Technologies, M. A.
Abraham (ed.) Elsevier, pp. 419–428, 2017.
[12] A. A. AlZahrani and I. Dincer, “Thermodynamic analysis of an integrated transcritical carbon dioxide power cycle for concentrated solar power systems,”Sol. Energ., vol. 170, pp. 557–567, 2018.
[13] J. Meng, M. Wei, P. Song, R. Tian, L. Hao, and S. Zheng,
“Performance evaluation of a solar transcritical carbon dioxide Rankine cycle integrated with compressed air energy storage,” Energy Convers. Manag., vol. 215, Paper no. 112931, 2020.
[14] C. Wu, S. S. Wang, and J. Li,“Parametric study on the effects of a recuperator on the design and off-design performances for a CO2 transcritical power cycle for low temperature geothermal plants,” Appl. Therm. Eng., vol. 137, pp. 644–658, 2018.
[15] J. Xia, J. Wang, G. Zhang, J. Lou, P. Zhao, and Y. Dai,“Thermo- economic analysis and comparative study of transcritical power cycles using CO2-based mixtures as workingfluids,”Appl. Therm.
Eng., vol. 144, pp. 31–44, 2018.
[16] C. Wu, S. S. Wang, X. Jiang, and J. Li,“Thermodynamic analysis and performance optimization of transcritical power cycles using CO2-based binary zeotropic mixtures as workingfluids for geothermal power plants,”Appl. Therm. Eng., vol. 115, pp. 292–304, 2017.
[17] F. Meng, E. Wang, B. Zhang, F. Zhang, and C. Zhao,“Thermo- economic analysis of transcritical CO2power cycle and compar- ison with Kalina cycle and ORC for a low-temperature heat source,”Energ. Convers. Manag., vol. 195, pp. 1295–1308, 2019.
[18] L. Pan, B. Li, W. Shi, and X. Wei, “Optimization of the self- condensing CO2 transcritical power cycle using solar thermal energy,”Appl. Energ., vol. 253, Paper no. 113608, 2019.
[19] L. Pan, W. Shi, X. Wei, T. Li, and B. Li,“Experimental verification of the self-condensing CO2 transcritical power cycle,” Energy, vol. 198, Paper no. 117335, 2020.
[20] M. Li, J. Wang, S. Li, X. Wang, W. He, and Y. Dai,“Thermo-economic analysis and comparison of a CO2transcritical power cycle and an organic Rankine cycle,”Geothermics, vol. 50, pp. 101–111, 2014.
[21] W. Xia, Y. Huo, Y. Song, J. Han, and Y. Dai,“Off-design analysis of a CO2Rankine cycle for the recovery of LNG cold energy with ambient air as heat source,” Energ. Convers. Manag., vol. 183, pp. 116–125, 2019.
[22] L. L. Shao and C. L. Zhang, “Thermodynamic transition from subcritical to transcritical CO2 cycle,” Int. J. Refrig., vol. 64, pp. 123–129, 2016.
[23] A. R. Imre and A. Groniewsky,“Various ways of adiabatic expan- sion in Organic Rankine Cycle (ORC) and in Trilateral Flash Cycle (TFC),”Zeitschrift Phys. Chem., vol. 233, no. 4, pp. 577–594, 2019.
[24] P. Kumar and K. Srinivasan,“Carbon dioxide based power gen- eration in renewable energy systems,”Appl. Therm. Eng., vol. 109, pp. 831–840, 2016.
[25] G. Gy€orke, U. K. Deiters, A. Groniewsky, I. Lassu, and A. R. Imre,
“Novel classification of pure workingfluids for organic Rankine cycle,”Energy, vol. 145, pp. 288–300, 2018.
[26] Y. Chen, Novel Cycles Using Carbon Dioxide as Working Fluid.
Stockholm, KTH: School of Industrial Engineering and Manage- ment. 2006.
[27]NIST Chemistry Webbook. NIST Standard Reference Database, Number 69, 2018. [Online]. Available: https://webbook.nist.gov/
chemistry/. Accessed: Feb. 1, 2020.
[28] A. M. Ahmed, L. Kondor, and A. R. Imre,“Thermodynamic ef- ficiency maximum of simple organic Rankine cycles,” Energies, vol. 14, no. 2, pp. 307–323, 2021.
Open Access. This is an open-access article distributed under the terms of the Creative Commons Attribution 4.0 International License (https://creativecommons.org/
licenses/by/4.0/), which permits unrestricted use, distribution, and reproduction in any medium, provided the original author and source are credited, a link to the CC License is provided, and changes–if any–are indicated. (SID_1)
![Table 1. Properties of carbon dioxide (Source: on the basis of [26])](https://thumb-eu.123doks.com/thumbv2/9dokorg/731947.29210/3.892.99.418.114.755/table-properties-carbon-dioxide-source-basis.webp)