Introduction
Soil nitrogen (N) and carbon (C) ratio can provide essen- tial information on soil health such as nitrogen limitation for plants or soil microorganisms. Determining soil C/N ratios can be challenging for larger geographic units such as for catchments, as nitrogen heterogeneity depends on several factors like land use, soil types, vegetation cover or season- ality. This paper investigates C/N ratio changes at different levels for diverse land management and land uses at plot-, catchment-, and country scale in Hungary. For the plot- and catchment scale the study also presents data on seasonal variabilities in C/N ratio. For the countrywide evaluation, a digital soil mapping method was applied.
The paper contributes to the existing literature by pro- viding a dataset for supporting national soil nutrient emis- sion modelling. The paper is structured as follows. Section 2 provides a review of the academic literature on the topic, followed by a demonstration of the methodology. Section 4 describes our results, followed by a discussion and conclu- sions.
Literature Review
C/N ratio is considered as an indicator determining the decomposability of soil organic matter, while the nitrogen (N) is a key component of nutrient cycling. Nitrogen is one of the main nutrients responsible for balanced crop produc- tion as well as the quality and quantity of the crop yield. Part of the N not used by the plants can pollute the environment
in different ways. During nitrate (NO3−) leaching or surface runoff the portion of N can reach the groundwater and can enter the aquatic systems, resulting eutrophication. Another pathway of N loss is the N2O emission or NH3 volatilization (Zheng et al., 2019). The agricultural sector is one of the main sources of groundwater nitrate pollution and atmos- pheric N2O content increase (Van der Voet et al., 1996).
The C/N ratio of soil represents the amount of total nitro- gen (TN) per unit total carbon (TC) content of soil. It is con- sidered an indicator determining the mineralisation, immo- bilisation and nitrification rate in the soil (Bengtsson et al., 2003). From the C/N ratio value, the decomposition state of the soil organic matter can be estimated (Zhao et al., 2015).
In general, ratios above 25 indicate slow rates of decomposi- tion, whereas ratios below 25 represent increasingly faster rates of organic matter decomposition (Blume et al., 2010).
It is also a good index from which to obtain information about soil fertility, since there is a strong interrelationship between soil organic carbon and total nitrogen content (TN) (Bogunovic et al., 2018). TN content in soils is also a use- ful indicator to get information about soil nutrient status at a given time. The C/N ratio can be higher than 25 in peats, where organic matter accumulation occurs. However, it is usually between 10 and 12 in managed, arable soils under temperate climate. Lower rates generally occur in deeper soil layers (Bui et al., 2013). The C/N ratio gives important information about the amount of nitrogen potentially avail- able to the plants from the soil. Any change in the C/N ratio will have a profound effect on both the nitrogen cycle in the area and the structure and composition of the soil microbial community (Horel et al., 2018a,b). Soil microbial communi- Zsófia BAKACSI*, Annamária LABORCZI*, Gábor SZATMÁRI*, Ágota HOREL*, Márton DENCSŐ*,
Sándor MOLNÁR*, Emese UJJ* and Eszter TÓTH*
Compiling C/N and total-N dataset to support countrywide soil nutrient emission models for Hungary
Soil carbon/nitrogen (C/N) ratios can provide essential information on soil health such as nitrogen limitations for plants or soil microorganisms. Determining soil C/N ratios can be challenging for larger geographic units such as for catchments, as nitro- gen heterogeneity depends on several factors like land use, soil types, vegetation cover or seasonality. This paper investigates C/N ratio changes at different levels for diverse land management and land uses at plot-, catchment-, and country scale. For the plot- and catchment scale the study also presents data on seasonal variabilities of C/N ratio. For the countrywide evalua- tion, a digital soil mapping method was applied. Substantial differences were noted in total nitrogen amounts for arable lands, where the ‘no till’ system had up to 54.7% higher TN compared with ploughing. Catchment based monitoring showed the high- est fluctuations for TN in the case of forest soils, while C/N ratios were relatively stable over the course of different seasons for the diverse land uses. Comparison of the topsoil C to N ratios in the European LUCAS and national SIM datasets shows that the difference in expected values is considerable (consecutively 10.35 and 7.41). The discrepancy can be explained partly due to different thematic representativity for land use and partly because of differences in analytical methodology. In addition, samples were taken almost twenty years apart. Overall, our study highlights the significance of land use, land management systems, spatial heterogeneity, time of samples collections, and the inconsistencies between different sampling and measure- ment methods.
Keywords: C to N ratio in soils, emission modelling, countrywide map JEL classifications: Q10, Q24
* Hungarian Academy of Sciences, Institute for Soil Sciences and Agricultural Chemistry, Centre for Agricultural Research (MTA ATK TAKI). Herman Ottó út 15, Budapest, H-1022, Hungary. Corresponding author: laborczi.annamaria@agrar.mta.hu
Received: 17 March 2020, Revised: 12 June 2020, Accepted: 14 June 2020.
ties show average ratios of 8, green cuttings and clippings between 7 and 15, decaying organic matter around 20 and raw humus between 25 and 40 (Blume et al., 2010).
The C/N ratio value can be influenced by several fac- tors. Miller et al. (2004) determined that the mean annual temperature and the mean annual precipitation influence the C/N ratio in soils. Increasing mean annual precipitation and decreasing mean annual temperature increase the C/N ratio.
Moreover, the C/N ratio is also influenced by soil charac- teristics. Vejre et al. (2003) reported that the C/N ratio was negatively correlated with clay content in Danish forest soils. Callesen et al. (2007) obtained similar findings. They collected 198 soil profiles data into 4 groups (fine, coarse, medium and calcareous) based on clay content of the soil. In the 0-10 and 10-20 cm depth higher C/N ratio was observed in coarse soils than in medium ones (Callesen et al., 2007).
Since soil organic matter are more humidified in deeper soil layers than closer to the surface, normally the C/N ratio also decreases with soil depth. Since the C/N ratio is highly cor- related with the quantity and quality of organic matter in the soil, the more diverse the surface coverage of a given area (such as small catchment), the more difficult it is to estimate or measure an average (single) value for that area. Moreover, not only is the C/N ratio highly variable in the areal base, its temporal variation can be also significant.
Vegetation, climate and organisms all together play a decisive role in the formation of certain soils, as well as in the quality and quantity of organic matter typical of a given soil type, and this might be traced broadly to the total nitrogen content of each soil types. Nitrogen compounds in soils are predominantly organic and proportional to humic substances (Stefanovits, 1963), as also confirmed by Ratner (1963). Measuring the total nutrient content of the upper soil layer, Ratner (1963) found that the N content in each type was as follows: Sandy soils: 0.05%; Brown forest soils:
0.1%; Meadow and Meadow-Chernozem transition soils:
0.2% and Wetland soils: 0.5%. The C/N ratio is also affected by the quality and stability of the humic substances present in the soil. Vegetation cover has a great impact on soil C/N ratio, moreover, in natural ecosystems it is highly climate dependent. It shows the equilibrium value formed by natu- ral factors of a given soil. In the case of Hungary, Stefano- vits (1963) stated that low C/N ratios were typical of two types: marshlands where nitrogen accumulation was actually occurring (typically high total nitrogen, may exceed 10,000 mg/kg) and nutrient-poor forest soils with low organic mat- ter content.
The temperate belt has an equilibrium position of C/N between 17 and 33. Above 33, immobilisation occurs (nitro- gen is incorporated into the soil humus pool). In European forest soils, this ratio varies in a wide range, between 16 and 44, depending on the forest type (Cools et al., 2014). At the same time, Díaz-Raviña et al. (1995) found that along with soil type, season has significant effect on nitrogen flush when investigating forest soils, which can consequently influence the C/N ratio. Vegetation type can also influence soil C/N ratios, even within forest soils depending on the tree species such as conifers or broadleaves (Dawud et al., 2016). In the long term, the C/N ratio can vary between a given range, depending on climatic conditions and vegetation types.
Agricultural management, especially intensive till- age application can cause carbon loss in soil (Tóth et al., 2018, Mesic et al., 2014). Soil disturbance followed by till- age results oxygen rich circumstances and the oxidation of carbon stocks (Jakab et al., 2014, Jakab et al., 2019). Even more, crop residues are also often removed from fields which also leads to carbon losses; however, the nitrogen content of the soil is kept in an appropriate level with fertilizer usage (Tóth et al., 2018). The C/N ratio in cultivated surface lay- ers is about 12 (median value) and is generally lower in the deeper part of the soil profile (Brady and Weil, 2010). The C/N ratio can decrease in managed soils with time. Mesic et al. (2014) found that after several centuries of agricultural use, SOC in surface horizons was reduced by 51-60% in Croatian Pannonian plain. However, good agricultural prac- tice, when aboveground crop residue is also kept in field or minimum tillage, can increase carbons stocks, and also the C/N ratio in soil (Miller et al., 2004, Puget and Lal, 2005, Six et al., 2000.)
On a global scale, the ISRIC-WISE Soil Property Data- base (Batjes, 1996) can provide data for the C/N ratio, com- piled in a map, and its range in legend is 8-29. In Europe, the Geochemical Mapping of Agricultural and Grazing land Soil (GEMAS) project aimed to detect and map natural back- ground element (including C and N) variations in topsoil.
In the GEMAS project, the participant countries collected paired geochemical data for ploughed agricultural soils and for non-cultivated (at least 10 years) ones (Reimann et al., 2012, Fabian et al., 2014; Birke et al., 2017). The GEMAS sampling was made from summer 2008 to early spring 2009. 4132 soil samples (2108 samples: regularly ploughed agricultural fields (0–20 cm) and 2024 samples: land under permanent grass cover (0–10 cm)) were collected in 33 European countries. The average sampling density was 2500 km2 per site (50 km × 50 km grid). For quality control, the participants collected duplicate samples at every twentieth field site. There were 35 sampling sites in Hungary. The C/N data and maps were published recently (Matschullat et al., 2018), however, the TC, TOC and S (total and aqua regia) maps were released prior. On account of the uncertainty of the total C and S data in the original GEMAS dataset, all samples were analysed again. Matschullat et al. (2018) have interpreted the previously missing total nitrogen (TN) data and the new total carbon (TC) and total sulphur (TS) data.
Very small TOC/TN ratios were measured at several loca- tions, including the sampling point around Lake Balaton.
According to Blume et al. (2010), under temperate condi- tions, common C to N ratios in grassland topsoil are around 11 and for arable soil approximately 14, while forest soils have ratios of around 21 and above. As a result, in GEMAS the median value of C to N ratio was 10.1, resembling soils under temperate forests, comprised of humified soil material, indicating healthy soil conditions. Most data represented C and N ratios between 8 and 15, indicating good biological decomposition rates.
In Europe, one of the most widespread models for coun- trywide nutrient load estimates is MONERIS. The purpose of the model is to determine the nutrient load at national level in which the data requirements for soils must be aggregated to a small hydrological catchment level. From a methodologi-
cal point of view, it is a semi-empirical, conceptual model designed to characterize medium and large river basin nutri- ent flows. The aim of the modelling is to estimate the annual (multi-year) average total phosphorus and total nitrogen dis- charges to surface waters at national level. For the model, it is necessary to determine the total nitrogen content of the soil as input data. This can be derived either directly from the total nitrogen measurements of soil samples or from the soil (and vegetation)-specific total organic carbon to total nitro- gen (C/N) ratio, derived from the amount of organic matter and land use types. As organic matter (or humus) content measurement is one of the basic soil tests done frequently in soil science, data on this is more commonly available than total-N values.
In addition to the different spatial pattern and number of available point data populations, differences in measurement methodologies may also result in differences in mean C/N ratios and total nitrogen contents for the same categories (soil type, texture variety). While the C/N determination of a given soil sample can be relatively straightforward by a variety of analytical methods, it is more difficult to provide a value representing larger areas due to spatial heterogeneity and depth of soil column changes due to large changes in soil characteristics such as microbial communities. Organic mat- ter produced by soil microbes typically has a C to N ratio of 5:1 to 10:1, with an average of 8:1. Studies show that organic matter from microbial metabolic residues can account for up to 80% of soil organic carbon (Liang and Balser, 2010).
For countrywide modelling purposes, a more spatially representative database is needed to meet inputs at the small river basin level. Uniformly measured and countrywide col- lected data on soil carbon and nitrogen are provided for the national Soil Information and Monitoring System (SIMS) and a part of the international Land Use / Land Cover Area Frame Survey (LUCAS) point databases.
Methodology
We studied seasonal variability of C/N ratio within a small catchment and investigated the characteristic C/N ratio and total-N content in two independent datasets for different soil types. Our dataset is based on the data available in the ATK TAKI, as well as in the Hungarian Soil Information and Monitoring System (SIMS, 1995) and European LUCAS (Land Use / Land Cover Area Frame Survey) soil databases (Eurostat 2018). The LUCAS soil survey was carried out in the EU-25 in 2009, and in 2012 in two additional Member States and in Iceland in the 0-20 cm soil layer. Out of the more than 22,000 recorded points, nearly 500 cover Hun- gary. The 2009 samples were analysed at SGS Hungaria’s Kecskemét laboratory. Organic carbon and total nitrogen data are available at 497 points. We selected those sites and profiles for which data from all N measurements (preferably supplemented with organic C data) were available.
Seasonal variability of C/N ratio in given sites within a small catchment was studied in Csorsza-catchment (which relates to Lake Balaton).
In 1993, total nitrogen measurements for the soils are available for 1235 sites in the Soil Information and Moni-
toring System (SIMS 1995). After unifying the nitrogen data in the SIMS database by filtering out internal contra- dictions (e.g. data recorded in different units at the begin- ning, year 1993), 1175 data remained and were used to characterize C/N data for soils. In 2007, SIMS data on total nitrogen were available for about 200 fewer sites than before. Because of the more complete data set of 1993, that was used in further spatial prediction, mapping the total carbon and nitrogen content of the soil. For the samples collected at the Csorsza catchment, the soil organic carbon (SOC) contents were measured by wet digestion method.
In addition, we also measured CaCO3 contents using Schei- bler calcimeter for the arable and vineyard soils from the catchment.
The total-N content of soil samples can be determined by steam distillation and titration after acid digestion of the sample (this method was used in the Soil Information and Monitoring -SIMS points; MSZ-08-0458-1980). The total nitrogen for the Csorsza catchment samples was determined using the modified Kjeldahl method (ISO 11261:1995). The nitrogen content can also be measured by elemental analysis (e.g. with CNS analyser). This involves burning the sample at a given temperature to calculate the total element content, the retention times recorded during the process, and the area under the curves they describe (this method was used in the LUCAS European Soil Database). The results obtained by the two methods are comparable, but they have different reli- ability in low and high organic matter samples (Avramidis et al., 2015) and cannot be converted by a single conversion factor.
Applied digital soil mapping methods
Nationwide map of Soil Organic Matter content was com- piled by regression kriging (RK). RK is a hybrid model that combines geostatistics with classical statistical technique. In RK, the target variable is modelled at first by Multiple Linear Regression (MLR) of the environmental co-variables. Then Ordinary Kriging is applied on the difference between the reference and the modelled values (residuals). The predic- tion result map comes from the sum of the MLR model and the interpolated residuals.
Nationwide total nitrogen content mapping was carried out using the quantile regression forest (QRF) method. QRF is a novel approach in DSM, which is based on random for- est (RF; Breiman, 2001). RF is an ensemble of classification or regression trees, generated by random subsets of train- ing data, and then these trees can be used for prediction.
The key difference between random forest and QRF can be summarised as follows: for each node in each tree, random forest keeps only the mean of the observations that fall into this node and neglects all other information, whereas QRF keeps not just their mean but the value of all observations in this node. Based on this information, not just a prediction but an empirical distribution function can be derived that can be used for quantifying the prediction uncertainty. In addition, QRF keeps the advantages of random forest, i.e. it can fit complex, non-linear relationships and the correlation between the environmental covariates is not a limiting factor.
(Meinshausen 2006, Szatmári et al., 2019).
The main reference datasets for digital mapping were as follows:
• Hungarian Soil Information and Monitoring System (SIMS, 1995) is a nationwide soil monitoring pro- gramme, which provides soil information from 1235 locations. Due to the standardised methodology and the accredited laboratory measurements, SIMS is the most unified and thematically detailed, up-to-date soil-related database in Hungary. We used sampling plots as reference data for SOM content as well as nitrogen content mapping.
• Digital Kreybig Soil Information System (DKSIS, Pásztor et al., 2012) is the most detailed spatial dataset related to soils covering the whole country.
It simultaneously contains two types of geometric datasets: soil mapping units (SMUs) and sampling plots. We used sampling plots as reference data for SOM content mapping. During the original survey, detailed soil properties (among them soil organic matter content) were determined and measured in soil profiles. There are representative profile descrip- tions in the database for about 22,000 plots, which are transferred for further locations summarizing approximately 250,000 plots. SMU layers of DKSIS were used as environmental co-variables (detailed in Section ‘Applied environmental co-variables for digital mapping’).
• Data of National Pedological and Crop Production Database (AIIR in Hungarian) was collected in 1970s and 1980s by the legal predecessor of National Food Chain Safety Office (NÉBIH, Hungary). The recently available data originate from the period 1984–1990.
The database contains laboratory analysis data of soil properties (among them soil organic matter content) as well as cultivation information from 80,000 par- cels (Kocsis et al., 2014). We used reference points from AIIR only for SOM content mapping.
Environmental factors that are related to soil forming processes were also taken into consideration in the mapping process. The following so-called environmental co-variables were involved into the spatial prediction of SOM content and total nitrogen content mapping.
• Genetic soil type map of Hungary (Pásztor et al., 2018) from DOSoReMI.hu database that includes 31 taxonomic soil types according to the Hungarian soil classification system. It was used only in nitrogen content mapping.
• Climate was represented by four relevant features:
average annual precipitation, average annual temper- ature, average annual evaporation and average annual evapotranspiration. The spatial layers were compiled using the MISH method elaborated for the spatial interpolation of surface meteorological elements based on 30-year observation of the Hungarian Mete- orological Service with 0.5′ resolution (Szentimrey and Bihari, 2004).
• Organisms, as vegetation types were taken into account based on the CORINE Land Cover (CLC) inventory products (CLC European Environment Agency).
• Digital Elevation Model (EU-DEM; Bashfield and Keim, 2011) and the following morphometric deriva- tives were applied as environmental auxiliary layers:
Altitude, Channel network base level, Diurnal ani- sotropic heating, Horizontal distance to channel net- work, LS factor, Mass balance index, Multiresolution ridge top flatness index, Multiresolution valley bot- tom flatness index, Multi-scale topographic position index, Profile curvature, SAGA wetness index, Slope, Stream power index, Surface area, Terrain rugged- ness index, Topographic position index, Topographic wetness index, Total curvature, Vertical distance to channel network. The terrain features were calculated from the DEM in SAGA GIS (Conrad et al., 2015) environment.
• Lithology was represented by the Geological Map of Hungary 1:100,000. The units of the map were correlated with the nomenclature of parent material defined in the FAO Guidelines for soil description (Bakacsi et al., 2014).
• Only in SOM content mapping, we applied SMU layers with physical and chemical soil property cat- egories from Digital Kreybig Soil Information Sys- tem (DKSIS, Pásztor et al., 2012). Physical soil cat- egories were attributed according to water retention capability, permeability and infiltration rate; chemical categories were derived from pH and calcium carbon- ate content of soils.
• Only in SOM content mapping, MODIS images from two dates (16 March 2012 and 7 September 2013) representing different phases and states of vegetation were chosen for mapping. Red, near-infrared (NIR) bands as well as Normalized Difference Vegetation Index (NDVI) were used from both dates (MODIS 09 products). Furthermore, two NDVI products (MOD13Q1) were involved, which provide informa- tion from a 16-day period (13–28 March 2012 and 5–20 September 2013). The spatial resolution of the images is 250 m.
Results and Discussion
Seasonal variability
In the last 10 years, total C and N data are available in 19 locations (and additional 4 points in time series) in the Institute for Soil Sciences and Agricultural Chemistry.
There are available total N data under four different surface coverings (namely arable, vineyard, meadows, forest) for Csorsza catchment, measured consecutively each month in 2016 in topsoil. The area covered by weakly to mod- erately eroded, loamy textured brown forest soils (mostly Cambisols or Luvisols, according to World Reference Base for Soil Resources. One-year averages for C/N ratios and total nitrogen (mg/kg) values were as follows: arable: 7.71 and 2257; vineyard: 8.62 and 2336; meadows: 9.35 and 3486; forest: 9.65 and 4494. Measured at the same point, the annual data series (Figure 1) show that the degree of
polt, Nagyhegyes, Orosháza, Szarvas, Szeged, Szekszárd, Őrbottyán, Mezőnagymihály, Martonvásár, Nagykálló and Öreglak), comparing with texture. The low organic matter content of soils with light mechanical composition (sand, sandy loam) can be traced to changes in the total nitrogen content (even within the same soil type).
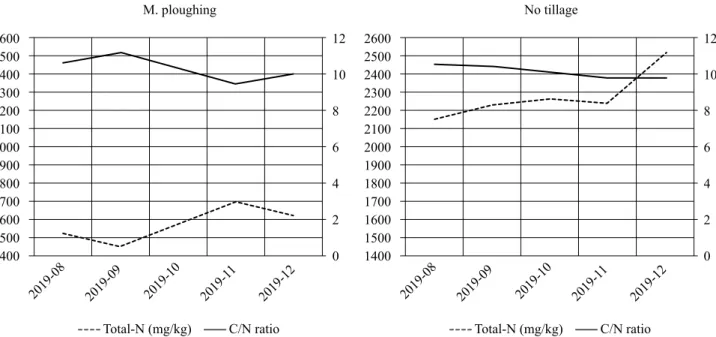
The effects of different soil managements systems on soil N and C contents were investigated by Tóth et al. (2018) at Józsefmajor (Chernozems). Even at a same experimen- tal site, the soil management can greatly influence the total nitrogen content (Figure 2), which was much lower in the case of mouldboard ploughing, than for the no tillage soils, based on samples collected after winter wheat harvest in late autumn 2019.
seasonal fluctuation in nitrogen content can be as much as double the lowest value. Based on this experiment, taking into account the possible extent of the seasonal variation in nitrogen content (Figure 1), in further data filtering we selected points showing excessive fluctuation and kept points for spatial prediction (915 points of SIMS) in which the difference between the values measured at two times was not more than twice.
Under the same land management, the total nitrogen content may vary with both soil types and textures. Table 1 shows the C/N ratio and total N content of samples col- lected during the last 10 years from 19 arable land sites under conventional tillage (Agárd, Kenyeri, Keszthely, Gyula- tanya, Bicsérd, Iregszemcse, Nagyhörcsök, Karcag, Kom-
2016-012016-022016-032016-042016-052016-062016-072016-082016-092016-102016-1 1 2016-12 Arable
12 6000
5500 5000 4500 4000 3500 3000 2500 2000
1500 0
2 4 6 8 10
Total-N (mg/kg) C/N ratio
2016-012016-022016-032016-042016-052016-062016-072016-082016-092016-102016-1 1 2016-12 Meadows
12 6000
5500 5000 4500 4000 3500 3000 2500 2000
1500 0
2 4 6 8 10
Total-N (mg/kg) C/N ratio
2016-012016-022016-032016-042016-052016-062016-072016-082016-092016-102016-1 1 2016-12 Vineyard
12 6000
5500 5000 4500 4000 3500 3000 2500 2000
1500 0
2 4 6 8 10
Total-N (mg/kg) C/N ratio
2016-012016-022016-032016-042016-052016-062016-072016-082016-092016-102016-1 1 2016-12 Forest
12 6000
5500 5000 4500 4000 3500 3000 2500 2000
1500 0
2 4 6 8 10
Total-N (mg/kg) C/N ratio
Figure 1: Seasonal changes in total nitrogen content of the topsoil and associated C/N ratio under four different surface coverings in samples from the Csorsza catchment area.
Source: wn composition
Table 1: Topsoil data for C/N ratio and total nitrogen content vs. their texture in 19 samples from conventionally managed arable lands.
Texture Number mean C/N ratio (SD) mean total N (mg/kg) and (SD)
sand 4 8.27 (1.91) 813 (479)
sandy loam 3 7.92 (1.99) 1,433 (155)
loam 8 9.55 (1.91) 1,713 (153)
clay loam 4 11.30 (1.40) 1,975 (596)
SD = standard deviation.
Source: own composition
C/N ratio and total-N in SIMS and LUCAS databases
Comparison of descriptive statistics of LUCAS and SIMS databases concerning topsoil C to N ratios shows that the difference in expected values is considerable (Table 2).
The lower limit of the 95% confidential interval for LUCAS’
expected value is higher than the upper limit for TIM C/N data under the same condition.
The reason for the discrepancy originates partly from different thematic representativity for land use (Figure 3) and partly from different analytical methodology. In addi- tion, samples were taken almost twenty years apart. The titration method (SIMS) is more accurate in low concen-
trations, while in the case of higher organic load the com- bustion method (LUCAS) gives better results (Avramidis et al., 2015). The expected value for the whole database (497 cases) for LUCAS is close to the temperate grasslands’
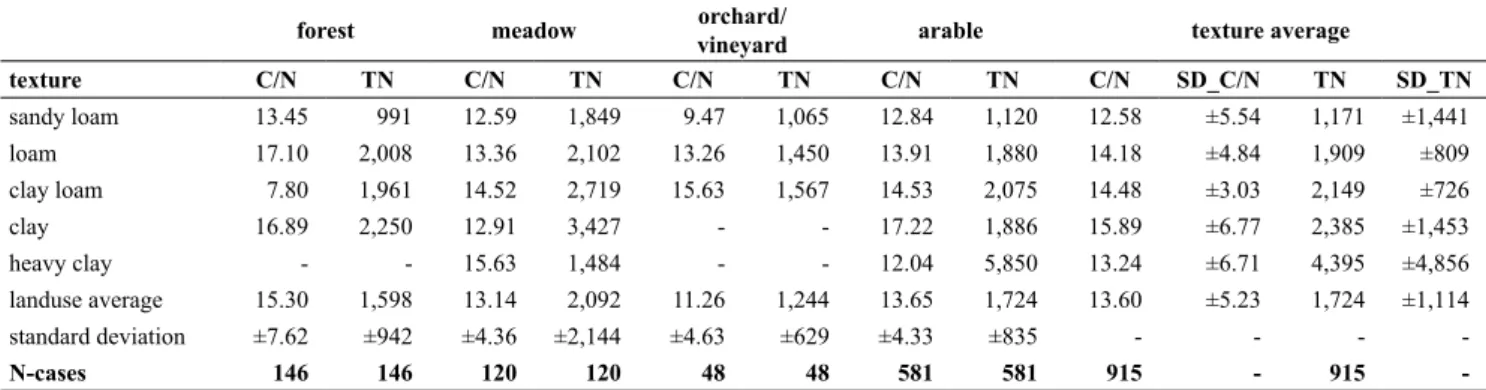
empirical value of 11. Evaluation of SIMS data showed that soil texture plays a crucial role in the same surface coverage (Table 3).
To demonstrate different thematic representativity of datasets and the effect of surface coverage on C/N ratio, we compared the two databases for the CORINE “forests and semi natural” land use categories (Figure 3). 96 points in LUCAS and 168 points in SIMS were available for C/N evaluation. Apart from two land use categories, the number of points in each CORINE units does not exceed 15. The
2019-08 2019-09 2019-10 2019-1
1
2019-12 M. ploughing
12 2600
2500
2200 2400 2300 2100 2000 1900 1800 1700 1600 1500
1400 0
2 4 6 8 10
Total-N (mg/kg) C/N ratio
2019-08 2019-09 2019-10 2019-1
1
2019-12 No tillage
12 2600
2500
2200 2400 2300 2100 2000 1900 1800 1700 1600 1500
1400 0
2 4 6 8 10
Total-N (mg/kg) C/N ratio
Figure 2: Seasonal changes in total nitrogen content of the topsoil and associated C/N ratio under mouldboard (M) ploughing and no tillage management, mulching in both cases, in Józsefmajor (Chernozems).
Source: own composition
Table 2: Descriptive statistics of LUCAS and SIMS databases.
C to N data
LUCAS SIMS
Expected value 10.35 7.41
Standard error 0.08 0.09
Median 10.29 7.52
Mode 10.00 8.12
Standard deviation 1.79 3.11
Variance 3.19 9.70
Kurtosis 9.19 3.68
Skewness 1.79 0.95
Range 17.32 24.94
Minimum 5.46 1.00
Maximum 22.78 25.94
Sum 5,144.59 8,708.67
Number 497 1175
95% confidental interval 0.16 0.18
Lower limit of the 95% confidental interval for expected value 10.27 7.32
Upper limit of the 95% confidental interval for expected value 10.43 7.50
Source: own composition
Table 3: Texture-averaged C/N and total nitrogen content within simplified CORINE land use categories, according to the SIMS database.
forest meadow orchard/
vineyard arable texture average
texture C/N TN C/N TN C/N TN C/N TN C/N SD_C/N TN SD_TN
sandy loam 13.45 991 12.59 1,849 9.47 1,065 12.84 1,120 12.58 ±5.54 1,171 ±1,441
loam 17.10 2,008 13.36 2,102 13.26 1,450 13.91 1,880 14.18 ±4.84 1,909 ±809
clay loam 7.80 1,961 14.52 2,719 15.63 1,567 14.53 2,075 14.48 ±3.03 2,149 ±726
clay 16.89 2,250 12.91 3,427 - - 17.22 1,886 15.89 ±6.77 2,385 ±1,453
heavy clay - - 15.63 1,484 - - 12.04 5,850 13.24 ±6.71 4,395 ±4,856
landuse average 15.30 1,598 13.14 2,092 11.26 1,244 13.65 1,724 13.60 ±5.23 1,724 ±1,114
standard deviation ±7.62 ±942 ±4.36 ±2,144 ±4.63 ±629 ±4.33 ±835 - - - -
N-cases 146 146 120 120 48 48 581 581 915 - 915 -
Source: own composition
average C/N ratio for the most common surface cover cat- egory as “Natural deciduous forests with closed canopy in non-wetlands” with a total 85 points from SIMS is 8.89 and 12.05 for the 17 points of LUCAS. In case of “Deciduous forest plantations” with similar case numbers, the difference is smaller. In general, the C/N ratio calculated from SIMS was below the LUCAS value in all cases, in accordance with the expected values of the whole dataset (Table 2).
Spatial prediction
The base map of the expected nitrogen content was Soil Organic Matter (SOM) content map (100 m spatial resolu- tion) for 0-30 cm soil layer, compiled in the framework of the DOSoReMI.hu project. Digital, Optimized, Soil Related
Maps and Information in Hungary (DOSoReMI.hu) data- base collects novel soil property- and soil type maps as well as functional soil maps, compiled by up-to-date digital soil mapping methods. Nationwide map of Soil Organic Matter content was compiled by regression kriging, involving envi- ronmental co-variables (described in “methods”) into the prediction.
As first approximation, total nitrogen content was defined based on the C/N=11 ratio, which fits to the local climatic conditions, and was previously used in MONERIS models. We converted the values of the SOM content map to Soil Organic Carbon (SOC) content by the commonly acknowledged SOC [%] = SOM [%]/1.724 prediction ratio.
This approximation assumes that the organic matter of soil contains ~58 % carbon (Figure 4).
Natural grasslands with trees and shrubs Natural deciduous forsts with closed canopy, in wetland Mixed plantations Deciduous forest plantations Natural pine forests with closed canopy in non-wetlands Natural pine forests with closed canopy Open canopy natural deciduous forests in non-wetlands Coniferous plantations Group of mixed (deciduous and pine) forests with closed canopy Mixed stems (deciduous and pine) forests with closed canopy Young forests and cutting areas Natural grasslands without trees and shrubs Spontaneous shrub-deforestation
NLUCAS = 21 NLUCAS = 17
NLUCAS = 34 NSIMS = 34 NSIMS = 85
NSIMS = 85
Open canopy of natural deciduous forests, wetland 10.51
13.75 9.22 12.3
9.29 10.81 8.94 8.89 12.5
9,74 9,59
12.71 7.77
8.169.11 7.66
10.81 8.36
11.49 8.14
4.83 9.29 4.69
Mean C/N ratio (LUCAS) Mean C/N ratio (SIMS)
Figure 3: Mean C/N ratios in LUCAS (N = 96 points) and SIMS (N = 168 points) databases vs. CORINE “forests and semi natural areas”
land use categories, computed for Hungary.
Categories for which at least 15 data are available are marked separately (e.g. coniferous plantations, young forests).
Source: own composition
At the second approximation, nationwide total nitrogen content mapping was based on the reference data of Hun- garian Soil Information and Monitoring System (SIMS) by the quantile regression forest method (Szatmári et al., 2019). Environmental co-variables were described above (Figure 5).
Comparison of the mean values of total-N maps calcu- lated from C/N = 11 ratio and estimated from SIMS data and environmental co-variables (Figure 4, 5) shows that their spatial patterns are similar while values are shifting. The lowest nitrogen values outline the light-textured sandy areas (N-S directed Danube-Tisza Interfluve in mid-Hungary and Figure 4: Map of total-N content (mg/kg) derived from SOM content map, according to C/N = 11 ratios, averaged over small river catchments.
White coloured: main surface water bodies, Pale coloured units correlate with light texture soils.
Source: own composition
Figure 5: Map of total-N content (mg/kg) derived from SIMS nitrogen point data and environmental co-variables, with 100 m spatial resolution, averaged over small river catchments.
White coloured: main surface water bodies.
Source: own composition
the territory of Nyírség in the eastern part of the country). The darkest mapping units indicate the highest nitrogen contents usually related to wetlands (e.g. SW from Balaton Lake), river valleys and flood plains or in some cases accompanied by shallow soils developed on limestone in mid-mountain regions, with high SOC in topsoil (e.g. Rendzinas).
Conclusions
There are many factors influencing the total nitrogen content of the soil, including soil cover, vegetation types and period and soil texture. The light texture sand and sandy loam soils have low colloidal content compared to the other texture classes; their organic content is low, therefore their total nitrogen content was the lowest in each of the studied surface cover categories.
Both SIMS and LUCAS database showed that soil cover and soil types, which are intended to represent soil diversity, were correlated with total nitrogen. Using simplified land- cover categories, we found that in Hungarian soil vineyards and orchards have the smallest amount, grasslands (and wetlands) have the highest nitrogen content, while forests and arable lands are located between the two, with a slightly higher nitrogen content of arable lands, but with a high vari- ance in data. Compared to climate definition, differences in land use management or soil type might have minor effect on the convergence of soil organic matter C/N ratios in agri- cultural soils (Khan et al., 2016). However, environmental factors such as nutrient limitation can reduce microbial deg- radation of organic matter, resulting in a higher C/N ratio in forest soils compared to arable as found by Khan et al.
(2016). Our findings were similar, the cultivated soils (ara- ble, vineyard) had lower C/N ratios than forest or meadows (around 8 versus 9 or 10), which might be explained by the accumulation of less degraded plant residue in these land use types (Mesic et al., 2014).
Not only natural factors (e.g. soil composition, vegeta- tion) but also methodological factors of sampling and meas- urement (time of sampling and seasonal dynamics of nitro- gen content, values were measured on the same or different samples, different sample volumes, measurement methods) significantly influence the data on total nitrogen in the soil.
For the spatial prediction, we applied the pre-filtered data from the SIMS database using digital mapping tools ensur- ing that potential environmental factors that may affect soil nitrogen content were identified as environmental auxiliary variables and their cumulative effects would be present in the resulting maps.
Acknowledgements
This work has been supported by National Research, Development and Innovation Office (NKFIH) under grants OTKA PD 116084 and FK 131792.
Gábor Szatmári was supported by the Premium Postdoc- toral Scholarship of the Hungarian Academy of Sciences (PREMIUM-2019-390).
References
Avramidis, P., Konstantinos, N. and Vlasoula, B. (2015): Total Organic Carbon and Total nitrogen in Sediments and Soils:
A Comparison of the Wet Oxidation – Titration Method with the Combustion-Infrared Method. Agriculture and Agricul- tural Science Procedia, 4, 425–430. https://doi.org/10.1016/j.
aaspro.2015.03.048
Bakacsi, Z., Laborczi, A., Szabó, J., Takács, K. and Pásztor, L.
(2014): Az 1:100 000-es földtani térkép jelkulcsának és a FAO rendszer talajképző kőzet kódrendszerének javasolt megfele- ltetése. Agrokémia és Talajtan, 63 (2), 189–202. https://doi.
org/10.1556/Agrokem.63.2014.2.3
Bashfield, A. and Keim, A. (2011): Continent-wide DEM creation for the European Union. 34th International Symposium on Remote Sensing of Environment - The GEOSS Era: Towards Operational Environmental Monitoring. 10–15 April, 2011, Sydney, Australia.
Batjes, N-H. (1996): Total carbon and nitrogen in the soils of the world. European Journal of Soil Sciences. 47 (2), 151–163.
https://doi.org/10.1111/j.1365-2389.1996.tb01386.x
Bengtsson G., Bengtson P. and Mansson K.F. (2003): Gross nitro- gen mineralization-, immobilization-, and nitrification rates as a function of soil C/N ratio and microbial activity. Soil Biology &
Biochemistry 35 (1), 143–154. https://doi.org/10.1016/S0038- 0717(02)00248-1
Birke, M., Reimann, R., Oorts, K., Rauch, U., Demetriades, A., Dinelli, E., Ladenberger, A., Halamic, J., Gosar, M., Jähne- Klingberg, F. and The GEMAS Project Team (2016): Use of GEMAS data for risk assessment of cadmium in European ag- ricultural and grazing land soil under the REACH Regulation.
Applied Geochemistry 74, 109–121. https://doi.org/10.1016/j.
apgeochem.2016.08.014
Blume, H.-P., Brümmer, G.W., Horn, R., Kandeler, E., Kögel- Knabner, I., Kretzschmar, R., Stahr, K. and Wilke, B.-M.
(2010): Scheffer/Schachtschabel Lehrbuch der Bodenkunde.
Springer Spektrum; 16th edition. Spektrum Akademischer Ver- lag, Heidelberg.
Bogunovic, I., Pereira, P., Coric, R., Husnjak, S. and Brevik, E.C.
(2018): Spatial distribution of soil organic carbon and total nitrogen stocks in a karst polje located in Bosnia and Herze- govina. Environmental Earth Sciences 77, 612. https://doi.
org/10.1007/s12665-018-7801-z
Bui, E.N. and Henderson, B.L. (2013): C:N:P stoichiometry in Australian soils with respect to vegetation and environmental factors. Plant and Soil, 373, 553–568. https://doi.org/10.1007/
s11104-013-1823-9
Brady, N.C. and Wail, R.R. (2010): Elements of the Nature and Properties of Soils. Pearson Education, Prentice Hall, New Jer- sey, USA.
Callesen, I., Raulund-Rasmussen, K., Westman, C.J. and Tau- Strand, L. (2007): Nitrogen pools and C/N ratios in well- drained Nordic forest soils related to climate change and soil texture. Boreal Environment Research, 12 (6), 681–692.
Conrad, O., Bechtel, B., Bock, M., Dietrich, H., Fischer, E., Gerlitz, L., Wehberg, J., Wichmann, V. and Böhner, J. (2015): System for automated geoscientific analyses (SAGA) v. 2.1.4. Geo- scientific Model Development, 8 (7), 1991–2007. https://doi.
org/10.5194/gmd-8-1991-2015
Dawud, S.M., Raulund-Rasmussen, K., Domisch, T., Finér, L., Ja- roszewicz, B. and Vesterdal, L. (2016): Is tree species diversity or species identity the more important driver of soil carbon stocks, C/N Ratio, and pH? Ecosystems 19, 645–660. https://
doi.org/10.1007/s10021-016-9958-1
Díaz-Raviña, M., Acea, M.J. and Carballas, T. (1995): Seasonal changes in microbial biomass and nutrient flush in forest
soils. Biology and Fertility of Soils, 19, 220–226. https://doi.
org/10.1007/BF00336163
Eurostat (2018): LUCAS database. Retrieved from: https://
ec.europa.eu/eurostat/statistics-explained/index.php/ (Ac- cessed in January 2020).
Fabian, C., Reimann, C., Fabian, K., Birke, M., Baritz, R., Ha- slinger, E. and The GEMAS Project Team (2014): GEMAS:
spatial distribution of the pH of European agricultural and graz- ing land soil. Applied Geochemistry, 48, 207–216. https://doi.
org/10.1016/j.apgeochem.2014.07.017
Horel, A., Potyó, I., Szili-Kovács, T. and Molnár, S. (2018a): Po- tential nitrogen fixation changes under different land uses as influenced by seasons and biochar amendments. Arabian Jour- nal of Geosciences, 11, 559. https://doi.org/10.1007/s12517- 018-3916-5
Horel, Á., Tóth, E., Gelybó, G., Dencső, M. and Potyó, I. (2018b):
Soil CO2 and N2O emission drivers in a vineyard (Vitis vin- ifera) under different soil management systems and amend- ments. Sustainability, 10 (6), 1811. https://doi.org/10.3390/
su10061811
Jakab, G., Filep, T., Király, C., Madarász, B., Zacháry, D., Ringer, M., Vancsik, A., Gáspár, L. and Szalai, Z. (2019): Differences in mineral phase associated soil organic matter composition due to varying tillage intensity. Agronomy, 9 (11), 700. https://doi.
org/10.3390/agronomy9110700
Jakab, G., Kiss, K., Szalai, Z., Zboray, N., Németh, T. and Ma- darász, B. (2014): Soil Organic Carbon Redistribution by Erosion on Arable Fields, 289–296. In: Hartemink A. and McSweeney, K. (eds.) Soil Carbon. Progress in Soil Science.
Springer, Germany.
Khan, K.S., Mack, R., Castillo, X., Kaiser, M. and Joergensen, R.G. (2016): Microbial biomass, fungal and bacterial residues, and their relationships to the soil organic matter C/N/P/S ra- tios. Geoderma, 271,115–123. https://doi.org/10.1016/j.geo- derma.2016.02.019
Liang, C. and Balser, T.C. (2010): Microbial production of recal- citrant organic matter in global soils: Implications for produc- tivity and climate policy. Nature Reviews Microbiology, 9, 75.
https://doi.org/10.1038/nrmicro2386-c1
Matschullat, J., Reimann C., Birke M., dos Santos Carvalhod, D.
and The GEMAS Project Team (2018): GEMAS: CNS concen- trations and C/N ratios in European agricultural soil. Science of the Total Environment 627, 975–984. https://doi.org/10.1016/j.
scitotenv.2018.01.214
Meinshausen, N. (2006): Quantile regression forests. Journal of Machine Learning Research, 7, 983–999.
Mesic, M., Birkás M., Zgorelec C., Kisic I., Sestak I., Jurisic A. and Husnjak S. (2014): Soil Carbon Variability in Some Hungarian and Croatian Soils. In: Hartemink A. and McSweeney, K. (eds.) Soil Carbon. Progress in Soil Science. Springer, Germany.
Miller, A., Amundson, R., Burke, I.C. and Yonker, C. (2004):
The effect of climate and cultivation on soil organic C and N. Biogeochemistry, 67, 57–72. https://doi.org/10.1023/
B:BIOG.0000015302.16640.a5
Pásztor, L., Laborczi, A., Bakacsi, Z., Szabó, J. and Illés, G. (2018):
Compilation of a national soil-type map for Hungary by sequen- tial classification methods. Geoderma, 311, 93–108. https://doi.
org/10.1016/j.geoderma.2017.04.018
Patra, D.D., Brookes, P.C., Coleman, K. and Jenkinson, D.S.
(1990): Seasonal changes of soil microbial biomass in an arable
and a grassland soil which have been under uniform manage- ment for many years. Soil Biology and Biochemistry, 22 (6), 739–742. https://doi.org/10.1016/0038-0717(90)90151-O Puget, P. and Lal, R. (2005): Soil organic carbon and nitrogen
in a Mollisol in central Ohio as affected by tillage and land use. Soil and Tillage Research, 80 (1-2), 201–213. https://doi.
org/10.1016/j.still.2004.03.018
Ratner, E.I. (1963): A növények táplálkozása és a trágyázás.
Mezőgazdasági Kiadó, Budapest, Hungary.
Reimann, C., Filzmoser, P., Fabian, K., Hron, K., Birke, M., Dem- etriades, A., Dinelli, E., Ladenberger, A. and The GEMAS Pro- ject Team (2012): The concept of compositional data analysis in practice - Total major element concentrations in agricultural and grazing land soils of Europe. Science of the Total Environment, 426, 196–210. https://doi.org/10.1016/j.scitotenv.2012.02.032 SIMS (1995): Hungarian Soil Information and Monitoring System.
Methodology. Ministry of Agriculture, Plant Protecting and Agro-ecological Department, Budapest, Hungary.
Six, J., Eliott, E.T. and Paustian, K. (2000): Soil macroaggregate turnover and microaggregate formation: a mechanism for C sequestration under no-tillage agriculture. Soil Biology and Biochemistry, 32 (14), 2099–2103. https://doi.org/10.1016/
S0038-0717(00)00179-6
Stefanovits, P. (1963): Magyarország talajai. Akadémiai Kiadó, Budapest, Hungary.
Szatmári, G. and Pásztor, L. (2019): Comparison of various uncer- tainty modelling approaches based on geostatstics and machine learning algorithms. Geoderma, 337, 1329–1340. https://doi.
org/10.1016/j.geoderma.2018.09.008
Szatmári, G., Pirkó, B., Koós, S., Laborczi, A., Bakacsi, Zs, Sz- abó, J. and Pásztor, L. (2019): Spatio-temporal assessment of topsoil organic carbon stock change in Hungary. Soil and Tillage Research, 195, 104410. https://doi.org/10.1016/j.
still.2019.104410
Szentimrey, T. and Bihari, Z. (2004): Mathematical background of the spatial interpolation methods and the software MISH (me- teorological interpolation based on surface homogenized data basis). Proceedings from the Conference on Spatial Interpola- tion in Climatology and Meteorology, 25-29 October, 2004.
Budapest, Hungary.
Tóth, E., Gelybó, G., Dencső, M., Kása, I., Birkás, M. and Horel, Á. (2018): Soil CO2 emissions in a long-term tillage treatment experiment, 293–307. In: Muñoz, M.A. and Zornoza, R. (eds.):
Soil Management and Climate Change: Effects on Organic Carbon, Nitrogen Dynamics, and Greenhouse Gas Emissions.
Academic Press, USA.
Van der Voet, E., Kleijn, R. and De Haes, H. (1996): Nitrogen pol- lution in the European Union – origins and proposed solutions.
Environmental Conservation, 23 (2), 120–132. https://doi.
org/10.1017/S0376892900038509
Vejre, H., Callesen, I., Vesterdal, L. and Raulund-Rasmussen, K.
(2003): Carbon and Nitrogen in Danish Forest Soils – Contents and distribution determined by soil order. Soil Science Society of America Journal, 67 (1), 335–343. https://doi.org/10.2136/
sssaj2003.3350
Zheng, H., Liu, Z., Nie, X., Zuo, J. and Wang, L. (2019): Compari- son of active nitrogen loss in four pathways on a sloped peanut field with red soil in China under conventional fertilization conditions. Sustainability, 11, 6219. https://doi.org/10.3390/
su11226219