A GIS Tool to Express Soil Naturalness Grades and Geovisualization of Results on Tokaj Nagy- Hill
Dániel Balla
1, Marianna Zichar
2, Anikó Kozics
3, Tamás Mester
1, Tomáš Mikita
4, József Incze
1, Tibor József Novák
11 University of Debrecen, Department of Landscape Protection and Environmental Geography, Egyetem tér 1, H-4010 Debrecen, Hungary
2 University of Debrecen, Faculty of Informatics Department of Computer Graphics and Image Processing, Kassai út 26, Debrecen, Hungary
3 University of Debrecen, Department of Physical Geography and Geoinformatics, Egyetem tér 1, H-4010 Debrecen, Hungary
4 University of Mendel, Department of Forest Management and Applied Geoinformatics, Brno, Zemědělská 1665/1, Czech Republic
E-mails: balla.daniel@science.unideb.hu, zichar.marianna@inf.unideb.hu, kozics.aniko@science.unideb.hu, mester.tamas@science.unideb.hu, tomas.mikita@mendelu.cz, incze.jozsef@science.unideb.hu, novak.tibor@science.unideb.hu
Abstract: There are many possibilities for open access publishing of location-based information, as a result of the development of technology in the webGIS field.
Concurrently, geovisualization facilitates the interpretation and analysis of spatial data.
The aim of this study is to demonstrate a GIS tool that is able to automatically express the anthropogenic influences on soils based on land use/cover data and geovisualize their results on the web. We used ArcGIS and QGIS software for geoprocessing, classifying spatial data, and publishing them on the web. Generally, decreasing anthropogenic influence on soils could be detected on Tokaj-Nagy Hill throughout five investigation periods (1784-1858, 1858-1884, 1884-1940, 1940-1989, 1989-2010), as well as a decreasing intensity of human impacts. The results showed that representation of data with the geographic information system on the web is feasible, but also complex information from the map elements can be extracted which helps users better understand the spatial information.
Keywords: anthropogenic influences; land use changes; web-based visualization; WRB;
CogInfoCom
1 Introduction
Geographic information systems (GIS) provide great opportunities to describe, explain, interpret and analyze geospatial information. Traditionally, functions of these systems focus on four fields: data input, data management, data analysis, and data visualization. The term geovisualization was introduced to abbreviate the expression ‘geographic visualization’ in which the adjective refers to special characteristics of the features observed, namely that they also include information describing their location on the earth. Basically, this data component makes GIS differ from other information systems by having the ability to represent the features, phenomena based on their special data component. Finally, geovisualization can be considered as a subtype of the visualization technologies that deal with communication of information visually. According to general experience and several research findings, human understanding, exploration and analysis of data sets can be enhanced by applying visualization, which also supports the different cognitive processes running in the background [1]. The various technologies used for visualization can be classified based on several criteria (such as aim of the visualization, characteristics of the input data, etc.) [2].
The demand for digital representation of data based on their associated geospatial information has appeared in a growing number of disciplines (e.g. economics, archaeology, linguistics, environmental studies, urban planning, and health care).
Surprisingly, about 80% of all digital data generated nowadays includes some kind of information about geospatial referencing, which makes it clearly suitable them for geovisualization [3-4]. Several papers have demonstrated that a number of new technologies and techniques have been developed in the framework of various scientific collaborations and projects which have enriched this special field [5-6].
The interpretation of information related to geographic location is becoming an increasingly significant task. There are two main methods of data collection: data capture (including geodetic surveying and collection of data for statistics) and data transfer, where existing maps serve as data sources. In both cases the credibility, the resolution and the freshness of data are crucial when publishing on the web, as well. Maps on the web play an important role in sharing special information [7].
From a map demonstration perspective, we distinguish between static and dynamic maps, in order to introduce the current state of spatial and temporal changes and moving elements (for example land use change). Both types can be interactive or non-interactive. The development shows that the emphasis is on dynamic maps in professional applications [8]. There are several methods available for publishing static and dynamic maps. A static map is only a graphic object embedded into the website [9-10].
One of the most frequently used indicators to characterize the anthropogenic alteration of landscapes is the land use/cover which is now widely used, primarily due to the development and free availability of remote sensing methods and the
land use/cover databases that are based on them. Its application is supported not only by the easily classifiable information obtained from large areas by homogenous methods, but also by the fact that, beside vegetation, it is suitable for the characterization of the material quality of the vegetation-free surface, therefore making it possible to collect information regarding the two landscape features which are the most affected by anthropogenic influences. To characterize the anthropogenic alteration, Szilassi et al. (2015) used a method which is based on the combination of vegetation, land cover and soil data [11]. In a previous study (2006), Szilassi et al. attempted to assess the effects of historical soil changes on soils [12]. The soil information established, based on the WRB (World References Based Soil Resources) classification (IUSS WG WRB, 2015), provides an opportunity to describe the soils, and thereby the extent of anthropogenic effects/influences, in greater detail [13]. One of the major limitations of the application of WRB diagnostics units is that currently the amount of the available soil data which is described and classified in the WRB system is not sufficient to characterize the entire area of the country using data differentiated by landscape.
However, by comparing the WRB diagnostic units to the land use/cover categories, several anthropogenic features can be identified based solely on the land use/cover, which is a diagnostic criterion of the WRB. Therefore, the land use/cover categories can be classified into groups which indicate the differences between the strengths of various anthropogenic effects/influences. Thus, based on the land use/cover data, predictions can be made which characterize the extent of anthropogenic influences on soils.
The aims of our study are the following: 1) The development and implementation of the automation of a new indicator which can be applied to evaluate the anthropogenic influences on soils in a geoinformatics environment. 2) Using spatial databases developed from multiple time points, the characterization of spatial and temporal changes in the extent of anthropogenic influences on the soils of Tokaj Nagy-Hill. 3) The development of a freely available website containing the thematic maps.
2 Material and Methods
2.1 Description of Study Area
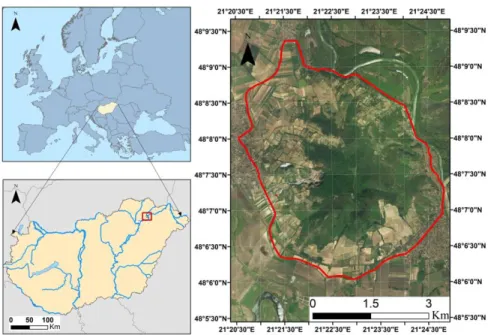
Tokaj Nagy-Hill is part of the Tokaj-Hegyalja region in Hungary (Fig. 1). This historic wine producing area is located in the foothills of the Zemplén Mountains [14]. Since the Neolithic, the anthropogenic influences on the different geo- and morphotops of the Hill have been present, but really remarkable geomorphologic changes caused by human activities began as late as the Early Modern Age (17th- 18th Centuries), when wineries and quarries came to play a dominant role in the
development of the landscape [15]. Mount Tokaj has a significant landscape potential due to the fact that it is located at the intersection of a plain and a mountain region [16]. The first major change in the evolution of the landscape occurred during the 20th Century; this was the time that the cultural landscape started to achieve its current form. The changes that took place in the 16th-18th Centuries altered the land use in a major way. From that point onward, the land use has been characterized by a structure corresponding to different altitude zones [17].
The construction of the flood prevention dikes was a significant step in the middle of the 19th Century, because since then the extension of the floods and the areas vulnerable to inland waters has decreased. The middle period of the 1880s was of great importance from the standpoint of the changes in the land use, because it was the time when the phylloxera epidemic hit the area [18], which contributed to the drastic decrease of the wine regions. During the following reconstruction period the vertical structure of the wine regions altered [19]. The land use became mosaic, therefore the zonality disappeared. From the perspective of land use, economic considerations and the ease of cultivation took priority. As a consequence of the above, the wine areas located at a higher altitude were abandoned and the degree of erosion decreased [20].
Figure 1 Location of study area
2.2 Methodology to Express Soil Naturalness Grades
In our study, we combined several national databases and a methodology for defining soil naturalness grades. One of these methods is land cover databases, which we created from various types of maps (I.-II.-III. Military Survey, Topographic Map of Hungary, Google Earth Satellite Image) from different time periods [21-26], providing information about land cover classes; and the other is the WRB (IUSS WG WRB, 2015) for evaluating soils’ taxonomical status [13].
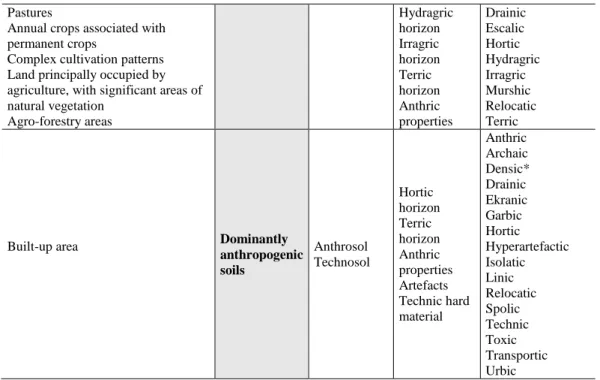
Combining the information content of both, we compiled an index which could be applied to estimate the rate of anthropogenic influences on soils. According to the combination of land cover data and WRB soil diagnostic principles, we defined four different groups of soil naturalness. We distinguished four grades of soil naturalness, and assigned all land cover classes to one (and only one) soil naturalness grade according to their typical anthropogenic processes, which are also reflected in their taxonomy and diagnostics, according to the WRB (Table 1).
Actually, we did not use the already existing actual taxonomic classification data of soils, which was surveyed in the field according to the WRB. We assigned the anthropogenic features of the WRB to the land cover classes in order to express the anthropogenic transformation of soil.
Table 1
Assigning the land cover classes to soil-naturalness grade classes according the applicable WRB diagnostic features
Land cover classes
Soil naturalness grades
Applicable diagnostic features according to WRB 2014, indicating anthropogenic influences
Reference groups
Diagnostic horizons, properties
and materials
Qualifiers
Mineral extraction sites No soils – – –
Broad-leaved forest Coniferous forest Mixed forest Natural grasslands Moors and heathland Sclerophyllous vegetation Transitional woodland-shrub Bare rocks
Sparsely vegetated areas Burnt areas
Dominantly natural or close to natural soils
– – –
Non-irrigated arable land Permanently irrigated land Vineyards
Fruit trees and berry plantations
Soils with significant anthropogenic influences
Anthrosol
Anthraquic horizon Hortic horizon
Anthraquic Anthric Aric Densic*
Pastures
Annual crops associated with permanent crops
Complex cultivation patterns Land principally occupied by agriculture, with significant areas of natural vegetation
Agro-forestry areas
Hydragric horizon Irragric horizon Terric horizon Anthric properties
Drainic Escalic Hortic Hydragric Irragric Murshic Relocatic Terric
Built-up area Dominantly
anthropogenic soils
Anthrosol Technosol
Hortic horizon Terric horizon Anthric properties Artefacts Technic hard material
Anthric Archaic Densic*
Drainic Ekranic Garbic Hortic Hyperartefactic Isolatic Linic Relocatic Spolic Technic Toxic Transportic Urbic
2.3 Workflow of Geoprocessing and Geovisualization
The implementation has three main steps, as shown in Fig. 2: preprocessing, geoprocessing, and sharing.
Figure 2 Process of the GIS workflow
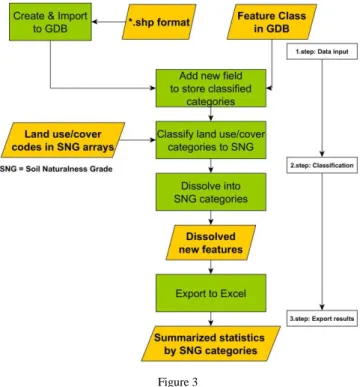
We collected maps for soil naturalness grade data and downloaded ASTER GDEM from the web to visualize the results in 3D. Subsequently, the next step was data processing using ArcMap 10.2 software. Visual interpretation was applied and land use/cover data was retrieved for each database. These land use/cover data were classified into soil naturalness grades by a script written in Python using ArcPy (Fig. 3). We used the QGIS Qgis2threejs plugin for visualizing in 3D. This plugin exports terrain data, map canvas images and vector data to the web browser. The final step was to publish the data online [27].
Since the classification step was done in ArcGIS, the ArcPy package was applied for Python programming. Fig. 3 describes the workflow of the script written for this specific application. For further possible improvement of the code, optional input file formats were defined as feature classes, and shapefiles; in the case of the latter, a file geodatabase was created for storing the output files. The land use/cover classes were classified into soil naturalness grade categories after creating a new field for storing them. Classification was made on the basis of previously created arrays containing land use/cover classes for each of the four soil naturalness grade classes (Table 1). Then, dissolving features enabled us to determine the total area for each soil naturalness grade category in the study area.
Finally, summarized statistics were converted to an Excel table for further evaluation.
Figure 3 Process of classification
3 Results
Based on the methodology developed, we performed the automated classification of the available databases recorded at various dates to determine the extent of anthropogenic influence on soils. Our results showed a significant degree of anthropogenic influence (Fig. 4). This can be explained primarily by the effects related to vine production, such as ploughing, terracing or truncation by erosion.
Predominantly anthropogenic soils, characteristically, can be found in built-in areas and in the lines of developed terraces.
Figure 4
Ratio (%) of soil naturalness grades in Tokaj Nagy-Hill, according to historical and contemporary land cover and soil databases
We also detected the most relevant changes between 1784 and 2010, which, based on the works of Incze and Novák (2016), can be explained by the different dynamics of abandonment of vineyards, new vine areas and unchanged vineyards.
Generally, throughout five investigative periods (1784-1858, 1858-1884, 1884- 1940, 1940-1989, 1989-2010) decreasing anthropogenic influence on soils could be diagnosed on 35.73% of the area and a decreasing intensity of human impact in 8.01%. We have also concluded that the dynamics of vineyard abandonment show significant temporal differences during the investigated period. While the ratio of soils with significant anthropogenic impact decreased by 15% between 1940 and 2010, during a period which was almost thirty years shorter the rate of decrease exceeded 22%. The increase in dominantly natural or close to natural soils can be explained partly due to the phylloxera epidemic which destroyed a significant
proportion of the vines (Reference). The ratio of predominantly anthropogenic soils increased from an initial rate of 3.74% to 9.03% which can be explained by the increase of built-in areas. In recent times on Tokaj Nagy-Hill 48.5% of the surface is covered by soils in a dominantly natural or close to natural state (2010).
On 9.0% of the surface anthropogenic reference groups can be found, and on 38.5% basically natural soils with recognizable anthropogenic influences, such as ploughing, terracing or truncation by erosion.
To demonstrate the spatial changes visually and to evaluate the processes involved, we have created thematic maps of the area for the 6 dates. In 1974 predominantly natural or close to natural soils could be found mainly on the hilltop and on the hillsides; soils with significant anthropogenic influence were the dominant soil types due to the vine production, while anthropogenic soils were predominantly found in the foothill areas. Having investigated the spatial changes, we concluded that the ratio of anthropogenic soils increased in the Tokaj-Nagy Hill foothill areas, while due to the abandonments the ratio of natural soils also increased, even in the hillside regions. Due to erosion the soils have been destroyed in more and more areas where the bedrock is exposed at the surface, a process which reached its peak in 1989 (4.08%).
Figure 5
Spatial patterns of changes in anthropogenic soil disturbance on Nagy-Hill (1784-2010)
We attached six databases to the study area, and made them freely accessible [28].
The base of the 3D interpretation was the ASTER GDEM raster digital surface model. The soil naturalness grade maps were projected onto this model, which can be rotated arbitrarily, as well. Information about the layers can be queried by clicking, and results showing the relevant data from the attribute table are visible to users in a window. The visibility of the layers can also be controlled by using the menu located in the right upper corner (Fig. 6).
Figure 6
Results of geovisualization (1784 and 2010)
3.1 Relationship to Cognitive Infocommunications
The complexity of the term Cognitive Infocommunications (CogInfoCom) intensively reflects to its multidisciplinary characteristics. According to its first and still the most relevant definition it “explores the link between the research areas of infocommunications and cognitive sciences, as well as the various engineering applications which have emerged as a synergic combination of these sciences” [29]. Since the birth of this special field it has already become known in many disciplines, which is proved by several scientific papers containing sections
for examination of the cognitive aspects of the results as well [30-40]. Due to the increased interest a comprehensive overview of cognitive infocommunications is already available in form of a book, which provides an outstanding theoretical foundation of the topic as well [41].
This paper demonstrated the process of data geovisualization during which data were transformed into a special form enhancing co-evolvement of cognitive processes with infocommunication devices. Human perception as a cognitive process can interact with certain artificial cognitive systems and the process itself can be supported also in the context of cognitive infocommunications.
Considering the current study, the following cognitive considerations related to field of CogInfoCom are of high importance:
Revealing relationships between a given soil type and its location became easier after the geovisualization.
Geovisualization facilitates capturing the spatial pattern of soil types and land use/cover distribution.
General cognitive perception of digital data is supported. The more data sources are used; the greater need can be identified for supporting the appropriate interpretation of the data.
Since an interactive webpage may be considered as a cognitive beings, the communication realized between our webpage containing geovisualized information and the user is of inter-cognitive communication.
Conclusion
In the field of geoinformatics, several free data sources are readily available at various websites. Although usage of these data is rather convenient way of data acquisition, we have to pay high attention to their accuracy and currency. Usually, it is not a trivial matter to merge different data into one system (just think of the different reference systems).
In the case of the ASTER GDEM, used as a base map, the resolution is of highest importance. The resolution of our surface model is 30 m, that is why ASTER GDEM is appropriate to provide basic information about the study area.
Reclassified databases were used to express the soil naturalness grades of Tokaj Nagy-Hill. The weakness of this classification method is the suitability of the archive maps, because the projected and the stored information, in most cases, is insufficient. For a credible and correct representation of the distribution of the analyzed reference soil groups, we need to classify them according to the modern European diagnostic system, the World Reference Base for Soil Resources (WRB). Our study provided a method showing how the QGIS Qgis2threejs module can be applied to publish geospatial information on internet.
Acknowledgement
The research was financed by the Higher Education Institutional Excellence Programme of the Ministry of Human Capacities in Hungary, within the framework of the 4. thematic programme of the University of Debrecen.
References
[1] D. Balla, T. Mester, Á. Botos, T. J. Novák, M. Zichar, J. Rásó, A. Karika:
Possibilities of spatial data visualization with web technologies for cognitive interpretation. In: P. Baranyi, (ed.) CogInfoCom 2017:
Proceedings of 8th IEEE Conference on Cognitive Infocommunications, Debrecen: IEEE Hungary Section, 2017, pp. 17-20
[2] D. Balla, M. Zichar, N. Barkóczi, O. Gy. Varga: Cognitive interpretation of different spatial databases in web environment. In: P. Baranyi, (ed.) CogInfoCom 2015: Proceedings of 6th IEEE Conference on Cognitive Infocommunications, Győr: IEEE Hungary Section, 2015, pp. 159-162 [3] T. Hernandez: Enhancing retail location decision support: The development
and application of geovisualization, Journal of Retailing and Consumer Services 14, 2007, pp. 249-258
[4] O. Chertov, A. Komarov, A. Mikhailov, G. Andrienko, N. Andrienko, P.
Gatalsky: Geovosualization of forest simulation modelling results: A case study of carbon sequestration and biodiversity, Computers and Electronics in Agriculture 49, 2005, pp. 175-191
[5] A. Kovarova, M. Konopka, L. Sekerak, P. Navrat: Visualising Software Developers' Activity Logs to Facilitate Explorative Analysis, Acta Polytechnica Hungarica 13(2), 2016, pp. 159-178
[6] A. M. MacEachren, M. J. Kraak: Research Challenges in Geovisualization, Cartography and Geographic Information Science 28(1), 2001, pp. 3-12 [7] A. Pődör, M. Kiszely: Experimental investigation of visualization methods
of earthquake catalogue maps, Geodesy and Cartography 40 (4), 2014, pp.
156-162
[8] A. Neumann: Web Mapping and Web Cartography, Encyclopedia of GIS, New York, NY: Springer, 2008, pp. 1261-1270
[9] M. Zichar: Geovisualization based upon KML, Agricultural Informatics 3 (1), 2012, pp. 19-26
[10] R. E, Roth, A. Robinson, M. Stryker, A. M. MacEachren, E. J. Lengerich, E. Koua: Web-based geovisualization and geocollaboration: Applications to public health, In Proc. Joint Statistical Meeting, Invited Session on Web Mapping (Denver, CO, 2008) ASA
[11] P. Szilassi, T. Bata, Zs. Molnár: A táj antropogén átalakítottságának térképezése országos léptékben Magyarország példáján. VI. Magyar Tájökológiai Konferencia, 2015, Absztraktkötet
[12] P. Szilassi, Gy. Jordán, A. Rompaey, G. Csillag: Impacts of historical land use changes on erosion and agricultural soil properties in the Kali Basin at Lake Balaton, Hungary, 2006, Catena 68, pp. 96-108
[13] IUSS Working Group WRB, (2015) World Reference Base for Soil Resources 2015, World Soil Resources Reports, No. 106. FAO, Rome, 192.
pp.
[14] J. Incze and T. J. Novák: Identification of extent, topographic characteristics and land abandonment process of vineyard terraces in the Tokaj-Hegyalja wine region between 1784 and 2010, Journal of Maps, Taylor & Francis, 2016, pp. 507-513
[15] P. Rózsa and T. J. Novák: Anthropogeomorphological Landscape Transformation of the Tokaj Nagy-Hill – a case study for quantifying the process, In: Hradecký, J. – Šilhán, K. (eds.) (2011): Carpatho-Balkan- Dinaric Conference on Geomorphology, Book of Abstracts, ISBN 978-80- 7368-444-0, Ostravice (Czech Republic), 2011, pp. 51-52
[16] P. Csorba: Comparison of the geomorphological and landscape ecological structure of Tokaj-Hegyalja. Acta Geographica Debrecina különszám, Proceedings of Carpatho-Balcan Geomorphological Conference, 1995, pp.
7-14
[17] R. Nyizsalovszkim: Morfológia és területhasználat kapcsolata Tokaj- Hegyalján. In: Csorba P. (szerk.): Egy szakmai életút eredményei és színhelyei. Tiszteletkötet Martonné Dr. Erdős Katalin 60. születésnapjára.
Debrecen, 2006, pp. 89-105
[18] I. Balassa: A filoxéra Tokaj-Hegyalján. In: Szabadfalvi J. (ed.) (1975):
Herman Ottó Múzeum Évkönyve XIII–XIV. Miskolc, 1975, pp. 305-335 [19] P. Feyé: Szőlő- és borgazdaságunk történetének alapjai, Akadémiai Kiadó,
1970, pp. 407
[20] R. Nyizsalovszki, T. Fórián: Az emberi tevékenység hatása a tájra Tokaj- hegyalján, különös tekintettel a világörökségi területekre [In: Nagy János, Dobos Attila (szerk.) Környezetkímélő növénytermesztés- minőségi termelés, DE ATC Területfejlesztési Kutatócsoport, Debrecen, 2006, pp.
104-116
[21] I. Military Survey, digital edition. Kingdom of Hungary. 1:28.800, georeferenced edition. Arcanum Adatbázis Kft. Budapest, ISBN: 963 9374 95 4
[22] II. Military Survey, digital edition. Kingdom of Hungary. 1:28.800, georeferenced edition. Arcanum Adatbázis Kft. Budapest, ISBN: 963 7374 21 3
[23] III. Military Survey, digital edition 1869-1887, Kingdom of Hungary.
1:25.000, georeferenced edition. Arcanum Adatbázis Kft. Budapest, ISBN:
978-963-7374-54-8
[24] Topographic maps from the time of II World War. (1940–1944). HM – Hadtörténeti Intézet és Múzeum Térképtár. In G. Tímár, G. Molnár, B.
Székely, S. Biszak, & A. Jankó (Eds.), Magyarország Topográfiai Térképei a Második Világháború időszakából. Arcanum Adatbázis Kft., HM-HIM, HM-GEOSZ, Budapest, ISBN: 978-981 963-7374-71-5
[25] 1:10 000 Scale Topography Maps of Hungary in EOTR projection. (1985–
1989) Kartográfiai Vállalat, Budapest
[26] Google Maps. (2010) Of Openlayer plugin in QGIS
[27] QGIS Qgis2threejs plugin’s documentation:
http://qgis2threejs.readthedocs.io/en/docs-release/, 2016 [28] http://siscs.exitdebrecen.hu/tokaj/tokaj_antropo.html
[29] P. Baranyi, Á. Csapó: Definition and synergies of cognitive infocommunications, 2012. Acta Polytechnica Hungarica, 9(1), pp. 67-83 [30] I. Papp, R. Tornai, M. Zichar: What 3D technologies can bring into the
education: The impacts of acquiring a 3D printer, in Proceedings of 7th IEEE Conference on Cognitive Infocommunications, Wroclaw, 2016. pp.
257-261
[31] A. Fazekas, K. Bertók: Face Recognition on Mobile Platforms, in Proceedings of 7th IEEE Conference on Cognitive Infocommunications, Wroclaw, 2016, pp. 37-42
[32] Sz. Szeghalmy, M. Zichar, A. Fazekas, Gesture-based computer mouse using Kinect sensor, in Proceedings of 5th IEEE Conference on Cognitive Infocommunications, Vietri sul Mare, 2014, pp. 419-424
[33] G. Sallai: Defining Infocommunications and Related Terms, Acta Polytechnica Hungarica, 9(6), pp. 5-15, 2012
[34] G. Sallai: The Cradle of Cognitive Infocommunications, Acta Polytechnica Hungarica, Vol. 9, No. 1, pp. 171-181, 2012
[35] F. R. Izullah, M. Koivisto, A. Aho, T. Laine, H. Hämäläinen, P. Qvist, A.
Peltola, P. Pitkäkangas, M. Luimula: NeuroCar Virtual Driving Environment - Simultaneous Evaluation of Driving Skills and Spatial Perceptual-attentional Capacity, 7th IEEE International Conference on Cognitive Infocommunications (CogInfoCom) Wroclaw 2016
[36] H. Kaartinen, S.i Pieskä, J. Vähäsoyrink: Digital Manufacturing Toolbox for Supporting the Manufacturing SME, 7th IEEE International Conference on Cognitive Infocommunications (CogInfoCom), Wroclaw 2016
[37] Á.Török, Zs. Gy.Török, B.Tölgyesi: Cluttered centres: interaction between eccentricity and clutter in attracting visual attention of readers of a 16th Century map, 8th IEEE International Conference on Cognitive Infocommunications, Debrecen, 2017
[38] D. Sik, K. Csorba, P. Ekler: Implementation of a Geographic Information System with Big Data Environment on Common Data Model, 8th IEEE International Conference on Cognitive Infocommunications, Debrecen, 2017
[39] GY. Bujdosó, O. C. Novac, T. Szimkovics: Developing cognitive processes for improving inventive thinking in system development using a collaborative virtual reality system, 8th IEEE International Conference on Cognitive Infocommunications, Debrecen, 2017
[40] R. Idzikowski, K. Kluwak, T. Nowobilski, T. Zamojski: Analysis of possibility of visualization of danger factors in the building environment, 8th IEEE International Conference on Cognitive Infocommunications, Debrecen, 2017
[41] P. Baranyi, Á. Csapó, Gy. Sallai, Cognitive Infocommunications (CogInfoCom), Springer, 2015