Cite this: Phys. Chem. Chem. Phys., 2021, 23, 15515
Enhancing the yield of calcium carbonate precipitation by obstacles in laminar flow in a confined geometry†
Katalin Vikto´ria Bere,aEmilie Nez,bEdina Balog,aLa´szlo´ Janova´k,aDa´niel Sebok,+ c A´kos Kukovecz, cCle´ment Roux, bVeronique Pimienta b and
Ga´bor Schuszter *a
Flow-driven precipitation experiments are performed in model porous media shaped within the confinement of a Hele-Shaw cell. Precipitation pattern formation and the yield of the reaction are investigated when borosilicate glass beads of different sizes are used in a mono-layer arrangement. The trend of the amount of precipitate produced in various porous media is estimatedviavisual observation.
In addition, a new method is elaborated to complement such image analysis based results by titration experiments performed on gel-embedded precipitate patterns. The yield of confined porous systems is compared to experiments carried out in unsegmented reactors. It is found that the obstacles increase the amount of product and preserve its radial spatial distribution. The precipitate pattern is successfully conserved in a slightly cross-linked hydrogel matrix and its microstructure is examined using SEM. The spatial distribution of the precipitate across the cell gap is revealed using X-ray microtomography.
1 Introduction
Precipitation reactions coupled with transport processes and taking place in porous media have been studied from various perspectives. To mitigate the atmospheric CO2 concentration, one proposed solution is its underground sequestration in depleted oil reservoirs and saline aquifers.1,2 Although some pilot experiments have already provided favourable outcomes,3 the sequestration may have serious drawbacks, such as wormhole formation4and potential leakage,5and therefore laboratory scale experiments are also needed.6,7 Model precipitation reactions conducted in real opaque well-bore samples can be investigated by applying different tomographic methods. To achieve reliable image quality, Ba(II) solution is frequently used as a contrast agent instead of Ca(II).8 However, the pattern formation of BaCO3 and CaCO3 can lead to a significantly different spatial distribution of the precipitate.9 Another disadvantage of the tomographic methods is their low time resolution which does not enable real time tracking of dynamic processes. To over- come this difficulty, flow-driven precipitation taking place in a
model porous medium might be studied to some extent in transparent Hele-Shaw cells.10Indeed, a recent study investigates the fluid flow and precipitate accumulation in a Hele-Shaw type reactor which facilitates the occupation of zones at different elevations.11Estimating the amount of the product,i.e., the yield of the reaction is in the focus of sequestration studies because it highlights the success of the process and delivers information about the porosity and permeability change of the medium. In thin Hele-Shaw cells (B0.5 mm gap height), the gray scale (I) of the time-elapsed images can provide information about the amount of product obtained under different experimental conditions either in homogeneous solutions12or applying preci- pitation reactions.13Although an appropriate gray scale – product concentration calibration curve can facilitate such a method, this procedure may not be valid if, e.g., the precipitate forms thick layers and thus the particles lying above cover the ones below. In our study applying moderate reactant concentrations and mono layered model porous media, the overlapping of the precipitates cannot be avoided. It is therefore desired to elaborate a reliable procedure to determine the amount of precipitate produced in Hele-Shaw type reactors where the product is hardly accessible within the confinement. As a possibility, we propose to conserve the flow-driven precipitate pattern in a hydrogel matrix and determine the amount of product by titration.
Besides the sequestration studies, precipitation reactions coupled with various transport processes are the subject of material science investigation as products which are not available in
aDepartment of Physical Chemistry and Materials Science, University of Szeged, Rerrich Be´la te´r 1, Szeged, H-6720, Hungary. E-mail: schuszti@chem.u-szeged.hu
bLaboratoire des IMRCP, Universite´ de Toulouse, CNRS UMR 5623, Universite´
Toulouse III – Paul Sabatier, France
cInterdisciplinary Excellence Center, Department of Applied and Environmental Chemistry, University of Szeged, Hungary
†Electronic supplementary information (ESI) available. See DOI: 10.1039/d1cp01334c Received 26th March 2021,
Accepted 23rd June 2021 DOI: 10.1039/d1cp01334c
rsc.li/pccp
PCCP
PAPER
traditional well-stirred systems can be obtained.14–17If the most important mass transport is provided by flow, buoyancy con- tribution cannot be neglected when searching for the driving force lying behind the special products, such as the thermo- dynamically unstable polymorph of a given compound.15 To decouple buoyant forces, experiments are often carried out under microgravity conditions using parabolic flights or sounding rocket missions.18,19However,in operandoconducting materials science investigation is usually not feasible because of the short time window and the lack of special equipment and scientifically trained users. Therefore, the precipitate produced under micro- gravity must be conserved for later characterization on Earth.
Similarly to the determination of the amount of precipitate by titration, we propose to conserve the product in a gel matrix to restore the spatial distribution for a longer time scale.
In this context, we performed flow-driven precipitation experiments in a Hele-Shaw type confined geometry. Model porous media were built within the confinement to investigate precipitation pattern formation and the yield of the reaction for various obstacle sizes. A new method is elaborated to conserve the pattern in a hydrogel matrix which facilitates both the micro scale analysis of the spatial distribution and the titration that supports the justification of the gray scale based trends.
2 Experimental
2.1 Injection experiments
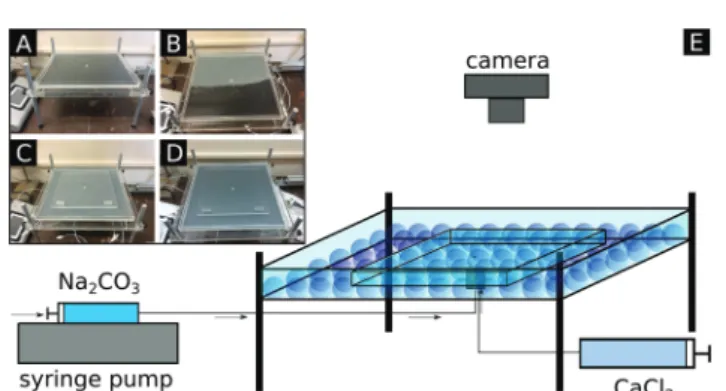
Flow-driven precipitation experiments were performed by radially injecting sodium carbonate aqueous solution (1 M) from below into a calcium chloride solution layer (1 M) formed within the confinement of a Hele-Shaw cell (see Fig. 1). Throughout the experiments, reactant concentrations, flow rate (Q= 1 mL min1, provided by a syringe pump), and total injected volume (Vtot= 8 mL) were kept constant while the height of the gap (h) between the two plates of the HS cell was systematically varied.
The experiments are divided into two types. One part of the experiments was performed with a gap filled with borosilicate glass beads (close packed mono-layer arrangement, referred to as a heterogeneous system further on). Although the bead size
(diameter,d: 2, 3, 4, and 5 mm) was varied from one experiment to the next, only one type of bead was used at a time. To reveal the effect of bead size on the pattern formation and on the amount of precipitate, experimental images were recorded (1024768 spatial resolution, 19.414.6 cm field of view) from above. Both the background corrected gray scale (I) corresponding to the end of injection and the spatial extension of the patterns were investigated as a function of bead size. As a reference case, the same experiments were performed without beads (referred to as a homogeneous system),i.e., a gap was formed with height equal to the bead size but the gap space was free of beads. Each experiment was reproduced at least three times to obtain reliable data. To avoid premature precipitation in the injection system and to facilitate bubble-free filling of the reactor, a special 4-way valve was designed and constructed (see the ESI†for its scheme).
To quantify the visual observations, Feret’s diameter (dF), the area of the pattern (A), and gray scale of the images (I) were investigated as a function of gap height (h). Feret’s diameter (i.e., caliper diameter) is traditionally used to determine object size and it measures the distance between the two parallel planes restricting the object perpendicular to those planes.
Since some precipitate patterns are circular while others exhibit preferred growth directions, Feret’s diameter as a measure of the characteristic linear extension was calculated by taking the square root of the product of minimum and maximum Feret’s diameters determined by image analysis (ImageJ). The amount of product yielded under certain circumstances is also investigated by measuring the total gray scale of the experimental images,i.e., the sum of the gray scale of the pixels. Although such a method is proved to be efficient for precipitation patterns composed of separate particles arranged in a mono layer,13it may not provide valid information in the present case, since the precipitate forms superimposed layers. Nevertheless, the method is expected to reveal trends among the experiments performed with varyingh.
The sensitivity of the digital camera (8 bit depth) is adjusted in such a way that the gray scale increase caused by precipitate layering cannot lead to the saturation of the recorded images. For simplicity,Iis calculated by multiplying the total gray scale of the image by 107.
To characterize the flow conditions, Reynold’s number can be calculated for packed beds asRe¼rul
m , whereris the density (1098 kg m3) andmis the dynamic viscosity (0.89 mPa s) of the injected liquid.uis the linear flow rate (also called as superficial velocity) which has a maximum value of 0.02 m s1 in our system at the injection port. Since the injected liquid spreads radially and the smallest applied gap height is already the double of the injection nozzle diameter, the flow rate rapidly drops with the increasing radius. Finally,lis the characteristic length scale of the system, which is equal to the bead diameter for packed beds. In our mono layer system, this is directly the height of the gap,i.e.,l= 2–5103m. The Reynolds number thus falls in the order of 100 which indeed implies laminar flow conditions. Notice also that, the flow rate decays with the distance taken from the inlet because of the radial injection and constant pumping speed.
Fig. 1 Images of the empty (A), partially loaded with beads (B), fully loaded with beads (C), and beads and calcium chloride solution loaded (D) experimental setup and its schematics (E). Dimensions of the HS cell:
3535 cm2.
2.2 Determination of precipitate spatial distribution
To investigate the 3D spatial distribution of the precipitate within the pattern at the end of the injection experiment, X-ray microtomography (mCT, Bruker Skyscan 2211, wolfram (tungsten) anode, 400mA current at 90 kV accelerating voltage, microfocusing mode, 1801 total rotation with 0.11 resolution, 45 ms exposition time, 2084 projections with averaging on 10 images, 27 mm spatial resolution) was applied. Since the pattern formation presented here needs a horizontal HS cell during injection and that the reactor must be placed into the mCT instrument in a vertical position to achieve good resolution, the precipitate patterns must be conserved within the confinement to avoid any damage. Therefore, experiments were also performed in a scaled down (from 35 35 cm2to 1717 cm2) version of the reactor seen in Fig. 1. The pattern was conserved in a hydrogel matrix whose polymerization was photoinduced. For such experiments, the setup was made of glass to minimize the light absorbance at the relevant wave- length (l= 365 nm). The ingredients for polymerization were incorporated in the injected Na2CO3 solution. After sufficient irradiation, the reactor could be positioned vertically without any sign of displacement of the precipitate pattern, and thus it was appropriate formCT investigation (an example is presented in the ESI†). We verified that the addition of the small molecule polymer ingredients into the injected solution does not modify significantly either the macroscopic pattern formation (com- pare Fig. 3b – 5 mm and Fig. S2, ESI†) or the microstructure of the precipitate (see the SEM images of Fig. S3, ESI†). Indeed, rhombohedral, most probably calcite polymorphs of CaCO3are found in the well-stirred reference system and also under flow conditions independently of the presence of beads. However, after the polymerization, the evolved gel structure was flexible enough to fix the formed pattern. To prepare 10 mL of such a solution, we have used 18.4 mg cross-linker (N,N0-methylenebis- (acrylamide)), 1.25 mL monomer solution (N,N-dimethylacrylamide 99.9%), and 80 mg Irgacure2959 photo initiator. The solution was purged with N2before use in order to remove the dissolved oxygen prior to the start of the free-radical polymerization. Two lamps (365 nm, 15 W and 6 W) were placed respectively above and below the reactor in order to make sure that all the precipitate was fixed. The irradiation time was 6 min for a gap height of 3 mm and 8 min for 5 mm.
2.3 Titration experiments
To determine the amount of precipitate produced upon injection into the various systems (i.e., homo and heterogeneous with different gap heights), besides the image analysis based method, titration was applied to the gel-embedded pattern samples.
During injection, the invading solution (Na2CO3) both mixes with and displaces the solution originally filling the gap (CaCl2).
Therefore, at the end of injection followed by polymerization, the CaCl2 solution which remained unreacted around the pattern was emptied from the gap thanks to drainage holes in the bottom plate. Water was then introduced through the same holes in order to rinse profusely the surrounding of the gel and get rid of
all remaining CaCl2. At that point, the reactor is opened and the gel-embedded CaCO3 precipitate pattern recovered and further rinsed. 20 mL HCl solution with 2 M concentration was added to the gel and left overnight to ensure the dissolution of all Ca(II) in solution. The sample was then filtered and profusely rinsed before neutralization by NaOH and transferred into a 50 mL flask. 5 mL of ammonia buffer solution (pH = 10) was added to 10 mL of Ca(II) solution before titration by EDTA (0.0196 M) in the presence of Eriochrome Black T as the indicator. For each injection experiment, titration was performed three times showing a maximum dispersion of 5% and all injection experiments were also performed three times giving rise to the resulting dispersion reflected in the given error. The above described analysis was only applied to the gel-embedded pattern samples for the 3 mm and 5 mm gaps. Unfortunately, the titration procedure did not show reproducible results for a lower gap space due to the difficulty of handling too thin a gel during the rinsing and recovering processes.
3 Results and discussion
A white CaCO3 precipitate pattern is formed when a sodium carbonate solution is radially injected into a calcium chloride solution confined between the two plates of the HS cell. The shape and spatial extension of the pattern depend on the type of the confinement,i.e., whether it is homogeneous or segmen- ted by obstacles which force the radially invading liquid to split into smaller regions.
3.1 Characteristics of the porous medium
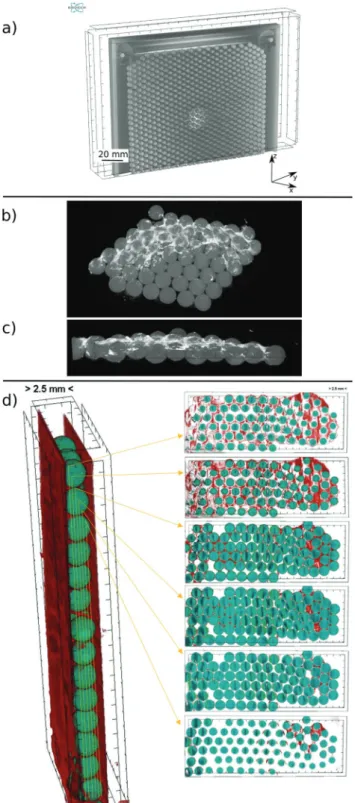
During mCT measurements, the 3D structure of the opaque samples can be reconstructed on the basis of different X-ray absorption of the ingredients. We applied such method to determine the porosity of the bead bed. Relying on the porosity, the permeability of the HS-cell filled with monolayer bead bed can be obtained from flow-through experiments coupled with pressure measurements applying the Carman–Kozeny model.20 The pressure drop along the HS-cell during such flow-through experiments was measured in our previous study.21Beside the porosity determination, the spatial distribution of the precipitate particles building up the patterns was investigated withmCT. One example case for the HS cell loaded withd = 5 mm beads is presented in Fig. 2a. After determining the free and bead occupied volumes of the reactor, the porosity,e, is found to be 0.43 in good agreement with the literature which hence results in permeability,k= 14.80.5109m2.21Therefore, relying on both themCT measurements and the literature data,eandkfor Hele-Shaw cell loaded with 2–5 mm beads fall into the range of 0.51–0.43 and 2–15109m2, respectively.
3.2 Macroscopic patterns
A representative selection of the experimentally observed flow-driven precipitation patterns are presented in Fig. 3 for comparison.
In the reference case when no bead is placed in the gap, a circular pattern with more or less uniform precipitate distribution
is grown at the lowest gap height (Fig. 3a,h= 1 mm). An increasing gap height, however, gives rise to a more complex pattern formation where several fingers evolve and the radial symmetry becomes distorted. Such a pattern formation is led by the local convection induced when the heavier carbonate solution (r= 1.0973 g cm3) is vertically pumped into the less dense and horizontally confined calcium chloride solution layer (r= 1.0862 g cm3). During radial spreading, the convective currents are more enhanced in the vicinity of the injection port. Also, no obstacles are present to counteract the localized convection rolls. This mixing yields a considerable amount of precipitate which sediments to the lower plate of the HS cell. The interaction between the localized mixing and the sedimentation of the precipitate particles leads to symmetry breaking and finger-like pattern grows with non-uniform precipitate distribution; high (brighter) and low (darker) populated regions are also present.
Fig. 2 Part (a): 3D-renderedmCT reconstruction of the HS cell loaded withd= 5 mm beads. Part (b and c): 3D-rendered overview and cross- section, respectively, of a portion of the gel-embedded CaCO3precipitate particles covering the surface of d = 2 mm beads. Part (d): Spatial distribution of CaCO3across the cell gap obtained by reconstructing the results ofmCT measurements. The reactor is positioned vertically during the measurement and the left side of the bead layer confined between the planes of the HS cell corresponds to the top of the gap. On the right side, slices below each other show how the amount of precipitate (red) decreases from the top to the bottom and how it is distributed around the beads (green).
Fig. 3 Precipitate patterns obtained at the end of injection without (a) and with (b) the use of beads; gap heights inscribed. Field of view:
19.414.6 cm2.
The larger the gap height, the more pronounced the symmetry breaking (Fig. 3a) which also explains how a relatively symmetric pattern could be obtained at 1 mm gap height. It is important to note that the experimental conditions (i.e., reactant concentrations, flow rate, and gap height) maintained here are not appropriate for leading to finger-like precipitate pattern formation via the membrane growth mechanism.22,23In the present experiments, the patterns are composed of separated particles which may form superimposed layers upon sedimentation but do not form a cohesive structure within the confinement.
AlthoughVtot= 8 mL in each case, a larger gap height together with the vertical injection system creates a higher propagating plume of the injected solution compared to a thin gap where the liquid is rather pushed forward within the confinement. Therefore, due to the conservation of volume under the given experimental conditions, mixing of the reactants takes place within a shorter distance around the injection port leading to more frequent precipitate layer formation. As a consequence, fingers become shorter as reflected by the Feret’s diameter which linearly decreases with increasing h (black bullets line in Fig. 4a). In conjunction withdF, the area of the pattern,A also decreases with increasingh (red bullet line in Fig. 4a). The amount of
precipitate estimated on the basis of gray scale measurements significantly drops whenhbecomes large (bullets in Fig. 4b). A power law ofy=axbis fitted through theA–handI–hdata sets (dashed and solid lines in Fig. 4); the fitted parameters are shown in Table 1. The similarity of the exponents ofA–handI–h curves (0.49 and0.46, respectively) highlights that the larger the area covered by the injected solution, the higher the yield of the reaction. Indeed, the smallest gap height seems to be the most efficient for converting the reactants into product. This means that, even though an increasinghresults in an expanded convection roll within the gap, it leads to a less effective mixing within the time window of injection.
Applying beads within the confinement keeps the evolving pattern circular independently of the gap height (Fig. 3b). Also, the spatial distribution of the precipitate is less irregular within the pattern perimeter; the amount decreases along the radius.
As the diameter of the beads,i.e., the gap height increases, the Feret’s diameter linearly decreases (black squares in Fig. 4a).
The area of the pattern,Aalso decreases with an increasinghin conjunction with the linear extension of the pattern (red squares in Fig. 4a). Fitted parameters are shown in Table 1.
Although the area of the patterns obtained with or without using beads cannot be directly compared, since in the latter case hydrodynamic instabilities strongly alter the spreading and layering is preferred,Aclearly shows that the same volume of the injected liquid produces precipitate to a larger average extent in the heterogeneous case (Fig. 4a). This is caused by applying beads as obstacles within the confinement. Just like in the reference experiments performed without beads, the heavier liquid is vertically injected from a point source into the less dense one occupying the horizontal gap. Rayleigh–Taylor instability would lead again to the formation of convection rolls upon advancing towards stable density stratification. This is still true if the gap of the HS-cell contains zones at different elevations.
Since the gap height is constant, the heavier solution tends to accumulate in the valleys but the mixing of the solutions is not significantly enhanced.11The beads, however, initiate the split- ting of the flow into smaller segments. Also, the change of the gap cross-section leads to flow velocity variation. The mixing is efficient in the small localized regions between the beads24thus a high conversion of the reactants into product is reached as shown by the dashed line in Fig. 4b, where the measured gray scale only slightly ascends with the gap height (see the slope and its error in Table 1). Indeed, the improved conversion is further supported by the fact that the amount of precipitate is quasi constant while the Fig. 4 Feret’s diameter,dF, and the area of the pattern,A(a), and back-
ground corrected gray scale,I(b), as the function of gap height,hfor experiments performed without (bullets) and with beads (squares). The color of the presented data set indicates the correspondingY-axis. Solid and dashed lines correspond to power low and linear fitting; the fitted parameters are provided in Table 1. Error bars represent the standard deviation of the parameters.
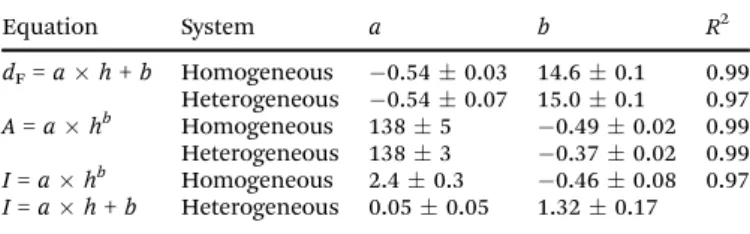
Table 1 Parameters (aandb) of the fitted curves, wheredF,h,A, andIare Feret’s diameter (cm), gap height (mm), pattern area (cm2), and gray scale (a.u.), respectively. Regression coefficient (R2) is also presented
Equation System a b R2
dF=ah+b Homogeneous 0.540.03 14.60.1 0.99 Heterogeneous 0.540.07 15.00.1 0.97 A=ahb Homogeneous 1385 0.490.02 0.99 Heterogeneous 1383 0.370.02 0.99 I=ahb Homogeneous 2.40.3 0.460.08 0.97 I=ah+b Heterogeneous 0.050.05 1.320.17
extension of the pattern clearly decreases with an increasing gap height. Although a significant amount of precipitate is formed, a part of it covers the surface of the beads (Fig. 2b and c), the interaction between the radially invading liquid and sedimentation is weaker than for the homogeneous case, and hence no fingers appear. The spatial distribution of the precipitate around the beads was further investigated bymCT measurements (see Fig. 2d for the precipitate spatial distribution at the different slices of the gap space). It is found that the precipitate covers the upper hemisphere rather than the lower one. This is a consequence of sedimentation and may indicate that the beads did not contribute as new nucleation sites. Therefore, any enhancement in the yield can be attributed to the increased mixing efficiency rather than to modified crystallization. The gray scale weakly depending on the bead size may also forecast that, since efficient mixing is already achieved at a relatively weakly porous system (porosity, e = 0.43–0.51 and permeability,k = 2–15 109 m2), mixing will be efficient in real porous media when supercritical CO2is injected underground for sequestration.3To further study the mixing enhancement in the vicinity of obstacles, one may apply objects with different shapes or surface roughness.
It is also worth noting that a significant amount of precipitate is produced in HS cells withh= 1 or 2 mm even if no beads are used. Gray scales of the homo and heterogeneous systems over- lap within experimental error at h = 2 mm. Due to technical difficulties,h = 1 mm gap was not investigated in a heteroge- neous fashion because the beads clogged the injection port.
Therefore, although Fig. 4b may suggest an inversion point in the conversion efficiency of the homo- and heterogeneous sys- tems at 2 mm gap height, our experimental results cannot prove it without doubts, since the error bars overlap. Also, the dashed line drawn only from 2 to 5 mm gap height highlights that our results do not facilitate the comparison belowh= 2 mm. How- ever, one may speculate that, in a radial system with a sufficiently high injection rate and density difference between the mixing liquids, the convection roll spanning the entire gap height at the contact zone is maintained for long distance thus efficient mixing is provided over a large area. This result may support other experiments where a traditional Hele-Shaw cell,i.e., two parallel sheets separated by a thin spacer, was used to mimic a porous medium.25
3.3 Titration experiments
As explained above, image analysis based estimates show that the amount of precipitate drops significantly with the increasing gap height in the homogeneous system. On the other hand, a larger amount of precipitate is obtained in the heterogeneous system and its amount barely depends on the bead size. To verify the results of the visual observations, the amount of precipitate was determined via titration experiments as well.
The mass of CaCO3derived from titration results is 0.110.02 g and 0.050.01 g in the homogeneous system with 3 and 5 mm beads, respectively, which coincides with the decreasing gray scale based conclusions of Fig. 4b. Furthermore, 0.220.03 g and 0.210.03 g CaCO3is found in the heterogeneous system composed of 3 and 5 mm beads, respectively, which again
agrees well with the quasi constant gray scale results of Fig. 4b.
One may roughly estimate the efficiency of the injection experi- ments compared to a well-stirred system by comparing the actually yielded and the theoretical maximum (mmax,CaCO3) of the product.
Considering the reactant concentrations and the injected volume, mmax,CaCO3 E 0.8 g. It is therefore found under laminar flow conditions that the yield is higher in the heterogeneous system than in the homogeneous one because the presence of beads gives rise to a more efficient mixing of the reactants; however, it is only B25% ofmmax,CaCO3. Although this result may seem to be dis- advantageous for the flow systems, we highlight that the reactions were performed in a relatively thin confined geometry where one reactant displaces the other. An increasinghand the application of multi-layered bead bed would increase the yield. A sufficiently high injection rate could decrease the laminar fashion of the flow which also increases the yield. Nevertheless, laborious titration experi- ments performed on hydrogel-embedded precipitate patterns prove that trends for the amount of precipitate distributed in overlapping layers can be discoveredvia simple image analysis even if the pattern is not composed of separated and well- distributed particles.13 However, obtaining analytical matching and the exact relationship between the measured gray scale and the produced precipitate require calibration curves based on numerous experiments.
4 Conclusion
Flow-driven precipitation experiments are performed in a Hele-Shaw cell applying radial injection. The spatial distribu- tion of the precipitate is investigated by X-ray tomography for which anin situgelation protocol is elaborated to conserve the patterns and facilitatea posteriorisample characterization.
Placing no bead into the cell gap leads to the formation of finger-like precipitate patterns as the gap height is increasing because of the enhanced coupling of buoyancy-driven convec- tion of the liquids and the sedimentation of the precipitate. The amount of precipitate is estimated by visual observation and titration experiments as well, and it is found to drop with the increasing gap height. If a monolayer of close-packed beads is introduced into the cell gap, the mixing of the liquids is improved leading to a significantly larger amount of precipitate compared to the homogeneous system with the same gap height. This yield enhancement is clearly tracked if the gap height is relatively large (i.e., 3 mm and above). Thinner HS cells require further investigation. Applying different bead sizes,i.e., different porosity and permeability did not provide significantly different amounts of precipitates. This might be caused by the mono-layer bead arrangement which did not facilitate the spanning of those parameters in a wider range.
The patterns obtained with beads show radial symmetry in each case.
Conflicts of interest
There are no conflicts to declare.
Acknowledgements
This work was supported by the National Research, Develop- ment and Innovation Office (K119795 and PD121010), and by the Centre Nationale de Recherche Spatiale (APR 5890).
References
1 Z. Dai, R. Middleton, H. Viswanathan, J. Fessenden-Rahn, J. Bauman, R. Pawar, S.-Y. Lee and B. McPherson, An integrated framework for optimizing CO2 sequestration and enhanced oil recovery, Environ. Sci. Technol. Lett., 2014,1, 49–54.
2 IPCC Special Report on Carbon Dioxide Capture and Storage, ed. B. Metz, O. Davidson, H. C. de Conninck, M. Loos and L. A. Meyer, Cambridge University Press, New-York, 2005.
3 J. M. Matter, M. Stute, S. O´. Snæ bjo¨rnsdottir, E. H. Oelkers, S. R. Gislason, E. S. Aradottir, B. Sigfusson, I. Gunnarsson, H. Sigurdardottir, E. Gunnlaugsson, G. Axelsson, H. A.
Alfredsson, D. Wolff-Boenisch, K. Mesfin, D. F. de la Reguera Taya, J. Hall, K. Dideriksen and W. S. Broecker, Rapid carbon mineralization for permanent disposal of anthropogenic carbon dioxide emissions,Science, 2016,352(6291), 1312–1314.
4 P. Szymczak and A. J. C. Ladd, Reactive-infiltration instabilities in rocks. Part II: Dissolution of a porous matrix,J. Fluid Mech., 2014,738, 591–630.
5 D. Tran, V. K. Shrivastava, L. X. Nghiem and B. F. Kohse, Geomechanical risk mitigation for CO2 sequestration in saline aquifers,Soc. Pet. Eng. J., 2009, 125167.
6 L. Luquot and P. Gouze, Experimental determination of porosity and permeability changes induced by injection of CO2into carbonate rocks,Chem. Geol., 2009,265, 148–159.
7 C. Zhang, K. Dehoff, N. Hess, M. Oostrom, T. W. Wietsma, A. J. Valocchi, B. W. Fouke and J. C. Werth, Pore-scale study of transverse mixing induced CaCO3 precipitation and permeability reduction in a model subsurface sedimentary system,Environ. Sci. Technol., 2010,44, 7833–7838.
8 R. Moosavi, A. Kumar, A. De Wit and M. Schro¨ter, Influence of mineralisation and injection flow rate on flow patterns in three-dimensional porous media,Phys. Chem. Chem. Phys., 2019,21, 14605–14611.
9 G. Schuszter and A. De Wit, Comparison of flow-controlled calcium and barium carbonate precipitation patterns, J. Chem. Phys., 2016,145, 224201.
10 A. R. White and T. Ward, CO2sequestration in a radial Hele- Shaw cellviaan interfacial chemical reaction,Chaos, 2012, 22, 037114.
11 Q. Wang, F. M. Zanotto and O. Steinbock, Precipitate patterns in a Hele-Shaw cell with small sinusoidal height variations,J. Phys. Chem. C, 2020,124, 21617–21624.
12 A´. To´th, G. Schuszter, N. P. Das, E. Lantos, D. Horva´th, A. De Wit and F. Brau, Effects of radial injection and solution thickness on the dynamics of confined A+B-C chemical fronts,Phys. Chem. Chem. Phys., 2020,22, 10278–10285.
13 F. Brau, G. Schuszter and A. De Wit, Flow control of A+B-C fronts by radial injection,Phys. Rev. Lett., 2017,118, 134101.
14 R. Z. Douaihy, M. Al-Ghoul and M. Hmadeh, Liesegang banding for controlled size and growth of zeolitic-imidazolate frameworks,Small, 2019, 1901605.
15 B. Bohner, G. Schuszter, O. Berkesi, D. Horva´th and A´. To´th, Self-organization of calcium oxalate by flow-driven precipi- tation,Chem. Commun., 2014,50, 4289.
16 Q. Wang, M. R. Bentley and O. Steinbock, Self-organization of layered inorganic membranes in microfluidic devices, J. Phys. Chem. C, 2017,121(26), 14120–14127.
17 F. Glaab, M. Kellermeier, W. Kunz, E. Morallon and J. M.
Garcı´a-Ruiz, Formation and evolution of chemical gradients and potential differences across self-assembling inorganic membranes,Angew. Chem., 2012,124, 4393–4397.
18 D. Horva´th, M. A. Budroni, P. Ba´ba, L. Rongy, A. De Wit, K. Eckert, M. J. B. Hauser and A. To´th, Convective dynamics of travelling autocatalytic fronts in a modulated gravity field,Phys. Chem. Chem. Phys., 2014,16, 26279.
19 P. Ba´ba, L. Rongy, A. De Wit, M. J. B. Hauser, A´. To´th and D. Horva´th, Interaction of pure Marangoni convection with a propagating reactive interface under microgravity, Phys.
Rev. Lett., 2018,121, 024501.
20 P. C. Carman,Fluid flow through granular beds, Transactions, Institution of Chemical Engineers, London, 1937, vol. 15, pp. 150–166.
21 G. Schuszter, D. Horva´th and A´. To´th, Convective instabil- ities of chemical fronts in close-packed porous media, Chem. Phys. Lett., 2012,546, 63–66.
22 G. Schuszter, F. Brau and A. De Wit, Flow-driven control of calcium carbonate precipitation patterns in a confined geometry,Phys. Chem. Chem. Phys., 2016,18, 25592–25600.
23 E. Balog, K. Bittmann, K. Schwarzenberger, K. Eckert, A. De Wit and G. Schuszter, Influence of microscopic precipitate structures on macroscopic pattern formation in reactive flows in a con- fined geometry,Phys. Chem. Chem. Phys., 2019,21, 2910–2918.
24 R. Turuban, D. R. Lester, T. Le Borgne and Y. Me´heust, Space- group symmetries generate chaotic fluid advection in crystal- line granular media,Phys. Rev. Lett., 2018,120, 024501.
25 G. M. Homsy, Viscous fingering in porous media,Annu. Rev.
Fluid Mech., 1987,19, 271–311.