VEZETÉSTUDOMÁNY / BUDAPEST MANAGEMENT REVIEW
Generating far over 1 trillion USD of revenue (De- loitte, 2015), the pharmaceutical industry should only have one realistic aim beyond the provision of corpo- rate profit: treating diseases. This aim can be reached by efficient drugs with appropriate side effect profile, namely safe active ingredients. By drug efficacy we
mean its ability to promote a quantifiable biological response. In case of drug safety, the question is: what secondary (and usually negative) effect does the drug have on the human body? The clinical evidence (also referred to as scientific evidence) is determined by the drug’s efficacy and safety profile. As a marketing-ori-
Bence KOVÁCS – Judit SIMON
THE IMPACT OF SCIENTIFIC EVIDENCE AND PRICE LEVEL OF HYPERTENSION DRUG THERAPIES ON THEIR MARKET PERFORMANCE
– A EUROPE BASED ANALYSIS
This study aims to investigate how much the market performance of drug therapies is influenced by their scientific evidence and price level. Compared to the seemingly simple objective, performing the analysis in the pharmaceutical industry makes the evaluation very complex. Examining the purchase decision process in the prescription drug market, besides the patient as the final consumer, the prescribing physician has the largest decision potential. In addition, the authors cannot ignore the healthcare system financing the therapy either, not to mention the interlacements of regulations, manufacturer interests, their marketing potential and marketing activities. This complexity makes it impossible to describe the pharmaceutical industry in uniform terms. The literature search also confirms that the mentioned complexity makes it hard to draw unambiguous conclusions. In spite of that –with a positivistic approach- the authors live with the assumption that scientific evidence (better efficacy and safety profile) should be awarded on the market on the aggregate level. It is inevitable to clarify at the very beginning that the authors investigate active pharmaceutical ingredients (APIs) and not brands in the recent study. With all this in mind, their intention is to introduce a novel approach for the evaluation of the relationship between the product characteristics (clinical evidence of APIs) and their market performance. In order to examine the relationship the authors involved APIs that belong to the same indication group, having the same mechanism of action and which have been in the generic competition for years after their patent have expired. As a model they perform the analysis with antihypertensive drug therapies. The authors consider that it is possible to rank the active ingredients of drug therapies on the basis of their efficacy and safety, based on relevant clinical literature.
The result of ranking serves as the starting point of the analysis. Unequivocally, the authors do not forget about the additional factors that significantly influence the market performance of APIs, but delibera- tely do not involve these factors in the recent analysis. These factors are the different reimbursement and funding policies, marketing activity of the manufacturers, country-of-origin effect, the impact of clinical guidelines and clinical literature, and their effect on each other. There is one exception, since the article partially deals with the influence of price level on the market performance. In contrast with the majority of the available literature, this study aims to explore the identifiable patterns by investigating the European pharmaceutical market on system-level.
Key words: pharmaceutical therapies, scientific evidence, price level, market performance
ented analysis we would like to investigate the effect of scientific evidence on market performance. The fun- damental assumption of our research is that the vari- ous drug therapies can be ranked based on these two factors. In order to define the ranks, we use the basic principles of evidence based medicine in the analysis (Sacket, 1997; Friedland, 1998; Botz – Szűcs, 2014;
Hamer – Collinson, 2014). Evidence based medicine is the explicit and judicious use of current best evidence in making decisions about the care of patients based on the best available external clinical evidence from systematic research. Following the principles, the re- cent article assumes that clinical ranks can be defined for APIs that have instead of have the same method of action, by the evaluation of the relevant clinical lit- erature on efficacy and safety. We must also mention that there are authors who question the general accept- ability of evidence based medicine (Greenhalgh et al., 2014; Spence, 2014). This skeptical approach, however, is not attributable to the unacceptability of the prin- ciples, but rather to the hardly processable amount of literature serving as the basis of analysis and the strong influence of the pharmaceutical industry on the stud- ies. Concerning the influence of the industry, Sismon- do suggests that as many as 40% of published articles focusing on specific drugs are ghost managed, i.e. di- rectly influenced by pharmaceutical manufacturers.
Even independent of detailers, responsible physicians and medical researchers search the literature to gather evidence about the best treatments. Published scientific articles are the sources of medical information with the highest authority. Systematic reviews and meta-anal- yses almost all start with the published literature, so even fully independent reviews are influenced by ghostly activities (Sismondo, 2007).
The effect of the efficacy and safety on the prescription of drug therapies
In their paper, Borjádi and Juhász emphasize that
‘Drugs are not the objects of desire like most consum- er goods but they are real consumer needs” (Borjádi – Juhász, 2003). As mentioned previously, our arti- cle evaluates this question from the marketing point of view. Likewise, the authors summarize the corre- sponding marketing literature and build their analysis on the marketing principles. With respect to this, let’s examine how this statement can be interpreted in the drug prescription process. The only aim of the patient taking the drug is to get treated by the most efficient therapy with the least possible side effects. Pursuant to the vocation, the prescribing physician’s primary inter- est cannot be different from that of the patient. The pay- er’s responsibility is more complex in this issue even
theoretically, since on an economic basis the payer has to choose the recommended therapy within the given indication based on the cost-benefit ratio (Bootman – Townsend, 1991). When concerning the benefit of the therapy, efficacy and safety may be a dominant factor, and during the comparison of therapies the payer also has to consider which therapy is scientifically proven to be the best. Of course, the question is far from be- ing this simple. On one hand, the evaluation of the sci- entific evidence (and accordingly the ranking that the authors introduce) is not a simple task. The complete information of the stakeholders is not present in the system. This is attributable among others to the biasing effect of actors with different levels of awareness and corporate and political interests as well as the complex nature of evaluation. On the other hand, the choice and therefore market performance of drugs (in volume) is not solely determined by their scientific evidence. The cost of the therapy and the availability of products are central questions and of course, product promotion also has a significant influencing effect. First of all, we summarize the effect of clinical evidence in the light of corporate marketing activities.
Generally investigating marketing investments, Berndt et al. had several observations concerning the market of anti-ulcer drugs. Marketing investments un- equivocally have a positive influence on drug sales, which obviously effect spreads from the innovator product to the follower generic products. The authors mention that switching between therapies is fast- er when the manufacturer can prove an actual added value (e.g. lower dose, less side effects) (Berndt et al., 1996).
Through contact with pharmaceutical representa- tives and attendance on symposiums, physicians be- come well-informed on the drugs’ clinical evidence (Gönül et al., 2001), and these activities have signifi- cant informative and persuasive effect (Narayanan et al., 2005). Clinically, the most important information of all is the efficacy and safety of drugs. In the litera- ture, Azoulay is the first to deal with the relationship between the scientific value of a drug and sales data (Azoulay, 2002). Investigating the market of H2 antag- onists, he concludes that marketing (promotion) has a much more dominant effect on the demand of drugs than their clinical evidence. Still, we shall also consid- er the effect of the latter as significant both statistically and economically. Thoroughly studying the paper, one may also recognize that in his research, the author has not examined how much the effect of promotion is af- fected by clinical evidence (the effect of the physician being visited with a clinically more beneficial drug).
However, clinical evidence may also present indirect- ly in drug prescribing. As a conclusion of his study,
VEZETÉSTUDOMÁNY / BUDAPEST MANAGEMENT REVIEW
Azoulay states that on the market of H2 antagonists, Zantac was able to overshadow Tagamet, which was ahead of it, due to its more appropriate clinical profile.
Further positive examples of a clinically more ad- vantageous compound being able to take over the mar- ket:
• The world’s largest blockbuster, the manufacturer of Lipitor (Warner-Lambert) has widely commu- nicated that its compound is as efficient in lower- ing cholesterol levels as its competitors (Merck:
Zocor, Bristol Myers-Squibb: Pravachol) but this effect is reached by a much lower dose (Winslow, 2000).
• In relation to our later research results, the sto- ry of Vasotec (enalapril) and Capten (captopril) is also an interesting example on the market of ACE inhibitors. Enalapril has appeared on the market after captopril and was still able to reach a much higher share on the US market. The main reason of this was Merck’s appropriate marketing activity (Werth, 2013).
The example of Zoloft and Prozac may be of inter- est too. However the two compounds can be considered very similar clinically, Zoloft was able to overshadow Prozac from the second position. By not being able to come up with real advantages in the reasoning, Zoloft is an example for the persuasive power of marketing (Cutler – Berndt, 2007).
If we investigate the marketing effect of visits by pharmaceutical sales representatives, we will not get an unequivocal answer based on the literature. While there are authors who think there is a positive relation- ship between visits by pharmaceutical sales representa- tives and prescribing (Gönül et al., 2001), others think that the relationship is weak (Mizik – Jacobsen, 2004), and we also found literature, where the authors state that there is no relationship whatsoever between the two (Rosenthal et al., 2003). Leeflang et al. think that the conflicting results are due to the inaccuracy of re- search. In their study, they claim that researches do not treat brand portfolio marketing investments uniformly, therefore these can bias the results, and the physician’s responsiveness may also vary during the promotion of the different therapies (Leeflang – Wieringa., 2010).
Based on studies using aggregated data for the anal- ysis, we can conclude that the marketing activity of manufacturers (e.g. visits by pharmaceutical sales rep- resentatives, symposiums) have an unequivocally posi- tive effect on drug sales (Chintagunta – Desiraju, 2005;
Narayanan et al., 2004; Narayanan et al., 2005; Neslin, 2001; Rizzo, 1999). In a meta-analysis (Kenneth et al., 2016) will be found that there are several factors which
directly and indirectly affect the physician’s prescrip- tion pattern. They find that the curing effect is the most important factor, but the influence of patients and ad- vertising can be significant factors as well. The above examples show that the statement – although verified on aggregated level – is not necessarily applicable for all therapeutic groups and in each case. That is why it is essential to examine this issue in details.
Based on the foregoing, Venkataraman and Stremersch studied the relationship of clinical evi- dence and the number of prescriptions (sales, indirect- ly), just like Azaulay (Venkataraman – Stremersch, 2007). Interestingly, they consider their work as a first in the investigated issue – just like Azaulay. The study investigates how much a drug’s clinical advantage (in terms of safety and efficacy) influences the effect of pharmaceutical actors’ marketing activities (visits and professional symposiums and B2C activities appearing in patient requests) on prescription. In their economet- ric model, the authors examined the following factors:
• detailed biannual visiting activity of a US phar- maceutical company by months for 3 drug groups (statins, gastrointestinal agents, erectile dysfunc- tion),
• the attendance of symposiums organized by the manufacturer for doctors,
• drug requests by patients at the 2774 studied phy- sicians,
• the number of prescriptions and the amount of dis- tributed drugs,
• efficacy (meta-analysis of clinical trials, ‘Z-values’
compared to placebo),
• side effect profile (FDA, drug approval database).
According to their theory, more efficient therapies decrease the uncertainty of physicians, therefore con- vincing physicians becomes easier via various market- ing activities (as Azoulay has described it in his paper in 2002). In terms of safety, drugs with less favorable side effect profile increase the physician’s uncertainty.
This uncertainty can be decreased by marketing activ- ities but because of the earlier described, physicians prefer safer therapies. Of their conclusions it is worthy to emphasize that it is important to examine the differ- ent drug groups and drug brands separately as it is hard to make a valid conclusion in general. Nevertheless, the authors claim that prescription of drugs is higher where a more efficient or safer therapy is considered.
Also, physicians take their patients’ requirements more into consideration in such cases. It is necessary to em- phasize that the authors based their results on US data.
According to Scherer’s study, switching between different drugs is made more difficult by the established
prescription habits and the possible negative conse- quences that the doctors will face (e.g. negative profes- sional and perhaps legal consequences of prescribing a new drug). However, this effect may be decreased if genuinely relevant and objective information is avail- able on a competing product. In such cases, switching takes place faster (Scherer, 1990).
The role of price in decision making on drug prescription
The role of price in the decision making process may vary in the different countries; therefore literature is also not unified in the question whether marketing costs decrease price sensitivity. Ceteris Paribus, doc- tors should choose the cheapest therapy, which can be strongly modified by the convincing function of marketing, predominantly because the ceteris paribus principle is really difficult to evaluate among drug therapies (De Laat et al., 2002; Leffler, 1981; Hurwitz – Caves, 1988). If doctors become less price sensitive as a result of corporate marketing activity, this process is considered by De Laat et al. as ‘increase of brand loyalty based on factors other than brand characteris- tics’ (De Laat et al., 2002, p. 80.). This leads to higher prices, which finally emerges as a loss of the society (Windmeijer et al., 2005). In contrast with Windmei- jer et al., Leeflang and Wieringa state that this effect is not significant (Leeflang – Wieringa, 2010). About
their work, it is important to mention that it has inves- tigated the quasi totally funded Dutch pharmaceutical market. In a Swedish study (Semark et al., 2013) the registered data of dispensed drugs were analyzed to- gether with the sociodemographic data of the patients.
For each of the diagnostic groups (chronic obstructive pulmonary disease, depression, diabetes, and osteo- porosis), selected drugs were dichotomized into cost categories, lower and higher price levels. They found that individual factors such as gender, age, education, income, foreign background, and type of caregiver (public or private) influenced the prescribing of drugs of different price levels, although in some cases, the influence was relatively small. Because the average price of the cheaper drugs in each diagnostic group was between 19% and 69% versus more costly drugs, there is a risk that factors other than medical needs are influencing the choice of drug. However, medical reasons for the observed differences cannot be ruled out.Based on the results of Cleanthous et al., the exis- tence of health insurances and the increase of the ex- tent of reimbursement, decrease price sensitivity and price regulation in turn increases price sensitivity on the pharmaceutical market. This statement explains why authors investigating different countries get total- ly different results (Cleanthous et al., 2005). For this reason it is crucial to compare the drug policy tools of the analyzed countries.
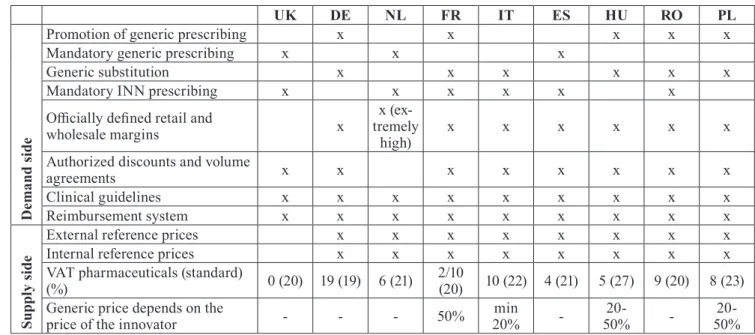
Table 1 Supply and demand side drug policies in 9 European countries in 2017
UK DE NL FR IT ES HU RO PL
Demand side
Promotion of generic prescribing x x x x x
Mandatory generic prescribing x x x
Generic substitution x x x x x x
Mandatory INN prescribing x x x x x x
Officially defined retail and
wholesale margins x x (ex-
tremely
high) x x x x x x
Authorized discounts and volume
agreements x x x x x x x x
Clinical guidelines x x x x x x x x x
Reimbursement system x x x x x x x x x
Supply side
External reference prices x x x x x x x x
Internal reference prices x x x x x x x x
VAT pharmaceuticals (standard)
(%) 0 (20) 19 (19) 6 (21) 2/10
(20) 10 (22) 4 (21) 5 (27) 9 (20) 8 (23) Generic price depends on the
price of the innovator - - - 50% min
20% - 20-
50% - 20-
50%
(Author’s edit, Source: Barbu, 2012; Dylst et al., 2012; Kaplan et al., 2012; Kanavos et al; 2011a,2011b;
Panteli et al., 2016;Thomson-Mossialos 2010; Vogler, 2012; Vogler et al., 2015)
VEZETÉSTUDOMÁNY / BUDAPEST MANAGEMENT REVIEW
The effect of drug policy tools on different pharmaceutical markets
The role of authorities on the pharmaceutical market varies in the different countries of the world. Consid- ering the healthcare financing systems three major health care models are used in industrialized nations, including: the Beveridge model, the Bismarck mod- el, and health care systems based on private found- ing. Concerning the European healthcare systems, the foundations of the Beveridge and Bismarck models are the dominant. The Beveridge model provides health care for all citizens and is financed by the government through tax payments (UK, Italy, Spain). The Bis- marck model uses an insurance system and is usually financed jointly by employers and employees through payroll deduction. Unlike with the US insurance indus- try, Bismarck-type health insurance plans do not make a profit and must include all citizens. Doctors and hos- pitals tend to be private in Bismarck countries (Germa- ny, France, Netherland, Hungary, Poland) (Busse et al., 2007; Chintagunta – Desiraju, 2005; Wallace, 2013).
The characteristics of the funding system and the country’s drug policy largely determines what interest physicians, industrial actors and patients need to take into consideration in the process of drug purchase. For the analysis, it is necessary to review and compare the generic funding and reimbursement tools of the coun- tries involved in our research. The analysis is helped by the Table 1, which summarizes the demand and sup- ply side pharmaceutical market regulations of the nine countries involved in the analysis. Table 1 is a result of proprietary research activity.
We will return to the role of governmental funding and reimbursement policy during the analysis, howev- er only on a superficial level, since the impact of the reimbursement and funding system could be the scope of an independent research. In this chapter we only bring up a few examples to illustrate trends, emerging from the difference of drug policies in purchasing de- cision. Investigating the Dutch pharmaceutical market, Leeflang and Wieringa concluded that in case of most drugs, the price of the drug has no effect on demand and doctors’ decisions. Their results were supported by the study of Gönül et al. in 2010 (Leeflang – Wierin- ga, 2010). Consequently the authors declare that only clinical considerations should be present during drug prescription, both by doctors and patients. This could be strongly arguable as a general statement. However the statement is less debatable, if the almost perfectly insured Dutch pharmaceutical market is considered.
Dutch doctors and patients care less about the financial considerations when choosing a medicine.
Governmental policies play a great role in the for- mation of price level as well. The tools for this aim may
be the mandatory price reduction for generics against innovator products (e.g. in France, the first generic has to set a price at least 50% lower than the originator), tax rates, as well as external and internal reference prices.
In relation to the role of drug policy, we should not ignore to mention the high influence of clinical guidelines on doctors’ decision. These professional guidelines represent the interest of both authorities and professional stakeholders. Their primary aim is to influence the prescribing decision (Spurling et al., 2010). However, in terms of the clinical guidelines, it is always indispensable to examine the interests in the background as well (e.g. besides professional inter- ests, reimbursement protocols; reduction of drug costs, pharmaceutical lobby, etc., may also be present).
In our analysis, we investigate generic pharmaceu- tical markets where the patents of active ingredients have expired for at least 5 years. This is necessary be- cause we strongly believe that clinical superiority can only predominate the market in a competitive land- scape, after a proper amount of time. It is inevitable to mention that clinical evidence helps to launch the in- novator product and has a drag on effect in genericized markets. The aforementioned clinical guidelines also promote this process. When examining governmental factors, it is therefore necessary to examine how these factors influence (stimulate) the purchase of generic drugs. The Figure 1 shows the share of generic drugs in certain countries in terms of volume and sales rev- enue. It is interesting to compare the regulatory drives (Support of generic prescription, Mandatory generic prescribing, Generic substitution, Mandatory INN pre- scribing) leading to high values in the countries with the most significant generic share (DE, PL, NL, UK).
Figure 1 Generic market share in European countries
(Source: Generics Initiative, 2014
Research Questions and Framework
Our assumption is that clinical evidence of drugs has a positive effect on their market performance. As we could see, literature is ambiguous in this question. This is due to that in most cases the authors examined a sin- gle country only and because there are many mutually interrelated variables. The purpose of our research is to analyze the relationship with a rather novel approach, through the example of several countries. Of course, it is fundamental to define the framework in which the statement is considered to be valid. For the sake of comparability, we define the depth of our study at the level of active ingredients. We do so because on a scientific basis this is the level where it is meaningful to make a distinction between drug therapies. (We can live with this assumption, because due to the gener- ic concept, the rigidity of the drug approval process provides identical quality for products containing the same active ingredients.) Consequently the volume of aggregated sales associated to active ingredients may provide good comparability of the different drug thera- pies. Another important criterion is that our study was performed in the market of generic drugs. The monop- olistic market of patented active ingredients deserves distinct evaluation. In the research we involved active ingredients if their patent expired at least 5 years ago.
The post-patent period is critical, since generic market entries redefine the market. A 5-year timeframe may be sufficient for the development of a new balance as a result of regulation and free competition. For the afore- mentioned reason it is also a stipulation that innovative drug therapies should not appear in the examined indi- cation in the examined period which could redefine the market. Our research was conducted in the market of prescription drugs. In the market of prescription drugs, physicians act as the agents of patients, so the consum- er is well distinguishable from the decision maker in the purchasing process. Assuming a clinically respon- sible drug prescription, the doctor’s primary motiva- tion must be the selection of a clinically appropriate therapy. Therefore due to the unavoidable control of doctors in the market of prescription drugs, the clinical evidence (meta-analyses and guidelines) has a larger effect than in the market of OTC drugs. Another argu- ment in favor of examining the market of prescription drugs is that due to the rigor associated with pharma- ceutical advertising, the effect of advertisements tar- geting the final consumer is negligible (Gönül et al., 2001). According to our assumption, the clinical ev- idence presents in the market sales of active ingredi- ents within the described framework in the following way: Following the expiry of patent protection, generic manufacturers prefer therapies with active pharmaceu- tical ingredients, which are the most appropriate for
convincing the prescribing physician. In the medical persuasion, the clinical evidence of active pharmaceu- tical ingredients has a critical role, and this effect is further supported by the above mentioned professional guidelines. In order to avoid competitive disadvantage, generic manufacturers develop and market the clinical- ly most appropriate therapy, and allocate the market- ing investments to this territory, thereby increasing the level of knowledge in the market. Since our study was performed on the level of active pharmaceutical ingre- dients – and not on the level of manufacturer brands – it has to prevail in the generic competition that the clin- ically more beneficial active pharmaceutical ingredient can reach higher sales volumes. We have to emphasize, that the previous statement stands in theory, but this relationship is seriously affected by further factors. In spite of that we deliberately avoid the evaluation of the impact of further factors, except one: the effect of the price level.
In our analysis we could not ignore the effect of the price level of the discussed drug therapies. The coun- tries involved in our study typically possess extend- ed health insurance system and high (100% in several cases) reimbursement rates on the basic drugs which decreases price sensitivity among doctors and patients.
On one hand, this effect may vary in the different coun- tries (e.g. because of low income patient groups), and on the other, we should not forget that the payer’s aim is to promote choice between the available therapies based on optimal cost-benefit rate. When performing the study on the level of active pharmaceutical ingre- dients, it is worth to analyze the influencing force of price level characteristic of the individual active phar- maceutical ingredients. The primary focus of this study is therefore to investigate the effect of clinical evidence and price level on the market performance of drugs. In addition, we will take an outlook on the further factors influencing the relation in question.
Drug therapies in the scope of research
We had to choose an indication group for the analysis that meets the requirements of the described frame- work. Our choice was the drug therapies of hyperten- sion:
• several drug families are distinguished for the treatment of hypertension based on their mecha- nisms of action (diuretics, ACE inhibitors, ARBs, etc.),
• due to the importance and duration of this field, several therapies are known within the drug families (e.g. more than 10 ACE inhibitors and 7 ARBs),
VEZETÉSTUDOMÁNY / BUDAPEST MANAGEMENT REVIEW
• within these two groups, the expiry of the patent protection of active pharmaceutical ingredients is well beyond the predetermined limit,
• the active pharmaceutical ingredients has pre- scription status and are available in the analyzed countries.
According to the original concept, we intended to rank the anti-hypertensive therapies both by mecha- nism of action groups and on the level of individual active pharmaceutical ingredients (within the groups) as well. However, as a result of consultation with doc- tors, only two groups and their active pharmaceutical ingredients were involved in the analysis. These two groups are angiotensin-converting enzyme inhibitors (ACE inhibitors, ATC code: C9A)) and angiotensin II receptor blockers (ARB, ATC code: C9C)). The reason of such filtering is that therapies with different mecha- nism of action are used for the treatment of not only hy- pertension but other indications too. Since these appear in the aggregated sales data, the criteria of comparabil- ity would not have been met. The chosen two groups meet all the criteria as they are prescribed in the same range of indication in the vast majority of cases. There was no need for any similar exclusion on the level of active pharmaceutical ingredients. ACE inhibitors and ARB therapies are also prescribed in fixed dose combi- nations. After discussions with physicians we decided to perform the analysis with the mono therapies and to exclude the combinations.
Clinical ranking based on evidence based medicine principles
In order to compare active pharmaceutical ingredients, it was important to first determine their clinical order.
Towards, clinical meta-analyses, scientific compara- tive studies, and professional guidelines were collect- ed within this indication. The key to the comparison of therapies were obviously the results of random- ized clinical studies and their higher level, systemat- ic analyses, such as meta-analyses. The formation of the scores was a three phase procedure. First of all, the authors collected clinical literature, and based on that we defined our ‘internal’ ranking of the APIs. The clinical literature was classified according to the inter- nationally accepted classification system of evidence based medicine (Botz, 2014) and the order of clinical evidence and the ranks was calculated by using the weights based on the classification system. (The list of clinical literature used for the research is attached in Annex 1.) Since the authors are not medical doctors, we validated our results with medical doctors (1 inter- nist, 1 surgeon, and one GP). First, we asked them to
perform a literature search and rank the APIs based on their literature search (evidence based medicine scor- ing was introduced to them). As a second round we asked them to confirm/ refine the scoring with their professional experience. We got the final ranking af- ter discussing the results jointly. We did not initiate to gather and analyze data until the closure of the valida- tion process, in order to ensure the independency of our judgment. The clinical evidence of therapies on the API level was considered universal for the concerned countries.
From medical point of view, the use of ARBs is rec- ommended against ACE inhibitors due to their more fa- vorable side effect profile. The clinical ranking of ACE
inhibitor drug therapies is indicated on the Figure 2.
As a limitation, of course this ranking could be re- fined in the future (more reviewers, more literature, and more robust methodology). However the authors rather consider this research a medical-oriented, and not a marketing-oriented goal. All in all, the authors think, the research and work and the involvement of medical doctors justifies the implication of the ranking in the recent study.
Market data and Methodology
We perform and present two types of analyses in the recent study. First, we compare the two pharmacologi- cal groups (ARB vs ACE), and then the active pharma- ceutical ingredients of ACE inhibitors were compared based on sales volume (thousand tablets, moving an- nual total (MAT)) and sales revenue (EUR, ex factory price, moving annual total (MAT)). Information con- cerning market performance was gained from the IMS database made available by Gedeon Richter Plc. On the first level of query, the distribution by dosage form was examined. Since 99.9% of ACE inhibitors and almost 100% of ARBs are taken orally worldwide, only oral pharmaceutical forms were filtered during the later queries. Therapeutic group–country, active pharma- ceutical ingredient–country, and active pharmaceuti- cal ingredient–country–brand level queries were also performed for the affected markets. In order to secure comparability, we analyzed sales volume data in the
Figure 2 Summary of the relations of clinical evidence
concerned countries, more punctually we compared the sales ratio that describe each API’s market perfor- mance in the concerned countries. We also took into account that the APIs differ concerning defined daily dose (DDD) and that different strengths are available.
The Days of Treatment (DOT) can be given only if we know all the mentioned information about the APIs.
From IMS database we got the sales volume (thou- sand tablets) in the following breakdown: API-streng- ht-country. From that data we were able to calculate if the ratio of Sales volume (please find later as CU/
MAT) is linearly proportional to DOT. We can confirm that the values used for the analysis represent the ratio of DOT of the API therapies.
In order to explore interrelations, the markets were described by different indices. In addition, the method of multidimensional scaling was used for the demon- stration of similarities and differences between coun- tries. Multidimensional scaling is a method allowing the comparison of objects based on the level of similar- ity while taking multiple variables into consideration at the same time (Malhotra, 2010). The method is capa- ble to explore data structure in such a way that the ob- jects are represented as geometric relationships among points in a multidimensional space. The advantage of the method is the graphic display visualizing the mag- nitude of differences between the objects and showing which objects are close to each other. The statistical reliability and validity of the solution is measured by R2 value and the stress indicator. The method does not
provide a direct solution for interpreting the dimen- sions of the space of perception and object character- istics. The interpretation may be promoted by several ways: based on professional expertise or using different evaluation methods with qualitative nature and supple- mentary calculations such as regression analysis may insert characteristics vectors into the perceptual map.
Thus, as a result of multidimensional scaling, it may be determined which objects are close to each other and which are more far away and it also gives an idea on which dimensions of characteristics form the basis of the objects’ spatial localization (Backhaus et al., 2015).
In our analysis, the countries were placed as objects in the multidimensional space, and the similarity data were derived from their characteristics.
Results
In accordance with the methodology section, we ex- amined the ranking of clinical evidence and price level of anti-hypertensive drugs and their effect on market performance in nine European countries (United King- dom, Germany, Netherlands, France, Italy, Spain, Hun- gary, Romania, Poland) (Table 2). When we examined the clinical evidence of drug therapies, with the help of the medical doctors we concluded that ARB therapies are considered to be superior against ACE inhibitors.
In order to analyze the relationship, therapeutic group–
country level data were queried from the IMS data- base. Our raw data were as follows: Group-level aggre- Table 2 Comparative table of ACE and ARB therapies
Country
ARB price level (EUR/
CU)
ACE pri- ce level
(EUR/
CU)
ARB CU (ARB/
Gros) %
ARB EUR (ARB/
GROSS)
%
ACE CU (ACE/
GROSS)
%
EUR(A-ACE GROSS) CE/
%
Price level differen- ce index ARB:A-
CE
Volume differen- ce index ARB:ACE
Sales Revenue differen- ce index ARB:ACE
ARB pref.
index
ES 0,322 0.064 41.91 78.41 58.09 21.59 5.03 0.72 3.63 2.62
DE 0.158 0.025 32.58 75.56 67.42 24.44 6.4 0.48 3.09 1.49
FR 0.196 0.14t7 49.59 56.81 50.41 43.19 1.34 0.98 1.32 1.29
IT 0.249 0.14 43.2 57.53 56.8 42.47 1.78 0.76 1.35 1.03
NL 0.067 0.036 38.87 54.12 61.13 45.88 1.85 0.64 1.18 0.75
UK 0.138 0.054 29.05 51.26 70.95 48.74 2.57 0.41 1.05 0.43
HU 0.113 0.067 29.22 41.12 70.78 58.88 1.69 0.41 0.7 0.29
RO 0.143 0.076 25.73 39.4 74.27 60.6 1.88 0.35 0.65 0.23
PL 0.133 0.085 24.22 33.23 75.78 66.77 1.56 0.32 0.5 0.16
VEZETÉSTUDOMÁNY / BUDAPEST MANAGEMENT REVIEW
gated sales volume (thousand tablets) and sales revenue (€, ex factory price) of ACE inhibitors and ARBs as the sum of hospital and pharmacy sales. (Aggregated sales volume allows appropriate comparison of defined daily dose of the individual therapies between the two groups. This was tested separately.) Derived indicators for the characterization of markets:
• Price level of ARBs and ACE inhibitors: Ratio of the revenue and sales volume. Price level charac- teristic to the individual countries by therapeutic groups.
• Price level difference index: The ratio of the mean price level of ARB and ACE inhibitor therapies show the extent to which ARB therapies are more expensive compared to ACE inhibitors in the giv- en country.
• Volume difference index: The ratio of ARB sales volume and ACE inhibitor sales volume. Its value shows the proportion of ARB and ACE inhibitor sales characteristic to the given country.
• Sales revenue index: The quotient of sales reve- nues. The value determines the proportion of fi- nancial outflow (both by consumers and payers) for ARB and ACE therapies. It may be also in- terpreted as a product of volume and price level difference index.
• ARB preference index: Sales revenue index (where volume and price both play a role) multiplied by the volume difference index. The significance of the prescribed volume is square-weighted, and the influence of higher ARB prices is also taken into account.
Recommendation: In order to support the interpre- tation of the results, multidimensional scaling has been performed (after the percentages were decimalized) (Fig- ure 3). With this method, it can be appropriately exam- ined how similar these nine European countries may be considered in terms of the market data of ACE and ARB therapies. The two-dimensional scatter plots that present the similarity of the countries was achieved by running the ALSCAL routine of SPSS 22.0 software package with standardized variables, using Euclidean distance plot and ordinal scale. The value of the stress indicator testing the statistical fit was 0.00198 (Kruskal’s stress formula), and R2 was 0.999 indicating extremely close fit.
It is well visible that the countries localized on the stretched plain can be excellently evaluated by a 2×2 matrix. The first dimension is determined by the differ- ence in the price levels of ARBs and ACE inhibitors, while the second dimension is determined mostly by the market share of ARBs. Of these countries, only the United Kingdom is difficult to be classified into any of
the 4 groups. The reason is that the UK is characterized by relatively low ARB share (its value is almost identical with the Hungarian data), despite a higher price level.
However, this higher price level is far below the German and Spanish values where there is indeed a large dif- ference between the price levels of the two therapeutic groups. As described, the point symbolizing the Unit- ed Kingdom is located very close to the pole symbol- izing the countries’ center of gravity. When examining the value of ARB preference index, a similar pattern emerges. The Spanish market ranked first with a high sales volume even beside an outstandingly high price level of ARBs. The trio of Germany, France, and Italy form a group with the value between 1 and 1.5 point.
In the French and Italian market, high sales volume is also supported by lower price level. The German mar- ket, although lags behind the previous countries in terms of volume, however this sales volume is reached beside an outstanding price level. In spite of high price level, its sales volume exceeds that of the low share countries forming the next group. The Dutch market is considered to be average in every aspect, while the already men- tioned UK market (despite its higher price level) is close to the last group in terms of ARB sales volume. The last group consists of the Hungarian, Romanian, and Polish market. These countries are characterized by low share of ARB which is accompanied by a price level almost comparable with that of the ACE inhibitors.
Of the two treatment groups, ACE inhibitor thera- pies were analyzed on the level of active pharmaceuti- cal ingredients too. In the following table, the first data to appear beside the name of the active pharmaceutical ingredient is the clinical rank determined by the anal- ysis. It is followed by the sales volume data by active pharmaceutical ingredients characterizing the exam-
Figure 3 Results of the multidimensional scaling
ined markets. The results of the active pharmaceutical ingredient–country level query of the IMS database were transformed into market share for the sake of comparability. The rows of active pharmaceutical in- gredients with a market share over 10% are marked by bold fonts, and the share of the most commonly applied active pharmaceutical ingredients was marked by un- derlining. Table 3 indicates the innovator of the given active pharmaceutical ingredients, or if the innovator (or the compound) was acquired then the name of the holder pharmaceutical company and its nationality.
Based on the results, amongst the ACE inhibitor therapies the sales of four compounds can be considered significant. Ramipril, enalapril, lisinopril, and perin- dopril are responsible for 76.6 to 98.8% of the sales in volume in the investigated countries. In general, it can
be stated that these active pharmaceutical ingredients have high clinical ranks (1st or 2nd) within the group of ACE inhibitors however apparently the proportions are shifted in the different countries. From the aspect of patients it is considered a positive result that ramipril, which takes the first place in clinical ranking, also takes the first place based on its share expressed as volume in five of the nine countries (UK, DE, FR, IT, PL). In addition, it has significant sales share (33%) in Hunga- ry as well. Its share is more moderate in Spain (17.6%) and Romania (18.5%), while it is lagging far behind in the Netherlands (5.4%). Ramipril was developed by the German company Hoechst which became part of the French Sanofi group by means of acquisition.
Enalapril (developed by Merck (USA) is the most popular anti-hypertensive therapy in the Netherlands Table 3 Market data of ACE inhibitor therapies in Europe
API Clinical Rank
Sales
VolUK Sales
VolDE Sales
VolNL Sales
VolFR Sales
VolIT Sales
VolES Sales
VolHU Sales
VolRO Sales VolPL MAT/6/16 CU
(%)
MAT/6/16 CU (%)
MAT/6/16 CU (%)
MAT/6/16 CU (%)
MAT/6/16 CU (%)
MAT/6/16 CU (%)
MAT/6/16 CU (%)
MAT/6/16 CU (%)
MAT/6/16 CU
(%) Innov. Country
ramipril 1 58.8 72.1 5.4 46.1 60.0 17.6 33.0 18.5 54.8 Hoechst
>Sanofi DE, FR enalap-
ril 2 5.1 15.9 30.7 5.5 15.4 66.7 17.3 28.4 12.1 Merck USA
(GER) fosino-
pril 2 0.1 0.2 5.9 1.3 1.1 0.5 1.9 3.5 - Bristol-My-
ers Squibb USA lisino-
pril 2 22,9 9,0 23,9 3,3 5,3 6,1 3,3 6,5 5,9 Merck >
Astra Zeneca UK, SE perindo-
pril 2 11.9 0.1 28.2 37.5 6.8 0.9 37.1 23.2 12.9 Servier FR
zofeni-
pril 2 - - 0.4 0.8 8.0 - 5.4 1.6 Menarini IT
capto-
pril 3 0.6 1.9 2.8 1.4 0.6 4.5 5.7 7.3 5.2 Squibb USA
trando-
la-pril 4 0.3 0.0 - 2.4 0.1 0.1 0.3 0.5 1.2 Abbott USA
benaz-
epril 5 - 0.4 0.0 0.9 0.9 0.3 0.2 0.2 0.4 Novartis CH
quinapril 5 0.3 0.3 2.6 0.7 1.2 0.8 1.2 6.4 3.1 Pfizer USA
moexi-
pril 5 0.0 0.0 - 0.0 0.1 - - -
VEZETÉSTUDOMÁNY / BUDAPEST MANAGEMENT REVIEW
(30.7%) and Spain (66.7%) based on sales volume, and has a significant share in the other investigated coun- tries too, with the exception of the United Kingdom and France.
Lisinopril is used for the treatment of hypertension in significant quantities in the United Kingdom (22.9%) and Netherlands (23.9%) among the investigated coun- tries. The original developer was Merck (USA) but the distribution of the active pharmaceutical ingredient was taken by Astra Zeneca (UK, SE). Based on one of our previous researches it is interesting data that investigating the pharmaceutical market of the United States of America, lisinopril leads the sales list of ACE inhibitors with a share over 77% (IMS database, mov- ing annual total (9/15); ratio of sales value based on thousand tablets sold).
Perindopril reaches outstanding sales data in Hun- gary (37.1%, first rank) and France (37.5%). Significant sales volumes are characteristic to the Dutch (28.2%) and Romanian (23.2%) perindopril market, and its share is over 10% in the UK and Polish market. Perin- dopril was developed by the French company, Servier.
Interestingly, captopril which is noted as the first ACE inhibitor therapy but lagging behind in the clini- cal ranking, has a market share over 5% in the Hungar- ian (5.7%), Polish (5.2%), and Romanian (7.3%) mar- ket. (The average price level of captopril is the lowest among ACE inhibitors).
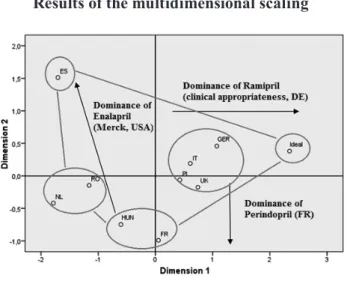
The sales data of the countries introduced in Table 3 were subjected to multidimensional scaling. These nine European countries can therefore be compared by the market data of the 11 different ACE inhibitors. Sim- ilarly to the previous analysis, the SPSS 22.0 software package was used. We set an ’Ideal’ variant in the data- base symbolizing the country which can be considered as ideal in terms of clinical evidence with 100% rami-
pril sales. The value of the stress indicator is 0.0512 (Kruskal’s stress formula), and R2 is 0.987 indicating a very appropriate statistical fit. The first dimension is characterized by higher dispersion.
The following groups of countries can be distin- guished based on the results:
• DE, IT, UK, PL: Ramipril has the highest market share as the most recommended API concerning clinical evidence. Besides ramipril we can typi- cally identify one (maybe two) ACE inhibitor with significant market performance, from the second group of the clinical rank list. Germany is the closest to the ideal state in terms of ACE inhibitor consumption.
• FR, HU: These countries are characterized by per- indopril and ramipril dominance. As both active pharmaceutical ingredients are the products of French pharmaceutical companies, these two coun- tries may be described as having strong French influence in the field of ACE inhibitors. (Based on consultation with pharmaceutical experts, in Hun- gary, this phenomenon may be explained by the marketing activity of EGIS acquired by Servier, the producer of perindopril). The example of the active pharmaceutical ingredient zofenipril can be men- tioned in parallel with perindopril. The API, devel- oped by Menarini (IT) reaches sales volume above 5% only in Italy (8%) and Romania (5.4%). Both examples assume some country of origin effect in the market of anti-hypertensive drugs. Consequent- ly the country of origin effect may be an important influencing factor in the market performance of other active pharmaceutical ingredients (e.g. rami- pril, lisinopril) as well. Due to the above, this effect is worth to be researched further in the future.
• RO, NL: Dominance of enalapril and perindopril.
Interestingly, the literature emphasizes that in the Dutch market, doctors do not make their decisions based on price level in the process of drug pre- scription. However, in the case of ACE inhibitors, it can be concluded that the factor influencing prescription in the Dutch pharmaceutical market is not clinical evidence. Of the investigated coun- tries, the Romanian market of ACE inhibitors is the most fragmented between the various active ingredients.
• ES: The Spanish ACE inhibitor market is obvious- ly ruled by enalapril. Besides enalapril ramipril reaches considerable sales.
By evaluating the effect of the ACE inhibitors’ price level on their market performance, the following con- clusions can be made. The price level of captopril, the
Figure 4 Results of the multidimensional scaling
first noted ACE inhibitor is the lowest in the investigated countries. However, from the clinical point of view, cap- topril lags behind ramipril (first rank) and other active pharmaceutical ingredients that are listed in the second place. This may explain why it also lags behind in terms of market performance in spite of being the cheapest an- ti-hypertensive drug. However, in three countries (HU, RO, PL) captopril is still able to reach a share above 5%. Most probably this phenomenon can be explained by low-income consumer groups with increased price sensitivity even against cheap ACE inhibitor therapies.
This phenomenon exists even though in the European healthcare systems patients sense only a small fragment of the payable price. Another explanation is that mostly elderly patients whose condition is manageable with the captopril was initiated decades ago and the doctor does not want to switch for another therapy.
By examining further sales data we can conclude that in the investigated countries, usually those thera- pies can reach high shares in volume which price level is lower than the average (the price pattern of the APIs differ in the involved countries). It is important to note that the tools of drug policy mentioned at the begin- ning of the literature summary also play an important role in the formation of the price level, so drug policy tools influence prescription patterns directly and indi- rectly too. (Assuming a properly working healthcare system – on an economic basis – the therapy which has the most appropriate long-term benefit-risk ratio on aggregate level has to be preferred within the health- care system.) Comparing the drug policy tools with the sales data, we cannot draw general conclusions.
It means that the demand and supply side tools have significant impact on the generic competition on the aggregate level (for instance stimulating the spread of generic share) but has less effect in the development of the proportion amongst individual drug therapies in the same indication group. A factor that is recommend- ed to investigate in the future is the impact of clinical guidelines and clinical literature on physician decisions (including behavioral elements, i.e. awareness towards and compliance with clinical guidelines and literature).
In contrast with the above conclusions, in some cas- es we can detect significant market share despite high- er than average price levels. In the German market, the price of ramipril, which has a 72.1% market share and is considered to be clinically the most appropriate is high- er than the average price level of ACE inhibitors. The outstanding sales data of ramipril in the German mar- ket may have several reasons. From the clinical point of view, Ramipril is the preferred API in the ACE group, furthermore its price level is only slightly (2%) higher than the average price level. In German ramipril sales, country-effect may also play a role via visits by phar-
maceutical representatives. A more outstanding exam- ple compared to ramipril is the high level of perindo- pril sales, which is characteristic to several countries.
Perindopril has reached sales between 23% and 37.5%
in the Romanian, Hungarian, French and Dutch mar- kets despite its significantly high price level compared to the average (the range between +13.8 and +49.3%).
Zofenipril, the most exceptional example in this respect, has an 8% market share in the Italian market in spite of its 65.5% higher price, and 5.4% share beside a 164%
higher price in the Romanian market. This anomaly is attributable to the persuasive function of sales represen- tatives. Consequently the mentioned Consequently the mentioned country-of-origin effect could have a signif- icant impact on decreasing price sensitivity could have a significant impact on decreasing price sensitivity. This relationship should be analyzed in detail in the future.
Summary, Outlook, Limitations of the Research As a summary, the main goal of the recent study is to introduce a novel approach for the evaluation of the re- lationship between the pharmaceutical products’ clini- cal evidence (theoretically the main product feature for the patients and physicians) and their market perfor- mance. In theory, the better efficacy and safety profile should end up in higher sales in volume (DOT). As- suming that the active pharmaceutical ingredients can be ranked based upon their safety and clinical profile, the article analyzes the relationship between the clini- cal evidence and the market performance. The article briefly mentions further factors that have a significant impact on the analyzed relationship, but deliberately does not involve them in the analysis. There is one ex- ception, because the article touches the impact of the price level of drug therapies.
The analysis was performed on the market of an- ti-hypertensive drugs in 9 European markets. It can be stated in general when comparing ARB and ACE in- hibitor therapies that the clinically preferred ARB ther- apies were prescribed in the largest amount in France, in almost 50%. Based on the comparison of these two therapeutic groups, we cannot state that clinical ev- idence is the most dominant factor in the process of drug prescription. As a limitation, we must mention that ARB and ACE therapies are equivalent in terms of efficacy, ARB therapies’ superiority comes from their slightly-better side effect profile. This minor clinical difference is probably overshadowed by their higher price level. Nevertheless, we conclude that the ARB market share of lower-income countries (HU, PL, RO) lags behind that of the higher-income countries. A fur- ther result is that the countries involved in the study could be categorized by a well-defined 2×2 matrix.
VEZETÉSTUDOMÁNY / BUDAPEST MANAGEMENT REVIEW
The group of ACE inhibitors was analyzed more in-depths in the level of individual active pharmaceu- tical ingredients. Of the members of a five-grade scale, typically the active pharmaceutical ingredients ranked into the first and second category as per clinical evi- dence reach considerable sales. Analyzing the market performance of drugs it seems that clinical evidence may therefore play an important role in the decision making process of drug purchase. When introducing the results we also point out the determinative role of price level, emphasizing the experienced anomalies.
Beside the role of clinical evidence and price level, our data show country-of-origin effect-effect in the market of ACE inhibitors. In several cases this also explains the anomalies experienced by investigating the role of price level. Beyond the dominant role of product char- acteristics, the marketing activity of manufacturers has an obvious effect on the market performance of active pharmaceutical ingredients; however it was only men- tioned in a superficial manner.
A further limitation of our research is that it only involves one therapy group and was conducted in the prescription drug market. Therefore the available data do not allow us to make a general conclusion that can be considered valid for the whole pharmaceutical in- dustry. For general pharmaceutical investigations, we set four main research directions for the future: de- tailed investigation of the elements of the presented de- cision making pathway, the evaluation of the effect of the funding and reimbursement regulations, the effects of factors influencing the prescribing doctor’s deci- sion, emphasizing the detailed evaluation of the coun- try-of-origin effect, as well as extending the research to further indication groups.
Concerning the managerial implications, the in- troduced approach and the findings of the future stud- ies may be supportive for the better understanding of the purchase decision process. If the clinical ranking can be accepted as a general quality indicator for dif- ferentiating between the APIs, the effect of the ad- ditional significant factors can be compared between the countries more easily. This may help to design ge- neric portfolios for pharmaceutical companies. From the patients’ side an easy-to-understand tool could be also beneficial.
References
Azoulay, P. (2002): Do pharmaceutical sales respond to scientific evidence? Journal of Economics & Man- agement Strategy, 11(4), p. 551-594.
Backhaus, K. – Erichson, B. – Weiber, R. (2015): Fort- geschrittene multivariate Analysemethoden. 3. Au- flage, Wiesbaden: Springer Gabler Verlag
Barbu, A. (2012): Prescription at INN Level in Roma- nian Pharmacies: an Application of Latin Square Designs.
Berndt, E. R. – Bui, L. T. – Lucking-Reiley, D. H. – Ur- ban, G. L. (1996): The roles of marketing, product quality, and price competition in the growth and composition of the US antiulcer drug industry. in:
The economics of new goods. Chicago: University of Chicago Press, p. 277-328.
Bootman, J. L. – Townsend, R. J. (1991): Principles of pharmacoeconomics. Cincinnati, OH: Harvey Whitney Books
Borjádi Gy. – Juhász P. (2003): Marketingpirula recept nélkül. Budapest: Galenus Kiadó
Botz L. (ed.), (2014): A gyógyszerterápia bizonyítékokon és gyógyszeradatbázisokon alapuló értékelésének gyakorlata. Pécs: Pécsi Tudományegyetem
Botz L. – Szűcs F. (2008): A bizonyítékon alapuló orvoslás gyógyszerértékelési szempontjai és gyógyszerészeti vonatkozásai 1. Gyógyszerészet, 52, p. 67-71.
Botz L. – Szűcs F. (2008): A bizonyítékon alapuló orvoslás gyógyszerértékelési szempontjai és gyógyszerészeti vonatkozásai 2. Gyógyszerészet, 52, p. 195-200.
Busse, R. – Schreyögg, J. – Gericke, C. (2007): Ana- lyzing Changes in Health Financing
Arrangements in High-Income Countries. HNP Dis- cussion Paper, New York: World Bank
Chintagunta, P. K. – Desiraju, R. (2005): Strategic pricing and detailing behavior in international mar- kets. Marketing Science, 24(1), p. 67-80.
Cutler, D. M. – Berndt, E. R. (eds.) (2007): Medical care output and productivity (Vol. 62). Chicago:
University of Chicago Press
De Laat, E. – Windmeijer, F. – Douven, R. C. M. H.
(2002): How does pharmaceutical marketing influ- ence doctors' prescribing behaviour? Den Haag:
Deloitte (2015): 2015 Global life sciences outlook. Lon-CPB don: Deloitte Touche Tohmatsu Limited
Dylst, P. – Vulto, A. – Simoens, S. (2013): Demand-side policies to encourage the use of generic medicines:
an overview. Expert review of pharmacoeconomics
& outcomes research, 13(1), p. 59-72.
Friedland, D. F. (ed.) (1998): Evidence-based Medi- cine: A framework for clinical practice. New York:
Appleton and Lange
Greenhalgh, T. – Howick, J. – Maskrey, N. (2014): Ev- idence based medicine: a movement in crisis? BMJ, 348 doi: 10.1136/bmj.g3725
Gönül, F. F. – Carter, F. – Petrova, E. – Srinivasan, K. (2001): Promotion of prescription drugs and its impact on physicians’ choice behavior. Journal of Marketing, 65(3), p. 79-90.
Hamer, S. – Collinson, G. (2014): Achieving evi- dence-based practice: A handbook for practitioners.
Philadelphia: Elsevier Health Sciences
Hurwitz, M. A. – Caves, R. E. (1988): Persuasion or in- formation? Promotion and the shares of brand name and generic pharmaceuticals. The Journal of Law &
Economics, 31(2), p. 299-320.
Kaplan, W. A. – Ritz, L. S. – Vitello, M. – Wirtz, V.
J. (2012): Policies to promote use of generic medi- cines in low and middle income countries: a review of published literature, 2000–2010. Health Policy, 106(3), p. 211-224.
Kanavos, P. – Costa-Font, J. – Seeley, E. (2008): Com- petition in off-patent drug markets: issues, regula- tion and evidence. Economic Policy, July, p. 499–
Kanavos, P. – Schurer, W. – Vogler, S. (2011): The 544.
pharmaceutical distribution chain in the Europe- an Union: structure and impact on pharmaceutical prices. Brussels: European Commission
Kanavos, P. – Vandoros, S. – Irwin, R. – Nicod, E. – Casson, M. (2011): Differences in Costs of and Ac- cess to Pharmaceutical Products in the EU 2011.
IP/A/ENVI/ST/2010-12. European Parliament, Brussels.
Kenneth, A-B. – Lakhawat, P. S. – Chandra, A. (2016):
Review study on factors affecting the prescription pattern of Pgysicians. PharmaTutor, 4(4), p. 18-22.
Leeflang, P. S. – Wieringa, J. E. (2010): Modeling the effects of pharmaceutical marketing. Marketing Letters, 21(2), p. 121-133.
Leffler, K. B. (1981): Persuasion or information-the economics of prescription drug advertising. JL &
Econ., 24, p. 45.
Malhotra, N. K. (2010): Marketing research, an applied orientation, Harlow: Pearson
Manchanda, P. – Wittink, D. R. – Ching, A. – Cle- anthous, P. – Ding, M. – Dong, X. J. – Steenburgh, T. (2005): Understanding firm, physician and con- sumer choice behavior in the pharmaceutical indus- try. Marketing Letters, 16(3-4), p. 293-308.
Mizik, N. – Jacobson, R. (2004): Are physicians “easy marks”? Quantifying the effects of detailing and sampling on new prescriptions. Management Sci- ence, 50(12), p. 1704-1715.
Narayanan, S. – Desiraju, R. – Chintagunta, P. K.
(2004): Return on investment implications for phar- maceutical promotional expenditures: The role of marketing-mix interactions. Journal of Marketing, 68(4), p. 90-105.
Narayanan, S. – Manchanda, P. – Chintagunta, P. K.
(2005): Temporal differences in the role of mar- keting communication in new product categories.
Journal of Marketing Research, 42(3), p. 278-290.
Neslin, S. A. – Canadian Association of Medical Pub- lishers (2001): ROI analysis of pharmaceutical pro- motion (RAPP): an independent study. Canadian Association of Medical Publishers= Association des éditeurs médicale du Canada
Panteli, D. – Arickx, F. – Cleemput, I. – Dedet, G. – Eckhardt, H. – Fogarty, E. – Kaitelidou, D. (2016):
Pharmaceutical regulation in 15 European countries:
review. Health Systems in Transition, 18(5), p. 1-118.
Rizzo, J. A. (1999): Advertising and Competition in the Ethical Pharmaceutical Industry: The Case of Antihypertensive Drugs. The Journal of Law and Economics, 42(1), p. 89-116.
Rosenthal, M. B. – Berndt, E. R. – Donohue, J. M. – Ep- stein, A. M. – Frank, R. G. (2003): Demand effects of recent changes in prescription drug promotion.
Forum for Health Economics & Policy, Vol. 6, No. 1 Sackett, D. L. (1997): Evidence-based medicine. Semi-
nars in Perinatology, Vol. 21, No. 1, p. 3-5.
Scherer, F. M. – Ross, D. (1990): Industrial market structure and economic performance. University of Illinois at Urbana – Champaign's Academy for entrepreneurial leadership historical research refer- ence in entrepreneurship
Semark, B. – Engström, S. – Brudin, L. – Tågerud, S. – Fredlund, K. – Borgquist, L. – Petersson, K.
(2013): Factors influencing the prescription of drugs of different price levels. Pharmacoepidemiology and Drug Safety, 22, p. 286–293.
Sismondo, S. (2007): Ghost management: how much of the medical literature is shaped behind the scenes by the pharmaceutical industry? PLoS Med, 4(9), e286.
Spurling, G. K. – Mansfield, P. R. – Montgomery, B.
D. – Lexchin, J. – Doust, J. – Othman, N. – Vitry, A. I. (2010): Information from pharmaceutical com- panies and the quality, quantity, and cost of physi- cians' prescribing: a systematic review. PLoS Med, 7(10), e1000352.
Spence, D. (2014): Evidence based medicine is broken.
BMJ, 348, g22.
Thomson, S. – Mossialos, E. (2010): Primary care and prescription drugs: coverage, cost-sharing, and fi- nancial protection in six European countries. Issue Brief (Commonwealth Fund), 82, p. 1-14.
Venkataraman, S. – Stremersch, S. (2007): The debate on influencing doctors' decisions: Are drug char- acteristics the missing link? Management Science, 53(11), p. 1688-1701.
Vogler, S. (2012): The impact of pharmaceutical pric- ing and reimbursement policies on generics uptake:
implementation of policy options on generics in 29 European countries–an overview. Generics and Bi- osimilars Initiative Journal, 1(2), p. 44-51.
VEZETÉSTUDOMÁNY / BUDAPEST MANAGEMENT REVIEW
Vogler, S. – Österle, A. – Mayer, S. (2015): Inequalities in medicine use in Central Eastern Europe: an em- pirical investigation of socioeconomic determinants in eight countries. International Journal for Equity in Health, 14(1), p. 1.
Wallace, L. S. (2013): A view of health care around the world: The Annals of Family Medicine. 11(1), p. 84.
Werth, B. (2013): The Billion-dollar Molecule: The Quest for the Perfect Drug. New York: Simon and Schuster
Windmeijer, F. – De Laat, E. – Douven, R. – Mot, E.
(2006): Pharmaceutical promotion and GP prescrip- tion behaviour. Health Economics, 15(1), p. 5-18.
Winslow, R. (2000): Birth of a blockbuster: Lipitor’s unlikely route out of the lab. Wall Street Journal, 24.
Database
IMS Database (2016): IMS MIDAS data – Q4/2016 Appendix 1 – Clinical Bibliography
Abuissa, H. – Jones, P. G. – Marso, S. P. – O’Keefe, J.
H. (2005): Angiotensin-converting enzyme inhibi- tors or angiotensin receptor blockers for prevention of type 2 diabetes: a meta-analysis of randomized clinical trials. Journal of the American College of Cardiology, 46(5), p. 821-826.
Blood Pressure Lowering Treatment Trialists' Collab- oration (2000): Effects of ACE inhibitors, calcium antagonists, and other blood-pressure-lowering drugs: results of prospectively designed overviews of randomised trials. The Lancet, 356(9246), p.
1955-1964.
Chobanian, A. V. – Bakris, G. L. – Black, H. R. – Cush- man, W. C. – Green, L. A. – Izzo Jr, J. L. – Roccella, E. J. (2003): The seventh report of the joint national committee on prevention, detection, evaluation, and treatment of high blood pressure: the JNC 7 report.
Jama, 289(19), p. 2560-2571.
Consumer Health Reports (2011): Using ACE inhibiors to treat Heart blood pressure. Consumer Health Re- ports, USA
Furberg, C. D. – Wright, J. T. – Davis, B. R. – Cutler, J. A. – Alderman, M. – Black H. – ALLHAT Collab- orative Research Group (2002): Major outcomes in high-risk hypertensive patients randomized to an- giotensin-converting enzyme inhibitor or calcium channel blocker vs diuretic: the Antihypertensive and Lipid-Lowering Treatment to Prevent Heart At- tack Trial (ALLHAT). Jama, 288(23), p. 2981-2997.
Hansson, L. – Lindholm, L. H. – Ekbom, T. – Dahlöf, B. – Lanke, J. – Scherstén, B. – STOP-Hyperten- sion-2 Study Group (1999): Randomised trial of old and new antihypertensive drugs in elderly patients:
cardiovascular mortality and morbidity the Swed- ish Trial in Old Patients with Hypertension-2 study.
The Lancet, 354(9192), p. 1751-1756.
Julius, S. – Nesbitt, S. D. – Egan, B. M. – Weber, M.
A. – Michelson, E. L. – Kaciroti, N. – Schork, M.
A. (2006): Feasibility of treating prehypertension with an angiotensin-receptor blocker. New England Journal of Medicine, 354(16), p. 1685-1697.
Li, E. C. – Heran, B. S. – Wright, J. M. (2014): Angio- tensin converting enzyme (ACE) inhibitors versus angiotensin receptor blockers for primary hyper- tension. The Cochrane Library
Mancia, G. – Fagard, R. – Narkiewicz, K. – Redon, J.
– Zanchetti, A. – Böhm, M. – Galderisi, M. (2013):
2013 ESH/ESC guidelines for the management of arterial hypertension: the Task Force for the Man- agement of Arterial Hypertension of the European Society of Hypertension (ESH) and of the Europe- an Society of Cardiology (ESC). Blood Pressure, 22(4), p. 193-278.
Neal, B. – MacMahon, S. – Chapman, N. – Cutler, J.
– Fagard, R. – Whelton, P. – Blood Pressure Low- ering Treatment Trialists' Collaboration (2000):
Effects of ACE inhibitors, calcium antagonists, and other blood-pressure-lowering drugs: results of pro- spectively designed overviews of randomised trials.
The Lancet, 356(9246), p. 1955-1964.
Packer, M. – Poole-Wilson, P. A. – Armstrong, P. W.
– Cleland, J. G. – Horowitz, J. D. – Massie, B. M.
– ATLAS Study Group (1999): Comparative effects of low and high doses of the angiotensin-converting enzyme inhibitor, lisinopril, on morbidity and mor- tality in chronic heart failure. Circulation, 100(23), p. 2312-2318.
Powers, B. J. – Crowley, M. J. – McCrory, D. C. – Pen- dergast, K. – Posey, R. – Hadley, C. – Sanders, G.
D. (2012): Discussion, National Institutes of Health Siragy, H. M. (2010): Comparing angiotensin II recep-USA
tor blockers on benefits beyond blood pressure. Ad- vances in Therapy, 27(5), p. 257-284.
Sun, W. – Zhang, H. – Guo, J. – Zhang, X. – Zhang, L. – Li, C. – Zhang, L. (2016): Comparison of the effica- cy and safety of different ACE inhibitors in patients with chronic heart failure: a PRISMA-compliant network meta-analysis. Medicine, 95(6)
Wright, J. M. – Musini, V. M. (2009): First-line drugs for hypertension. Cochrane Database Syst Rev, 3(3)