DOCTORAL (PhD) THESIS
KAPOSVÁR UNIVERSITY
FACULTY OF ECONOMICS SCIENCE
Head of Doctoral School
Prof. Dr. Kerekes Sándor, Doctor of Science Supervisor:
Prof. Dr. Lentner Csaba, CSc.
Certain economic aspects of forced sales
- The rate of recovered amount correlated with the estimated market value of assets sold in liquidation proceedings -
Author:
Kapa Mátyás
Kaposvár 2017
DOI: 10.17166/KE217.003
2 1. Antecedents of the study, goal setting
Working first as a lawyer, then later as a bank employee specializing in claims management, I experienced that during the insolvency induced forced proceedings (liquidation execution), the creditors had to endure financial losses substantially greater than what would be deemed reasonable and acceptable. This practical experience spurred me to investigate certain economical aspects of forced liquidations.
In my paper, I wanted to examine first of all the proportion of the estimated market value of the properties realized during liquidation proceedings that goes toward actually satisfying the claims registered in the forced proceedings. Approaching the topic from a different angle, what percentage of the covering property is lost to the creditor, if said property is realized through liquidation proceedings. Based on my practical experience, I postulated that only a very small percentage of the estimated market value of assets realized during forced proceedings goes toward the actual satisfaction of the claim registered in the forced proceeding.
Based on the above I first tried to set up an empirical index number that demonstrates the proportion of the return on the originally expected purchase price of the debtor’s property sold during forced liquidation, that is, what percentage of the estimated market price went toward actually satisfying the insured claim („value return rate”). After defining the empirical index number, I tried to list the factors detrimental to the value return rate. I hypothesized that the value return rate relative to the estimated market price is deteriorated by the cost-distorting effects of the forced liquidation market, the characteristics inherent in forced liquidations, the incredibly high cost of forced liquidations, and the effect of autonomous interest structures of the parties involved in forced liquidations on the proceedings themselves.
I presented these factors in the paper, then investigated the possibility of measuring the degree of loss caused by the distorting effects. Finally I summarized my most important conclusions, and tried to formulate a few suggestions on improving the return rate relative to the estimated market price.
.
3
In the Hungarian literature – as far as I know – no such comprehensive study has been carried out so far. This of course, does not mean that the market parties would not be dealing with these questions. The financial institutes in the course of their crediting activity use assessment and reduction of risks, establishment of security policies, assessment of coverage and determining the liquidation value as tools in trying predict the return rate of forced liquidations. The Hungarian National Bank as part of its supervising regulative function also deals with the question of validating coverages. However, it could be said that the topic is not intensely researched in Hungary, despite the importance of the question from both a theoretical and a practical standpoint.
Adequate legal background is one of the important pillars of economy’s healthy operation.
The system of institutions on offer for the economy must not only create the possibility of continuing an enterprise, but must also provide effective mechanisms of rights enforcement. The realization of business security, the satisfaction of the demand for capital, the granting of credit for enterprises are all difficult to imagine in a legal environment where for example, the enforceability of a contract’s terms or the assertability of claims are not ensured.
It is probably needless to emphasize that the above described can be acutely true for a country like Hungary, where foreign investments are especially important for the economy, where the local entrepreneurial sector is traditionally lacking in capital, where a significant part of the population wishes to create homes from long term loans.
One of the important pillars of economy’s healthy operation is the acceptable assertion of claims. The low degree of forced liquidations’ efficiency is accompanied by several undesirable rippling consequences:
- generates chain debts, that stop active enterprises - causes termination of jobs
- results in tax proceeds shortage
- holds in and raises the price of crediting, which, in a country short on capital creates a decline of entrepreneurial activity
- the profits go to those involved in speculative deals, instead of those involved in the real economy.
4
Some of the above connections have been recognized centuries ago. The ministerial reasoning behind the 1881. LX article about the act of distress for example, indicated that the validation of claims „constitutes a well-known lever of trade credit stabilization, upon which great stress must be placed in a country especially deficient in funds”. At the same time, the indicators used to measure the economic competitiveness of countries takes substantially into account the working of the legal system, and especially the effectiveness of the law of bankruptcy. Thus, the effectiveness of the law of bankruptcy is a component of both the Business Competitiveness Index and the Global Competitiveness Index.
It is apparent then that the topic of the paper, the efficiency of forced liquidations has increased importance both from a micro economic and a macro economic standpoint.
Consequently, the goal of my research is to comprehensively present the efficacy of forced liquidations, and using it as a basis, to create an indicator that discerns the relationship of the estimated market price of movable and immovable properties sold through forced liquidations and the amount of the resulting proceeds that actually go toward satisfying the claim. Another aspect was to list and analyze the factors detrimental to the „value return rate” in comparison to the estimated market price. I aimed to present and dissect the indicated topic in such a way that the resulting paper presents practically useful conclusions, while also maintaining the harmony between the theoretical and the practical approaches.
The exact practical end of the research was to evaluate the efficacy of forced liquidations and by so doing, provide a sort of basis for enterprises and other legal entities when making market decisions during the validation of claims. In this regard, the paper endeavors to suggest alternative business practices that can be used in place of forced proceedings.
5 2. Material and method
The starting point for most studies is a review of the literature. Well, relatively few exact briefings can be gained from the economics monographs and articles in relation to the chosen topic, so during the preparation of the dissertation, I had to lean on practical experiences and my own empirical researches to a higher degree.
In my research I used a relatively large sample, I investigated and analyzed all together 720 successful sales of properties realized through liquidation proceedings during 2008 and 2013.
What interested me most during my research was the degree of the final sale price realized during the examined proceedings compared to the sold property’s estimated market price, and how much of the resulting amount went toward actually satisfying the creditor’s claim.
This examination was facilitated by the fact that the law requires organizations of forced liquidations to assess individually, with professional tools the „market price” and use that as the first official guiding price. In the XLIX act of 1991 about bankruptcy proceedings and liquidation proceedings (hereinafter Cstv.), the 49. § (1) paragraph makes it the liquidator’s duty to sell the debtor’s properties publicly and „at the highest current market price”. To do this the liquidator company (which by the way compulsorily employs an economist and an accountant) – based on the 225/2000 (XII.19.) government decree’s 5. § (3). paragraph’s a) section, and taking into account the opening balance established based on the C. law of 2000 about accounting – establishes with professional tools the individual market value/price of the properties to be sold. This will be announced as the first guiding price. During my investigation, I used this „estimated market price” as the starting point, and as the basis of comparison for the actually achieved sale price („the realized sale price”), and the amount that was truly spent on fulfilling the debtor’s claim („amount spent on satisfying the claim”).
Within the data that I collected, I first divided the achieved sale price of the property sold through forced liquidation with the estimated market price. Thus I obtained the „realized value rate” that shows, what percentage of the estimated market price is achieved by the realized sale price.
6
Following this, I carried out additional calculations, where I decreased the realized sale price with the cost of forced liquidations, and adjusted the estimated market price of the properties to the amount that went toward actually satisfying the creditor’s claim, thus obtaining the „value return rate”.
During the investigation of the price-distorting factors of forced liquidation markets, I carried out a relatively simple, questionnaire-based survey. I modelled a market situation that carries the characteristics of forced liquidation markets, and asked 470 potential customers about their behavior in the given circumstances. The questionnaire examined how much the price of a used item was affected by the number of those interested in said item and the desired goal of the potential customers during competition-type or auction- type sales.
The factors detrimental to the value return rate compared to the estimated market value – beyond the above – were examined in relation to exact case studies.
During the presentation of forming processes and the gathered data, besides a descriptive exposition, I tried to formulate critical observations.
3. Results
In order to offer an overview on the efficiency of the conducted asset sales in the liquidation proceeding an empiric survey has been carried out: altogether 720 successful asset sales were examined and analysed in the period between 1st January 2008 and 1st June 2013. In the sample different types of assets from various parts of the country were included. Here sales take place mainly through public tenders, and in exceptional cases through other advertisements. In every case the original guiding price of the asset intended for sale was sought based on court case number and the following facts were assigned to this: how much time and how many sales processes it took to perform the sale of chattel or realty, and for what amount these assets were sold eventually.
7
a) First, using the aggregated data from the examined liquidation proceedings, the total value of the estimated market price and the realised sale price, I conducted a regression analysis separated based on movable and immovable properties.
The regression calculation conducted with immovables resulted in a positive outcome, because the variables are suitable for the establishment of a regressive model, since the F- test is significant, the R and R2 values are both high. Likewise, it can be qualified as suitable based on the K-S test values, which surpassed the 0,05 mark. Regarding the modell’s parameters, although the constant value is not significant, but the original guiding price’s significance level is below the 0,05 mark.
Thus the regressive modell is the following: Expected sale prace = 0,368*Original guiding price-384.144. From the R2 value it can be percieved that out of 100 cases, approximately fit the line.
This level of connection was not demonstrable with movable properties, since the connection is weak between the original guiding price and the realised sale price.
b) Among the asset sales in liquidation proceedings I was primarily interested in how the realised sale price correlates with the estimated market value. Thus I set up a quotient where the realised sale price was divided by the estimated market value (guiding price) determined by the liquidator in unique and specific expert methods. This quotient can be called rate of realised amount in the sales process. In case of the estimated value, it was the guiding price during the first auction or public tender that was considered the base, regardless of a possible reduction in the price after a first unsuccessful sales attempt.
R R Square Adjusted R Square
Std. Error of the
Estimate Modell Sum of Squares df Mean Square F Sig.
Regression 214 656 589 054 007 000,00 1 214 656 589 054 007 000 884,840 ,000b Residual 41 483 515 292 624 000,00 171 242 593 656 682 012
Total 256 140 104 346 631 000,00 172 Unstandardi
zed Coefficients
Standardize d
Coefficients t Sig.
B Std. Error Beta
(Constant) 384144,020 1267867,892 ,303 ,762
,368 ,012 ,915 29,746 ,000
K-S teszt szig=0,23 Model
1
Eredeti Irányár
,915a ,838 ,837 15 575 418
8
The results received from the 720 examined asset sales are summarised in the following table and diagram.
Chattel Realty Total
Number of
elements
552 168 720
Minimum 0,051 0,033 0,005
Maximum 1,832 1,407 1,832
Lower quartile 0,333 0,253 0,315
Median 0,515 0,417 0,500
Upper quartile 0,641 0,535 0,618
Average 0,511 0,424 0,491
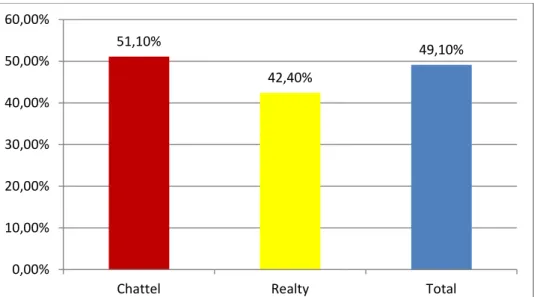
Table 1: Statistics of rate of realised amount achieved in the liquidation sales (based on the 720 asset sales conducted between 2008 and 2013)
Source: my own research, 2015.
Diagram 1: Statistics of rate of realised amount achieved in the liquidation sales (based on the 720 asset sales conducted between 2008 and 2013)
Source: my own research, 2015.
The data above shows that in addition to the relatively uniform distribution of the sample elements, the aggregate rate of value (rate of realised amount) is 0,491, the rate of realised amount of chattels is 0,511 and the rate of realised amount of realties is 0,424. This implies that the actual sale price achieved at the auctions in the examined period was 51,1% of the original estimated value in point of chattels and 42,4% in point of realties while concerning the aggregate data calculated on the basis of every asset sale this figure is 49,1%. The fact that the value of the median and the average is relatively close to one another shows that just about the same number of elements are located above and below the average.
51,10%
42,40%
49,10%
0,00%
10,00%
20,00%
30,00%
40,00%
50,00%
60,00%
Chattel Realty Total
9
c) The question may arise whether how the prolongation of forced sale affects the rate of the realised sale price and the estimated market value of the sold asset (rate of realised amount).
The analysis revealed that the rates of values (rates of realised amounts) achieved during the sales significantly differ from each other depending on the elapsed time. The conducted analysis of variance (by means of post-hoc test implemented by Scheffé’s method) clearly proved that if the sales process takes more time, the rate of value achieved during the sales (rate of realised amount) deteriorates.
The analysis of variance revealed that the rate of value achieved in the sale (rate of realised amount) shows a difference in the categories of different timespans in case of both chattels and realties as well as aggregate data.
d) During liquidation proceedings the liquidator makes the economic decisions, thus he has the opportunity to offer the debtor’s assets for sale either individually or collectively as a
„package”. The decision made in this phase may affect the group of bidders and – partly as a result of this – the achieved sale price.
I separately observed the rate of realised amount in case of individually sold assets and collectively marketed items, in this latter group those cases are involved where several different assets were offered for sale in a „package” and making an offer on them was only possible in combination. The reason to separately examine individual or collective sales of the assets is that during the two methods the liquidator’s decision, which is predominantly economic of nature, may significantly affect the marketability and the obtainable price of the asset. Thus the results gathered here will have a larger role in the chapter, where the effects of the profit oriented, from the creditor and debtor independent, primarily to the forced liquidation contributing third parties’ activities are investigated.
The results deriving from the sales of the 720 examined assets are summarized by the following table and diagram divided into individual and collective sales.
10 Individual
chattel
Collective chattel
Individual realty
Collective realty Number of
elements
384 168 106 62
Minimum 0,024 0,005 0,033 0,033
Maximum 1,500 1,832 1,407 1,317
Lower quartile 0,379 0,241 0,274 0,196
Median 0,539 0,470 0,415 0,432
Upper quartile 0,650 0,593 0,537 0,542
Average 0,538 0,449 0,430 0,415
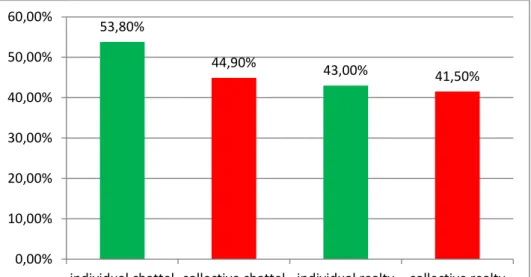
Table 2: Statistics of rate of realised amount achieved in liquidation proceedings broken down by individual and collective sales
(based on the 720 asset sales conducted between 2008 and 2013) Source: My own research, 2015.
Diagram 2: Statistics of rate of realised amount achieved in liquidation proceedings broken down by individual and collective sales
(based on the 720 asset sales conducted between 2008 and 2013) Source: My own research, 2015.
The figures above show that the rate of realised amount while selling either chattels or realties is less favourable in case of group sales. In the period under review the actual sale price achieved at auctions considering chattels is an average of 53,8% of the original estimated value when the asset was sold individually, while in case of collective sales this figure is 44,9% of the guiding price, i.e. almost 9% less. The same numbers respecting realties: 43% of the original estimated value in case of an individual sale, and 1,5% less, i.e. 41,5% when the real estate can only be purchased in a package.
e) From 1st January 2015 auctions and public tenders during liquidation proceedings are organized through electronic sales systems.
53,80%
44,90% 43,00% 41,50%
0,00%
10,00%
20,00%
30,00%
40,00%
50,00%
60,00%
individual chattel collective chattel individual realty collective realty
11
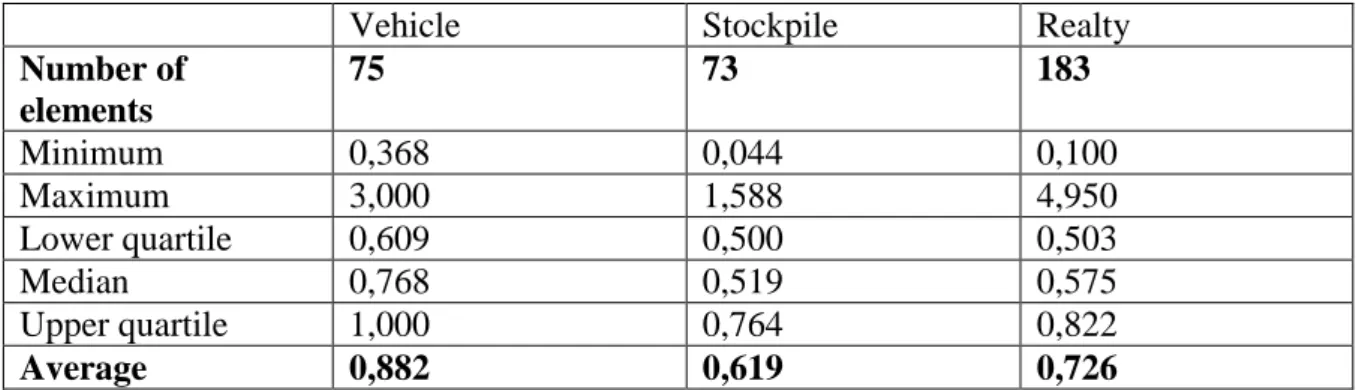
When comparing the rate of realised amount achieved in traditional and electronic procedures not only my research was at my service but also the survey conducted in 2015 and published in Koroseczné Pavlin Rita’s doctoral thesis entitled A felszámolási eljárás alá került hazai kisvállalkozások helyzetének elemzése. In it the author analysed 331 tender and auction sales performed by means of electronic sales system between 1st January 2015 and 31st July 2015.1 Comparing the results of the two surveys were somewhat difficult due to the following facts: first of all in her research Koroseczné Pavlin Rita did not correlate the realised sale price with the original estimated value but with the last guiding price immediately preceding the successful sale, furthermore she analysed chattels by dividing them into two groups, highlighting vehicles. The results of the analysed 331 asset sales are summarized in the following table.
Vehicle Stockpile Realty
Number of elements
75 73 183
Minimum 0,368 0,044 0,100
Maximum 3,000 1,588 4,950
Lower quartile 0,609 0,500 0,503
Median 0,768 0,519 0,575
Upper quartile 1,000 0,764 0,822
Average 0,882 0,619 0,726
Table 3: Statistics of rate of value correlated with the last guiding price achieved during liquidation proceedings
(based on the 331 electronic asset sales conducted between 1st January 2015 and 31st July 2015)
Source: The research of Koroseczné Pavlin Rita (2015)
In order to ensure the comparability of data, I carried out the following calculations.
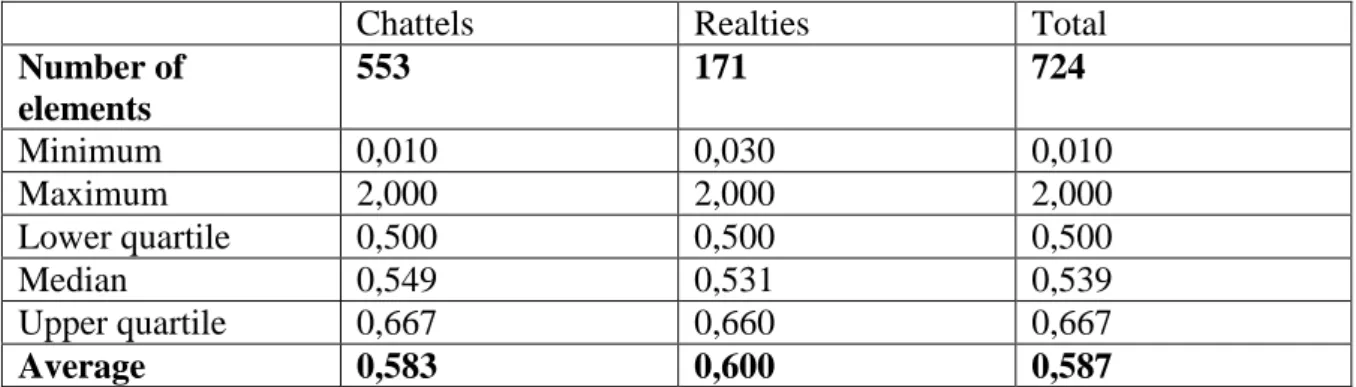
ea) From the figures of my own research, I made a series of data containing the rates of values correlated with the last guiding price (rate of realised amount)which is summarized as follows.
1 See: Koroseczné Pavlin, Rita – Kövér, György – Parádi-Dolgos, Anett: A vállalati vagyon értékének elemzése felszámolási eljárás során. In: Statisztikai szemle 2016/8-9., pages 918-924.
12
Chattels Realties Total
Number of elements
553 171 724
Minimum 0,010 0,030 0,010
Maximum 2,000 2,000 2,000
Lower quartile 0,500 0,500 0,500
Median 0,549 0,531 0,539
Upper quartile 0,667 0,660 0,667
Average 0,583 0,600 0,587
Table 4: Statistics of rate of value (rate of realised amount) correlated with the last guiding price achieved during liquidation proceedings
(based on the 724 sales of assets completed between 2008 and 2013) Source: My own research, 2015.
eb) From Koroseczné Pavlin Rita’s data I calculated the weighted average of the average rate of value of vehicles and stockpile, which became 0,752. The data received this way became comparable to the figures concerning chattels in my research. Then I calculated the weighted average of the average of all sales, the given number here is 0,738.
The basic descriptive statistical data gained by comparing the two surveys revealed that by the introduction of the electronic sales system, the rate of value of the realised sale price and the estimated market value of the sold asset indeed improved. In case of chattels this improvement was + 0,169, i.e. a sale price higher by 16,9% of the guiding price was managed to be achieved, in case of realties this number was + 0,126, i.e. a sale price higher by 12,6% of the guiding price was managed to be achieved and in case of overall data the figure was + 0,139, i.e. a sale price higher by 13,9% of the guiding price was managed to be achieved.
f) In order to reveal how much part, what proportion of the estimated market value of the sold asset may be appropriated for the satisfaction of the creditor’s claim, the realised sale price int he forced sale is needed to be reduced by the costs of the procedure.
As already mentioned, the mutual relation between the estimated market value of movable and immovable assets subject to the forced sale and the amount achieved in the sale and appropriated for the actual recovery of the claim is attempted to be made palpable by introducing a specific index number. This is the rate of recovered amount correlated with
13
the estimated market value of the asset which can be calculated by means of the following simple equation.
a = the sale price established based on the price of the last winning offer during the forced sale
b = the market value determined prior to the forced sale by estimation c = the total cost incurred and deducted during the forced sale
𝑋 =𝑎
𝑏× (𝑎 − 𝑐 𝑎 ) 𝑋 =𝑎 × (𝑎 − 𝑐)
𝑎 × 𝑏 𝑋 =𝑎 − 𝑐
𝑏
However, determining the total cost incurred and deducted during the forced sale – indicated by (c) in the equation - is not easy, since there is no itemised data on it in the proceedings.
As a consequence the total costs to be deducted (c) were calculated as a percentage of the achieved sale price by taking legal regulations and empirical evidence into consideration.
On the one hand this was justified by the fact that the fee of the liquidator is also charged this way, on the other hand based on the obtained lists of costs, this solution gave realistic opportunity to estimate the extent of costs.
The sum of the liquidator’s fee is usually 5% of the amount of income after the forced sale of the asset. In addition, numerous other costs and expenses emerge in the proceeding and legislative regulations enable to charge them. Such expenditures are, e.g., costs related to the safeguarding of assets, the sale of assets (appraisal, notary fee) and the fuel costs of using motor vehicles.
The sample I examined during my research revealed that 56,2% of the realised sale price was settled as disbursement.
14
By summarizing the costs projected onto the realised sale price: the expenses of the bankruptcy or insolvency proceeding during the liquidation proceeding consumed 61,2%
of the returns.
When projecting the resulting values onto the applied equation the refund correlated with the estimated market value of the asset (the rate of recovered amount) in the liquidation proceedings may be calculated.
𝑋 =𝑎
𝑏× (𝑎 − 𝑐 𝑎 )
(a) = the sale price established as winning offer during the forced sale (b) = estimated market value
(c) = costs of the forced sale
This formula may be applied in every unique proceeding by projecting the specific figures on it, however, here we aim to determine the overall data on all 720 asset sales in the entire timespan under review, therefore the values calculated above are used during the calculations as follows:
the quotient of (a) and (b) has already been calculated in 3.2.1 (see Table 1), its value is:
0,491.
the value of (c) derived on the basis of cost calculations in this 3.3 section fo the study is 0,612(a)
(a) – (c) = (a) – 0,612(a) = 0,388(a) the quotient of 0,388(a) and (a) = 0,388 According to the above:
X = 0,491*0,388 = 0,191
Based on the calculations above we can conclude that in the period under investigation (from 1st June 2008 to 1st June 2013) with respect to the examined sample (720 successful auction realised in the liquidation proceeding) the rate of recovered amount was 0,191 during the bankruptcy or insolvency proceeding. This means that only an average of 19,1%
of the sold assets' estimated market value is applied to satisfy the creditors' claims. In the creditor's point of view, the rest is vanished: the low sale price (being in contrast with the estimated value) and the costs of liquidation consumed it.
15
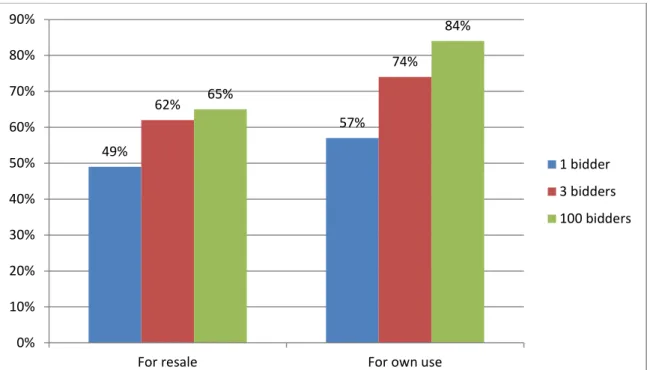
g) I created a relatively simple poll to prove that the peculiarities of forced sale markets really affect the obtainable sale price in a negative way. I modelled a market situation having the special characteristics of the particularities of forced sale markets, thereafter altogether 470 potential buyers were asked how they would behave under given circumstances. The created questionnaire examined to what extent the number of potential buyers interested in a used product and their intentions with the deal influence the price of the given product in case of auction or tender sales – assuming it is clear for all players that the seller must sell the offered product within a relatively short period of time.
In the poll I took the sale of an ordinary used asset, namely a car of 2 000 000 HUF value as a sample.
First I wanted to know how the subjects participating in the poll would behave if they would not need a car but had 2 000 000 HUF liquid capital with the intention of gaining profit by the investment and they would be aware that the seller needs to sell the vehicle by all means in a short time limit. Here I raised the question to the subject participating in the survey that as a potential buyer what amount he would offer for the car knowing that
a) he is the only person bidding b) 3 other people are bidding
c) a total of 100 other people are bidding.
After that I raised the question: How would the amount of the bid develop if the subjects would do the purchase under the same conditions except that they would buy the vehicle for their own use and they would possess the liquid capital correspondent to the market price as well. I converted the responses received to the percentage of the estimated market value (2 000 000 HUF). The averages obtained are depicted in Diagram 3.
16
Diagram 3: Buyers’ behaviour on forced sale markets (based on a survey questioning 470 people )
Source: My own research, 2015.
In case of a purchase with resale intention the potential buyers if they were the only bidders were willing to offer 49% of the market price for the product, while in case of having to more competitors this number was 62%, and along with 99 other bidders they would be inclined to pay 65% of the market price for the goods. In case of purchasing for own use, higher bids were offered. Here, being the only bidder, the potential buyers offered 57% of the market price, on a market having three bidders this rate was 74% and in case of 100 bidders they offered 84%.
4. Conclusions
As I mentioned above, an important pillar of the healthy operation of economy is the availability of efficient law enforcement mechanisms. In the lack of voluntary compliance the realisation of assets ultimately takes place within the framework of bankruptcy or insolvency proceedings. Such bankruptcy or insolvency proceedings are, for instance, enforcement proceedings and liquidation proceedings. Within the framework of such proceedings the funds necessary for satisfying the claim are partially attempted to be covered by marketing the debtor’s assets.
49%
57%
62%
74%
65%
84%
0%
10%
20%
30%
40%
50%
60%
70%
80%
90%
For resale For own use
1 bidder 3 bidders 100 bidders
17
The efficiency of forced sales fundamentally affects the effectiveness of realising claims thus having a huge influence on the operation of economy. If players of the market access their legitimate demands with difficulty or the rate of return correlated with the validated claim is low, it can have serious economic consequences.
Below I’ll attempt to list the paper’s – as I see it, most important - conclusions. Alas, proposals present here had to be sometimes inevitably lifted from their context from the previous pages, so I do encourage you, Dear Reader, to not be satisfied with the succinct conclusions in this chapter, but examine the complete study.
a) In the post regime-change era of Hungary, it is almost of no consequence which time period we examine, or the manner of indicators we set up for measuring the efficacy of forced proceedings, the indicators will always show enormous financial loss on the creditor’s side.
b) My research primarily examines the losses incurred during the forced liquidation of properties, by using an index number that discerns the relationship of the estimated market price of movable and immovable properties sold through forced liquidations and the amount of the resulting proceeds that actually go toward satisfying the claim.
c) In the process of forced liquidation, the return in comparison to the estimated market price deteriorates in two steps. First, when the final sale price is lower than the estimated market price, and second, when the costs of the forced proceedings are deducted from the purchase price.
d) Based on the conducted empirical research, the sale price of properties sold through forced liquidations compared to the estimated market price was 49, 1%.
e) According to my research the cost of forced proceedings take up 61, 2% of the purchase price.
f) Based on my empirical research, I was able to establish a value return rate, in correlation with the estimated market price, typical to liquidation. To determine this rate, the cost of the proceedings was deducted from the obtained sum (which I counted as the amount of
18
purchase price expressed in percentages) and the resulting total was then divided by the estimated market price.
g) The realized purchase price was, on average, 49,1% of the estimated market price, this number was then lowered further by deducting the cost of proceedings, which amounted to 61,2% of the purchase price. Thus 38, 8% of the 49, 1% of the estimated market price goes toward actually satisfying the claim. The resulting, value return rate in comparison to the estimated market price is 19, 1%.
h) I listed the value return rate compared to the estimated market price, the deteriorating factors during forced liquidations, I identified the following as such: the cost distorting effect of liquidation markets, the characteristics inherent to forced liquidations, the unreal costs of forced liquidations, and the effect of the autonomous interest structures of parties performing forced liquidations on the proceeds themselves.
i) I examined the characteristics of the forced liquidation market and arrived at the conclusion that this market has characteristics both on the supply and demand side, that affect negatively the final purchase price of the properties on offer. Such characteristics, on the supply side, are the incidental and hectic nature of the stock, the presence of less marketable wares, the heterogeneous supply, its composition is mixed in terms of both type and quality, the particular relationship between the seller and the buyer, resulting in the necessity of the sale and the condition that the information about the supply reaches the potential buyers through narrow, specific channels. The characteristics on the demand side are the lack of transparency, the negative attitude towards participating in forced liquidations, the relatively low number of participants, the resulting, special market structure that shows kinship with a demand oligopoly, the emergency situation of the seller causing an advantageous bargain position for the buyer, the special intentions of the potential buyers, who often place bids in order to acquire the margin between the property’s purchase price and it’s resale price.
j) My questionnaire, which modelled the market of forced liquidations, clearly proved my hypothesis that the above described characteristics of the forced liquidation market affect negatively the purchase price obtainable through forced liquidation.
19
k) I attempted to estimate the price distorting effects of the forced liquidation market, using the results of the questionnaire conducted with potential buyers. I set up three categories for certain factors of specific markets in terms of estimating the price distorting effects, and gave them index numbers. Based on my research, the fact of forced liquidation decreases the obtainable purchase price by 16%, the demand oligopoly’s (oligopsony) characteristics by 6, 5% and the resale intent by 9%. Consequently, taking into account only the price distortion of market characteristics, the average purchase price would be 68, 5% of the market price. At the same time, it is remarkable, that if we look at the results of the earlier presented empirical research, which showed the realized purchase price as 49, 1% of the estimated market price, then we can assume that other, separate factors deteriorate the purchase price with an additional 20% of the estimated market price.
l) I gave a detailed presentation of the forced liquidation methods, types of auctions. I pointed out that the auctions used in Hungarian forced liquidations are public auctions. In the course of a forced liquidation the liquidator has two choices when it comes to auction subtypes: the liquidator can organize an auction in the manner of English auction, or organize a public competition, a first price sealed bid auction. In order to reach the higher purchase price I suggested rethinking the sale methods used in forced liquidations. It is worth considering that in forced liquidations, along or instead of first price auctions, sealed second-price auctions could be made available. The need for change also arises in regard to the asking price and the minimal price. It should be considered on one hand that – if the option to bid below the asking price remains – the asking price should be defined above the estimated price. On the other, determining the minimal price individually, before every auction, without making it known to the potential bidders beforehand, and only disclosing it after the bidding phase has ended, may result in an increase of earnings. With the above measures, we could avoid offering the auction’s subject to potential buyers, at a determined percent of the estimated market price from the outset.
m) I presented a few typical shapes that the unreal (excessive, without legal base) costs of forced liquidations can take and suggested their rationalization and the provision of a wider judicial or creditorial supervision when inspecting these costs.
n) I pointed out that the value return rate compared to the estimated market price may be damaged by the activity of a profit oriented, from the debtor and creditor independent,
20
third party (i.e.: liquidator) involved in the forced liquidation: on the one hand with their economic decisions, on the other with the corruption arising in their activity. As a solution, I suggested here too the widening of creditorial and judicial control, as well as the inclusion of the creditor in economic decisions.
5. New research results
During the writing of this dissertation some of my original hypotheses were modified, the results spurred me to rethink a few of the questions and to formulate a few new ones.
Based on these, taking my research as the basis, we can draw up the following hypotheses and in connection with them, new and novel scientific results
Goal: The fundamental goal of the paper was to find out what percentage of the estimated market price of movable and immovable properties sold through forced liquidations as is spent on actually fulfilling the claim.
Hypothesis1: The realized purchase price obtained from selling assets in the course of liquidation proceedings substantially lags behind the estimated market price in the case of both movable and immovable properties.
Result1: The actual purchase price obtained from liquidation proceedings between 2008.
June 1. and 2013. June 1. based on the examined sample is with movables on average 51, 1% of the estimated market price, with immovables 42, 4%, while with all assets combined the total percentage is 49, 1%. (realized value rate expressed in percentages.)
Hypothesis2: During the course of the forced liquidations realized as liquidation proceedings, the realized value rate (the quotient of the realized purchase price and the estimated market price) decreased with the temporal protraction of the proceedings.
Result2: The analysis of variance showed in all cases of movables and immovables and the combined data that the realized value rate obtained through sale presented deviation in the different time categories, its value decreased as the duration of the proceedings increased.
21
Hypothesis3: The realized value rate presents better results if the assets are sold separately and worse results if they are sold as a group.
Result3: The realized value rate is worse both in the case of movables and immovables if they are sold as a group. The final purchase prices obtained during auctions in the examined time period is in the case of movables, on average 53,8% of the estimated market price, if sold individually, but if sold as a group, the percentage is 44,9%, almost 9% less, than the guiding price. In the case of immovables, the numbers are: 43% of the estimated market price, if sold individually and 41, 5%, that is, 1, 5% lower if sold as a group.
Hypothesis4: The introduction of an electronical marketplace causes an increase of the realized purchase price and the rate of the estimated market price, the realized value rate.
Result4: The introduction of an electronical marketplace caused an increase of the realized purchase price and the rate of the estimated market price. In the case of movables the improvement is + 0,169, that is the final price was better by 16, 9% than the guiding price, in the case of immovables, the improvement is + 0,126, that is the purchase price was better than the guiding price by 12, 6%, in the case of combined data, the improvement was + 0,139, that is the purchase price was better by 13, 9% than the guiding price.
Hypothesis5: The purchase price obtainable through auctions in the course of forced liquidations is distorted negatively by the characteristics of forced liquidation markets.
Result5: I was able to identify and verify several characteristics of the forced liquidation markets that negatively distort the purchase price obtainable at the auctions of liquidation proceedings. These are
a) Price distorting effects related to the fact of forced liquidations (on the supply side: the incidental and hectic nature of the stock, the presence of less marketable wares, the heterogeneous supply, its composition is mixed in terms of both type and quality, the particular relationship between the seller and the buyer, resulting in the necessity of the sale and the method of forced liquidations; on the demand side: lack of transparency and the negative attitude toward participation in forced liquidations)
22
b) Price distorting effects related to the oligopsonic market structure ( on the supply side:
the presence of a large number of insolvent legal entities, the condition that the information about the supply reaches the potential buyers through narrow, specific channels; on the demand side: the relatively low number of participants, who are aware that the sale is compulsory on the seller’s side)
c) Price distorting effects related to resale-motivated purchases (on the supply side: the incidental and hectic nature of the stock, the presence of less marketable wares; on the demand side: the special intentions of potential buyers, who often place bids in order to acquire the margin between the property’s purchase price and it’s resale price.
Hypothesis6: The costs of liquidation proceedings often decrease by an unwarranted amount the sum acquired through forced liquidations, that could actually go towards satisfying the claim, and thus substantially degrade the rate of the estimated market prices of the subjects of forced liquidation, the movable and immovable properties and the sum that is used to actually satisfy the claim (value return rate).
Result6: On the examined sample the value return rate of sales during forced liquidations is: 0,191. On average, 19, 1% of the property’s estimated market price went toward fulfilling the creditor’s claim. The amount beyond this is lost from the creditor’s perspective: it was consumed by the costs of the liquidation and low purchase price relative to the estimated market price.
23 6. Suggestions
The calculations conducted in this paper and the conclusions can serve as humble contributions to the theory when examining the price calculation of forced liquidations.
The results of the dissertation can contribute to the practice, by helping creditors make economic decisions and by assisting – while also considering economic aspects - the further improvement of the legal regulation of forced liquidation.
Trivial, but very important conclusion, that in the bankruptcy or insolvency proceeding the creditor shall count on a substantially smaller refund than the estimated market value of the underlying asset. Bearing this in mind, in an economic point of view any other solution is better from the creditor’s side to realise the claim than stepping onto the road of bankruptcy or insolvency proceeding and putting the asset in question on the forced sale market. Such solutions might be a debt settlement agreement (even by partially releasing the debt or by authorizing the debtor to sell the collateral asset on his own terms), the conversion of claims into asset the takeover of economic activity from the debtor or possibly creating a company for this purpose. Bankruptcy and insolvency proceedings and forced sales within them should be seen as ultima ratio. In this context forces sales have two roles. On one hand, the inevitability of legal consequence with serious disadvantage always influences the debtor’s willingness to perform in a good way and increases the probability of voluntary compliance. On the other hand, the quantified value of obtainable return in a bankruptcy or insolvency proceeding is a starting point for decisions on alternative strategies for case management.
In order to avoid the appearance of collateral assets on forced sale market and to be able to develop an appropriate case management strategy against an insolvent legal entity at an early stage, a special emphasis is need to be put on bankruptcy predictions. Early warnings about the potential risk of bankruptcy create the potential to make decisions minimising losses. Provided that the debtor is an economic organisation, numerous methods are at hand for this. In this phase mainly the analysis of data of annual financial statements and the evaluation of various index numbers provide opportunities. Here we should pay close attention to the fact that corporate management is a process and accordingly insolvency is the final outcome of a longer or shorter period characterised by financial problems. In reality efficient case management can only be ensured if the contract of the parties had
24
previously set specific options in case of the occurrence of insolvency emergency revealed by bankruptcy prediction. Thus it becomes clear that the completion of a transaction satisfying business needs requires complex and simultaneous economic and legal approach.
However, it can be a de lege ferenda suggestion for the legislation to rethink the sale methods used in forced proceedings, for example enabling sealed second-price auctions along or instead of first-price auctions; prescribing that the auctioneers, contestants must place their bids without knowledge of the defined minimal price. It may be necessary to rationalise the costs of forced liquidations, and to develop a wider judicial or creditorial control in order to supervise the economical decisions of liquidators.
25
7. Scientific publications written in the dissertation’s topic; educational publications;
lectures (conferences, symposiums, debates, sessions)
1. Kapa M: Ha az adós nem fizet.. (második, átdolgozott kiadás) HVG-Orac, Budapest, 2012. [263 p.] ISBN 978 963 258 154 5
2. Kapa M: Felelősség a közvagyonnal való gazdálkodásért – avagy jogágak véletlen találkozása a boncasztalon. In: Pénzügyi Szemle 2011/4., 471-480. old.
3. Kapa M: A kényszereljárások eredménytelensége – okok és következmények. In:
Gazdasági Élet és Társadalom. 2012/1-2., 98-107. old.
4. Kapa M: Dreptul insolvenţei şi instabilitatea economică în Ungaria. In: Radu Bufan – Lucian Bercea (coordinatori): Dreptul insolvenţei şi instabilitatea economică.
Bucureşti, 2013., 74-81. old.
5. Kapa M: Dilemmas regarding the Regulations on cross-border enforcement. In:
Gazdasági Élet és Társadalom. 2013/1-2., 172-181. old.
6. Kapa M: A kényszerértékesítések jellemző sajátosságai. In: Polgári Szemle 2015/1-3.
szám.
7. Kapa M.: Aukciók a magyarországi felszámolási eljárásokban. In: Polgári Szemle 2016/4-6. szám., 98-110. old.
8. Kapa M: Certain economic aspects of forced sales in Hungary. In: Moderni Veda (Modern Science) 2017/1., Prague (in press)