Editors:
Katalin S
ZENDRŐMihály S
OÓSLector:
Patrick A
LEXANDEREditorial office:
Kaposvár University, Faculty of Economic Sciences
H-7400 Kaposvár, Guba S. u. 40.
H-7401 Kaposvár, P.O.Box 16.
Tel.: 36-82-505-800, Tel./Fax: 36-82-526-593
Published and distributed by
Kaposvár University, Faculty of Economic Sciences H-7400 Kaposvár, Guba S. u. 40.
Printed by Central Press, 100 copies producted
ISBN 978-963-9821-62-0
May 2013
Kaposvár
C ONTENTS
S USTAINABILITY AND SOCIAL MARKETING
E XPERIENCE IT M ATH
S USTAINABLE DEVELOPMENT
S USTAINABLE LOCAL DEVELOPMENT STRATEGIES IN RURAL AREAS
L OCAL ECONOMY – LOCAL CURRENCY / L OKALE W IRTSCHAFT – LOKALES G ELD
P OSTERS
P APER S UBMISSION W ITHOUT
P ARTICIPATION
1 70 119 240
288
424
494
Se ssion
SUSTINIABILITY AND SOCIAL
MARKEITNG
Abstract
Slovak food industry has an important place in providing nutrition of the population, and the activities of agro-food complex in Slovakia. Essential element in providing most of the raw materials is Slovak agriculture. The main outlets for the flow of the vast majority of primary agricultural products are Slovak food industry. The success or failures of the food industry in the market are reflected on the marketing of foodstuffs in the domestic and foreign market. The food industry will be successful in domestic and foreign markets as the control and use marketing communication to meet the needs and demands of their existing and potential customers better than its competitors. The results of the food markets directly or indirectly affect retailers and economic success of all manufacturers, involved in food production, including primary agricultural producers.
Keywords: marketing, marketing mix, communications mix Introduction
The restructuring of the food industry in the Slovak Republic accepts the objectives of industrial policy. This is particularly the reduction of excess capacity and increase competitiveness. The food industry is scattered on the amount of production branches and each of them are different conditions, needs a starting point. To determine those aspects is needed in terms of long term maintenance of the market, marketing departments use to select the correct tools of marketing communication. The most specifically are: the personal selling, sales promotion, public relations, advertising and direct marketing. The current Slovak food industry does not belong to the sectors which we call the "strength" of the economy. It creates a relatively small share of GDP (gross domestic product). Food is closely linked to agriculture. The agro performs important functions. It provides download, storage and processing of agricultural products, manufactured food products and take part in the food supply of the population. It produces around 7-8000 kinds of products for the market needs. Including weight and quality range is about 10,000 kinds of products.
Departments of the food industry in Slovakia
In the first half of the 21st century, Slovakia became a major producer of passenger cars. Car manufacturing sector is the most significant share of the foreign trade of the Republic. At the same time we are observing increasing food imports. The performance of the Slovak agro sector declined and the country has become an importer of food and other agricultural products. In Table 1 we mentioned fields of food industry.
In this paper, we discussed one of the 15 branches food and beverage industries. Examining the situation, addressing current issues and proposals we have made in terms of an important malting
Table 1 Departments of the food industry in Slovakia Departments of the food industry in Slovakia
Meat Industry Brewing industry Starch factory
Industry milk and cheese production
canning industry Pomology
Milling and bakery industry Viniculture Freezers and fish processing Sugar industry Poultry industry Industry fats and edible oils distilled spirits industry Confectionery Manufacture of soft drinks and
mineral water bottling
Source: Potravinársky priemysel. *online+. *citované 23. 3. 2013+. Dostupné z:
<http://sk.wikipedia.org/wiki/Potravinársky_priemysel> *in Slovak+.
Brewing Industry
Brewing industry1 is providing in particular the production of beer and soft drinks. It processes and malting barley malt. Slovakia exports malt to 25 countries around the world. Slovak breweries and malt houses were in the second half of the 20th century built the world's production and technological level. Depending on the technology of production we recognize breweries classic barn, fully automatic with Saladin wardrobes and sliding piles. In several breweries were replaced outdated technology for fully mechanized, automated gradually. Important was the upgrading of sanitation facilities.
SWOT analysis of the company SLADOVŇA a.s., Michalovce
The production program2 is not stable. It varies depending on the market situation. Aggregation and disaggregation production are specific enough production plan, production schedule in shorter time periods. The main product of the company is manufacturing malt Czech (Pilsner) type, which is used to make light beer. Malt corresponds to STN 56 6610th It is made from purified and put out for malting barley soaking in of safe water, dipped barley germination and kilning3 at eradicating rootlets4. Strengths and weaknesses of SLADOVŇA a.s., Michalovce we stated in Table 2.
1 FELŠOCIOVÁ, E. 2011. Marketing malého podniku. Bakalárska práca. Košice: Podnikovhospodárska fakulta EU v Bratislave so sídlom v Košiciach. 2011. 60 s. E. č.: 24830000906. s. 38.
2 FELŠOCIOVÁ, E. 2011. Marketing malého podniku. Bakalárska práca. Košice: Podnikovohospodárska fakulta EU v Bratislave so sídlom v Košiciach. 2011. 60 s. E. č.: 24830000906. s. 30.
3 SLADOVŇA MICHALOVCE. Charakteristika sladu. *online+. *citované 23. 3. 2013+. Dostupné z:
<http://www.sladovna.sk/charakteristika-sladu.html> [in Slovak].
4 FELŠOCIOVÁ, E. 2011. Marketing malého podniku. Bakalárska práca. Košice: Podnikovhospodárska fakulta EU v Bratislave so sídlom v Košiciach. 2011. 60 s. E. č.: 24830000906. s. 45, 46. *in Slovak+.
Table 2. Variables SWOT analyses and company SLADOVŇA a.s., Michalovce
INTERNAL STRATEGIC FACTORS WEIGHT [%] STRENGTH VALUE
STRENGTHS
50-year tradition of manufacturing of malt 20 10 200
skilled workforce 20 10 200
modernized technology 20 8 160
built sub-contracting 10 8 80
production flexibility 10 8 80
quality certificate ISO 9001:2000, HACCP Certificate 20 10 200
TOTAL 100 % - + 960
WEAKNESSES
territorial distribution of sales energy 20 9 180
intensity of production
own brewery
20 9 180
small base of domestic customers 20 8 80
insufficient use of marketing communication tools 10 7 70
own brewery 15 10 150
high dependence on weather conditions 15 10 150
TOTAL 100 % - - 830
EXTERNAL STRATEGIC FACTORS WEIGHT [%] STRENGTH VALUE
OPPORTUNITIES
advantageous geographic position 30 10 300
growth in beer consumption in Eastern Europe 20 10 300
expansion of business activities 20 9 180
opening up new markets 10 9 90
use of EU funds 20 10 200
TOTAL 100 % - +1070
THREATS -
exchange rate movements 5 5 25
decline in beer consumption 20 8 240
increasing the price of beer 20 9 180
weather 20 10 200
competition policy 15 6 90
increase in transport costs 20 10 200
TOTAL 100 % - - 935
Source: own processing
Calculation: Strengths + Weaknesses = 960-830 = 130 points Opportunities + Threats = 1070-935 = 135 points
On Figure 1 we have illustrated the strategy for the company on the basis of SWOT analysis.
Figure 1. Graphical processing SWOT analysis of the company Sladovpa, a.s. Michalovce Source: own processing
The results of SWOT analysis allow companies to adopt an aggressive strategy. Strengths outweigh weaknesses and opportunities prevail over the threats. Joint Stock Company SLADOVŇA a.s., Michalovce should maintain this position as long as possible, this means strengthening good relations with suppliers and customers, to innovate and expand its portfolio in such extent required by customers.
Findings-marketing mix
The company promotes the current dynamically changing domestic and international markets. In terms of examining the individual elements of the marketing mix, we found the following.
The product and the raw material
Brewing malt is one of the most important export commodities, the agro-food Slovakia and the quality is Archon to world leaders. The company SLADOVŇA a.s., Michalovce produces world class malt, competitive product. The basic raw material for the manufacture of malt are bred varieties of two-row spring barley Malz, Ebson, Sebastian and Prestige, which are listed in the European catalogue of varieties and seeds. The full use of processing capacity of company means 40 to 45,000 tons of excellent5 malting barley.6
Geographically, Slovakia is above-average assumptions for the production of agricultural commodities. In financial terms, this is also interesting for commodity producers. Thanks to many years of methodological and organizational approach of SLADOVŇA a.s., Michalovce towards farmers and financial support incumbent supplier is to cover the need of whole barley purchased from primary producers in the vicinity of the company. Reliable partners include the Hungarian barley
5 Charakteristika sladovníckeho jačmepa. *online+. *citované 23. 3. 2013+. Dostupné na :
<http://www.sladovna.sk/charakteristika-sladovnickeho-jacmena.html>[in Slovak].
6 FELŠOCIOVÁ, E. 2011. Marketing malého podniku. Bakalárska práca. Košice: Podnikovhospodárska fakulta EU v Bratislave so sídlom v Košiciach. 2011. 60 s. E.č.: 24830000906. s. 45, 46. [in Slovak].
Strengths
Opportunities
960
1070
- 935 130
135
- 830
Weaknesses
Threats
growers. Bid, the quality of the products delivered and reputation among farmers decisive criterion for the selection of potential new supplier.
Transportation ordered barley is implemented contractual carriers - freight forwarding companies from Slovakia. Quality of delivery is reviewed at each sampling in the corporate lab. In the case of deficiencies found are given raw complaint. The timing of orders and receive the amount is variable, varies depending on the volume of production. The issue of buying raw material for the production of malt - barley and the associated logistics is the responsibility of the sales department of the company. The basic contract price is also added by bonuses. There are 2 of them. First one is in the form of so-called loyalty and second quantitative bonus. Precondition for their return was the conclusion of contracts for the supply even in the period before harvest and the fulfillment of the contractual quantity. In this way, the company strives to maintain its suppliers to encourage them to barley in the region and to increase its growing areas.
By-product
Byproduct of SLADOVŇA a.s., Michalovce is organic matter, which is actually a waste arising during malting. This waste is granulated and sold to farms, hunting associations, fish farmers around Michalovce City as animal feed, animals and fish.
Price
Company SLADOVŇA a.s., Michalovce does not have a fixed price list. The price of malt is subject of negotiating with buyers negotiating Director Business Unit. Price by-products, animal feed, animals and fish are consistent and regularly updated by supply and demand in the market. In recent years, the company is primarily to support the cultivation of barley in our region, a new system of remuneration of its suppliers.
Figure 2. Foreign buyers malt from Michalovce
Source: SLADOVNA MICHALOVCE. Odberatelia. [online]. <http://www.sladovna.sk/odberatelia.html>
Sales strategy of the company SLADOVŇA a.s., Michalovce is formulated for critical customers in different territories. Malt sales in 2012 were made in Poland, Hungary, Russia, and Romania. Smaller volumes are exported to Abkhazia, Moldova and Turkmenistan. Geographical distribution of sales of
Table 3. Rozdelenie exportu sladu spoločnosti SLADOVŇA podľa krajín
Country Percentage of Sales Country Percentage of Sales
Rumunsko 39 Turkménsko 6
Poľsko 37 Moldavsko < 1
Rusko 9 Abcházsko < 1
Maďarsko 8
Source: SLADOVŇA a.s. Michalovce – Annual Report Year 2011.
Manufacturing plant SLADOVŇA a.s., Michalovce pays its attention to the quality of the product in all parameters, it is important in determining the price of malt, but also to sustain the market. Modern technology, in which the company has in recent years invested considerable funds guarantee their top quality malt. The basic price of the product is determined on the basis of quality. In chart 3 we illustrate the evolution of the prices of barley and malt in the € 1 per ton in 2005 - 2011.
Figure 3. Development of average prices of barley and malt in the € 1 per ton in the years 2005-2012 Source: SLADOVŇA a.s., Michalovce
Place (location - location)
For the sake of identification of the production site with the consumer society malt is transported in closed vehicles. Malt is known for its strong hygroscopic properties. Transportation malt is competence in the sales department, specifically for logistics manager, which deals with the transportation of malt to the final customer. On delivery of your product and company SLADOVŇA a.s., Michalovce uses the services Forwarding companies. Quality Transportation is a significant part of the cost, because 99% malt production is exported abroad. This is reflected in the price of the product. The primary purpose is the guarantee of export sales of malt to final consumers, and within a specified time, quality and quantity.
Marketing communications in terms of company
Marketing communication in society is regarded as something "extra". The preparation of the communication mix is carried out according to the principles of residual budget. The quality and quantity of marketing communication tools used depend on the amount of available funds, the amount of which depends on the efficiency of the company. Even the company is making profits, capital requirements for the operation of a continuously growing. Marketing is the responsibility of the sales department of the Company.
Integrated marketing communication in business
At this point we may speak about an interconnection of contacts between sellers and buyers.
Between the seller and potential customers being sophisticated means of communication, which aims to attract and retain customers. SLADOVŇA a.s., Michalovce has a priority to retain existing customers, expand relationships with existing customers and constantly look for new ones. Be creative and flexible and to respond flexibly to customer requirements. Follow the sales process begins continuous customer care. They are based on new communication goals, where the decisive moment the customer. It is a continuous effort to retain current customers and, if applicable, needs to get a new one.
Advertising
The Company is governed by the quality standards HACCP and ISO 9001:2008. Compliance with these standards is a condition for cooperation of foreign buyers. Regular audits and inspections by customers and not allow a compromise on their standard. The company SLADOVŇA a.s., Michalovce in the ads works with advertising agency BUM studio. The agency produces for business promotional items, such as: pens, bags, shirts, desk calendars, caps, dozes (so called) sladovička etc. Means of advertising used by advertising agencies textiles, paper, metal and other non-metallic materials, colours and a clip.
The company uses the internet for advertising in the interests of visibility towards the target group. It addresses a wide range of people text, graphics, audio and video information in 3 languages targeted mainly business partners at home and abroad. Essential for visualization are both the blue and yellow paint (the colours of the company). The quality certificates obtained by the company declare the precise quality parameters of malt, barley current European price, terms of purchase knowledgeable suppliers and customers in their decision making. Multifunctional website allows also offer up to date information on agro-business environment and of course links to partners and contact services and Management Company at: www.sladovna.sk.
The company SLADOVŇA a.s., Michalovce uses for creating advertising service advertising agency BUM studio. The agency was selected because it was able to incorporate the basic idea that the company is the largest advertising its product quality. On Figure 1 we illustrated the different marketing communication tools and the extent of their use in society.
Legenda:
Personal selling Direct marketing Sales Support Public Relations Advertisement
Sales Promotion
The SLADOVŇA a.s., Michalovce produces a specific product, which is malt and by-products generated during its production. The SLADOVŇA a.s., Michalovce exports 99% of production, therefore, the customer generally abroad. It participates in exhibitions focused on the supply of goods. The aim of participation in exhibitions is to establish new business contacts. Company management and The SLADOVŇA a.s., Michalovce traditionally held a competition for the best MET worker and best worker during the calendar year. Companies express that only motivation is the way to achieve the best results. Evaluation of this competition is announced at the end of the year during the fest luncheon. Winners from the CEO traditionally take an interesting financial reward. The competition is a type of employee identification with the fundamental objectives of the company and its philosophy, which is manufactured in premium quality product. The company uses leaflets, which are located in the foyer of the company. On notice boards in the entrance vestibule, information for business partners of the results of buying and selling barley malt, technical requirements for malting barley grain, company history, its philosophy. Then there is the gallery of the best staff and news about the economy of production.
Public relations (public relations)
The most important marketing activity of the company is the regular annual meeting of the company's management with barley growers, which attracts a specialized companies engaged in the agricultural sector. Growers are aware of fertilization, crop rotation, soil preparation for sowing, application of chemical treatment and the like. The meeting is in addition to marketing and the nature of the methodological framework, which indirectly provides the necessary quality barley. The company SLADOVŇA a.s., Michalovce uses several techniques of Public relations. There are symbols for presentation of the corporate name of the company and its logo. Excludes the aesthetic building materials are the corporate and business forms. Company built the open space in front of green spaces, trees, modern, driveway for truck rental business partners and the like.
Personal selling
Personal selling the company SLADOVŇA a.s., Michalovce falls under Commerce Department. It is the most important tool used in marketing communications. Personal selling is practiced three sales managers led by commercial director in the sales department. Crucial personal selling in the company is orchestrated by Director General. Personal direct selling technique is carried out with all current malt customers’ who produce light beer abroad. The biggest customers are manufacturers of light beer in Poland, Russia and Romania. Representatives of SLADOVŇA a.s., Michalovce come for business negotiation with a specific offering quality parameters specified product - malt, presentation materials and other relevant documents which are necessary to conclude the contract.
Important to customer are requirements (i.e. quality, logistics, etc.). After the arrangement requirements of both partners the price is agreed. Contracts are signed at the beginning of the year.
These dealings are solely personal thanks to them and to secure the supplier - customer relationships. The management objective is to keep all the customers in this way.
Conclusion
Currently, the market is saturated with malt. For the company, it is difficult to place the product on international markets. The priority is to keep current customers and acquire new ones. We keep a customer so that he not only offer goods for which it is valid, but also an added bonus, a kind of added value that the goods are not looking at the competition, but still remained loyal customers of our malt. Concrete example - caramelized malt, which produced SLADOVŇA a.s., Michalovce, while, but occasional demand for malt satisfy this provision of outsourcing from other malt. Thus will not direct the customer to a competitor, but it will satisfy even beyond the standard trade. This is exactly the way such a company wants to keep partners, because it is fully aware that currently there is no
problem to produce a product, but place it a crowded market products. Key issues include the acquisition of personal sales orders. Search of potential customers; establish personal contact, obtaining the cooperation and strengthening relations form the basis for a future order. In achieving business success company SLADOVŇA a.s., Michalovce uses all five tools of marketing communication. The purpose of a comprehensive communication strategy is purposeful and systematic work in the field of marketing communications constitute company SLADOVŇA a.s., Michalovce as one of the leading Slovak exporters of malt.
References
ALLEN, K, 2008, Viral Marketing 100 Success Secrets : Secret Strategie, Buzz marketing Tips and tricks, and Interactive Marketing – 100 Simple Online Campaign Principles, Emereo Publishing, 2008. 152 s. ISBN : 978-1-9215-2337-3.
FELŠOCIOVÁ, E. 2011. Marketing malého podniku. Bakalárska práca. Košice: Podnikovhospodárska fakulta EU v Bratislave so sídlom v Košiciach. 2011. 60 s. E. č.: 24830000906. s. 38.FREY, P, 2011, Marketingová komunikace : Nové trendy, Praha : Management Press, 2011. 203 s. ISBN : 978-80- 7261-237-6. s. 77-80.
HLOUŠEK, K, 2010, Integrovaná marketingová komunikace : Začínejte od konce, In Fresh marketing, 2010. 15 s. ISBN : 1803-9197.
JAKUBÍKOVÁ, D, 2008, Strategický marketing- stratégie a trendy, Praha: Grada Publishing, a.s., 2008, 272 s. ISBN: 978-80-247-2690-8.
KARLÍČEK, M, a kol., 2011, Marketingová komunikace : Jak komunikovat na našem trhu. Praha : Grada Publishing, 2011. 224 s. ISBN : 978-80-247-3541-2.
LIESKOVSKÁ, V. 2002, Vybrané kapitoly z marketingovej komunikácie. Bratislava : Ekonóm, 2002, 256 s. ISBN : 80-225-1590-6.
MIHALČOVÁ, B. – BOBÁKOVÁ, V. – STRIČÍK, M. – ČEPELOVÁ A. 2004. Vybrané kapitoly z firemného plánovania. Bratislava: Vydavateľstvo EKONÓM, 2004. 244 s. ISBN 80-225-1782-8.
PŘIKRYLOVÁ, J, a kol., 2010, Moderní marketingová komunikace, Praha : Grada Publishing, 2010. 320 s. ISBN : 978-80-247-3622-8.
Zákon NR SR č. 147P2001 Z. z. o reklame.
Internet sources
SLADOVŇA a.s. Michalovce. História spoločnosti. *online+ *citované 26. 4. 2013+. Dostupné z :
<http://www.sladovna.sk/historia-nasej-spolocnosti.html>
SCHWARZ, L. Public relations na sociálních sítích není "job na doma", In marketing journal *online+, 2010. *citované 26. 4. 2013+. Dostupné z: <http://www.m-journal.cz/cs/public- relations/aplikovane-pr/public-relations-na-socialnich-sitich-neni-job-na-doma_s388x7018.html>
Abstract
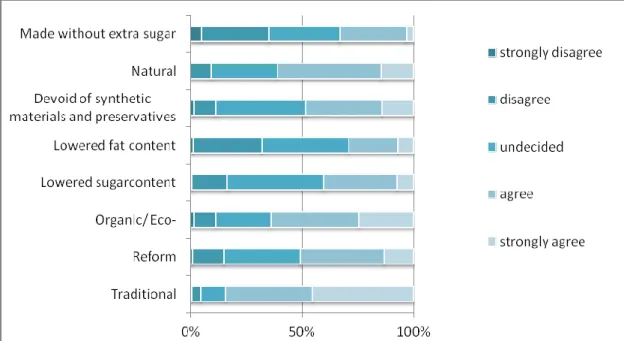
The rise of people on the top of the age pyramid provides a new potential from marketing aspects – a target group which is still not so “popular” today. In our study we will review the consumer behaviour of silver generation above the age 60. The health is a very important value for seniors thus we examined their attitudes and preferences from the way of healthy nutrition and organic foods. Our research was made in two steps – first a qualitative research by in-depth interviews (n=10) than a quantitative one by questionnaires (n=293). The respondents could be classified into 3 clusters according to their attitudes regarding to their lifestyle. The most “healthy” signal on food is
“traditional” for them. There is a significant relation between changes in health status and healthy eating. The net salary has an impact but the fall in prices is not a relevant factor on buying organic food.
Introduction
In our accelerated world the alcohol consumption habits of people are changing. New trends are emerging from time to time and people start to follow them. In Hungary such trend is the healthy way of life which has come into fashion. But is it a real trend? Or is it just a smart communicational trick of certain companies which want to increase the turnover of their products?! In my study I used the methodology of observation, one of the most typical methods of primary research and I wanted to answer the following question: Does the healthy lifestyle have a knock effect in the pubs of Győr?
The decline of the Hungarian state of health has started in the middle of the 1960’s and this has resulted that Hungary has dropped more and more behind the countries – first of all Western European countries – with developed healthy culture. The health status of the population is worse than it would be expected from the economic state of development of the country.
The extreme alcohol consumption, including the uncontrolled drinking of youths is an important social problem in Hungary. It is important to show that every maladjustment and every deviant behaviour is unclear for the environment. This problem always raises the questions – “Why is the person acting like this?” and “What does he/she feel while he/she acting like this?” These questions are often heard and if the fact turns out that even the person cannot explain his/her motivations, it can increases the lack of comprehension. Later the lack of comprehension can lead to the lack of understanding or negative prejudice.
Many factors have contributed to the extensive spreading of alcohol consumption. Some of these are the historical tradition, the consumption related to the nutrition and the application of it as
“medicine”. For long centuries the alcohol was the part of home pharmacies because as a vasodilator it is beneficial and alleviates the symptoms and as sedative it was used to relieve anxiety. Nowadays the view have spread again that the regular but small-scale wine consumption – especially of red
wine – can decrease the possibility of infarcts and the developing of malignant tumors. The marketing strategy of the alcohol industry is also based on this view, it points out the news and stories of the beneficial effects of alcohol.
It is also important to mention and clarify that today the approach which says that companies should meet the short-term requirements of consumers in the most effective way is exceeded in the modern marketing. The short-term needs (demands) of consumers often come up against the long- term interest of the costumers and of the society (state of health, improving quality of life, avoiding environmental pollution). All of these are particularly true in the case of youths. Today they think that it is natural that they can “make decision of their own life” and they almost feel offended if e.g.
they are not served with alcohol or tobacco. With other words, if they are restricted in their free self- determinations.
Nowadays the alcohol certainly has become the essential accessory of celebrations and being together in families and it has become a symbol of welfare and modern lifestyle in households. The factors that make alcohol really dangerous are: the wide range accessibility of it, the social acceptance of its consumption and the double standard of the society. While the relatively high purchase costs and the criminal judgment of drugs are blocking its spreading these factors have no effect on the spread of alcoholism.
Material and methods
The task of this research is to set an accurate data sequence up in connection with the health consciousness, alcohol consumption, smoking and healthy lifestyle of people who are living in my closer neighbourhood. The examination was arranged in several steps and it is going to have continuation in the next few years.
The marketing research has 2 types – primary and secondary research. The observation is one of the most typical techniques of primary research which can be defined as following: “The observation is a type of primary data collection methods when the researcher objectively observes and notices phenomena and facts in the interest of previously defined goals, with the help of methodically formed methods” (Sándorné, 1978). During an observation we can collect objective information about the characteristics of consumer behaviour, about the connections between seller and buyer, i.e. about the personal features which can be perceptible, visible and audible. This is why I chose the observation method for my study (contrary to use a survey) because I wanted to observe the consumers in their natural settings so I could get more opened and more real answer about their consumption habits. In this study I will demonstrate the results of quiet 100 visits.
The processing of data was made with the help of SPSS for Windows 14.0, a mathematical-statistical software program. In this program I studied the relations between variables and background- variables with frequencies and crosstabs. Beside calculations of means I made significance test using the Chi-square (Malhotra, 2001).
Results and discussion
According to the objectives of the research and to the above featured logic method I will present first the outcomes of the secondary and then of the primary research. At first we should make a summary about the health and heath behaviour and their factors. The good health status is not only the interest of an individual but it is the interest of the society, too because the individual as manpower is a very important part of the production system. That means that the preservation of an individual’s health is the essential task of the society.
Health behaviour/consciousness and its elements
There are many definitions of what the health exactly is and it is similar with defining the factors
According to HARRIS and GUTEN (1979) the health behaviour is every act which is carried out with the aim to protect and maintain our health without reference to our current health status and to the effectiveness of the certain act. The main elements of the health behaviour are demonstrated in the Figure 1.
Figure 1. The elements of health behaviour Source: Harris & Guten, 1979
Figure 1 shows that the health behaviour is such a complex system which parts are physical activity, psychic health, conscious nutrition, hygiene and avoidance of harmful goods (i.e. avoidance of abuse with e.g. smoking, drinking and drugs). Here can be mentioned the regular physical self-checking and the recourse of screening tests, too.
Alcohol consumption in Hungary and in the world
The alcohol consumption habits have changed a lot through the history. In the middle ages the consumption of beer and wine was wide-spread all over in Europe, even for breakfast. Tea, coffee and cocoa became part of the “menu of drinks” after the great geographical discovery, in Hungary rather in the 20th century. The technology of producing liquor has evolved through the findings of alchemists. The drinks and soft drinks made from fruits are the products of the second half of the 20th century (URL1). In Hungary, the regular statistical data communication of alcohol consumption exists from 1950’s but we have sparse and estimated data already from the 18th century. Probably the alcohol consumption had then already significant degree. On the score of these sources it is inferential that the alcohol consumption per capital and especially the consumption of raw spirit were similar like nowadays.
The drinking habits show a very varied picture in different countries of the world. Generally can be told that the cumulative welfare has changed the drinking habits in the developed Western European countries from the 1950’s which resulted that the number of alcoholics has risen, the alcohol consumption of teenage youths increased i.e. the alcoholism has become a serious social problem in a lot of European countries.
The Central Statistical Office studies the consumption of food, drinks, tobacco and nutriments per capital since 1990 in every year. Figure 2 shows the data of CSO.
32 34,8
23,6 6
84
72,6
7,1
11,7 9,8
0 10 2030 40 50 60 70 8090 100
1920-24 1950
1980 1990
1995 2000
2004 2006
2008 2009
Wine Beer
Spirits with 50% alcohol content All pure alcohol measured Figure 2. Alcohol consumption in Hungary (l)
Source: based on KSH data (1970-2009), 2008 created by the authors
The figure represents well that while the consumption of liquor and wine is stagnating, the consumption of beer shows some decreasing tendency. But on the whole the consumption of beer is changing only to a little extent and if we take into consideration that meanwhile the alcohol content of beer has increased, we can regard this decline as symbolic.
According to data from 2008 Hungary stands on the 24th place from the 35 studied countries in consumption of beer with consumption of 72.3 litre/capital/year (Figure 3). On the first place is the Czech Republic (149.9 litre/capital/year) which is followed with Ireland (124.8 litre/capital/year) and Germany (110.6 litre/capital/year). Among the last ones can be find Norway (55.6 litre/capital/year), Angola (55.3 litre/capital/year) and Brazil (54 litre/capital/year). The mean of consumption in the 35 examined countries was 86.8 litre/capital/year – the Hungarian consumption is under this mean.
Figure 3. Beer consumption of the world Source: (www.geog.ucsb.eu)
The Research Centre made a survey in Hungary among the regular beer consumers in 2010. Almost
beer. Women prefer to consume it with their partner, but among men the common beer consumption is typical with colleges and friends.
The Hungarian wine consumers buy mostly the measured wines. In Hungary around 3 million hectolitre wine is consumed per year, from this quantity 600 thousand hectolitre is consumed by the manufacturer and its family which means that they do not put it in commercial circulation. The origin of 1.6 million litre wine in kettle is not always verifiable moreover false wine was and is in circulation many times. The manufacturers urge the rise of quality wine consumption, so far with little success.
The most Hungarian buyers can pay only for the cheaper wine (KOPCSAY, 2001).
This contradict somewhat to the outcomes of the survey made by the Tourism public-company in 2005 which says that 49.1% of people consume bottled quality wine and only 10.8% declared that it happens to consume plastic bottled wine, 8.2% consume wine in kettle. According to the survey 81.6% of the adult population consume alcoholic drink with some regularity. From the alcoholic drinks most of the people consume champagne – 56.1% of the respondents said this type of drinks, 47.4% of people drink bottled beer (Figure 4).
8,2 10,2
19,5 19,9
24,3 25,8
29,3 30,3
33,2
47,4 49,1
56,1
0 10 20 30 40 50 60
Wine in can Wine in plastic bottle Put wine Coctail Brandy Table wine Vintage wine Other spirits Draft beer Bottled beer Bottled quality wine Champagne
Figure 4. The rate of consumption of alcoholic drinks
Source: By the Magyar Turizmus ZRt. / MÁST 2006 N=816 is created by the authors
Figure 5 shows the data of CSO (2009) about the repartition of wine, beer and alcoholic drinks per capital. In the structure of the alcoholic drink consumption of the population – measured in absolute litre – the share of beer has risen from 2005 and some from 2000, the significance of liquors has gradually increased while the share of wine has decreased with 5% point from 2000 and has become the third of the list.
33 36 31
34,5 33,6 31,8 27,9
36,7 35,4
0 10 20 30 40
2000 2005 2008
Wine Beer
Spirits
Figure 5. The share of wine, beer and alcoholic drinks per capital Source: By the data of CSO is created by the authors
Beside all of these we can notice that people’s alcohol consumption habits changed a lot, too. In the circle of drinking youths we can often see that contrary to the hard drinks the softer drinks with low energy content are more and more beloved, first of all because of the changing of lifestyle and the rising consumption of women. In the developed countries of the world people consume drinks increasingly in community by the rising of leisure time. So we can say that the so called social drinks are more beloved. Contrary to the cheapness and to the high alcohol and energy content the taste, pleasure value and quality of the drinks are more preferable for the consumers. Mainly the younger generations turn to use easily and rapidly likeable, so simpler products with worthless taste (URL2).
Since in my survey I observed the drink consumption habits of people in different drink seller places, now I would like to show some statistical data of how split the certain drink categories – measured in quantity – in the different catering establishments (Figure 6).
Figure 6. The split the certain drink categories – measured in quantity – in the different catering establishments between December of 2006 and November of 2007
On the score of these data can be said that more than 40% of the turnover of drink categories come to the places with low quality called volume places where we can find pubs, buffets, bars and buffets in workplaces. It is important to notice that the liquor are up represented in pleasure-grounds, i.e. in discos, in billiard rooms, in casinos. The biggest quantity of beer comes to the drinking places where pubs, good quality butteries are rated. The alcohol free drinks are consumed mostly in eating places (in restaurants, inns, café and confectionaries). According to the study I can say that more than 45%
of catering shops are volume places, the drinking places make 15% of the shop networks.
Analysing of consumption habits and attitudes (primary research)
The outcomes of the secondary research made it clear that the alcohol consumption means a serious danger among the population and that there are meaningful differences between the countries of the world in point of frequencies and quantities of the consumption. Hereinafter I will give summary of this research and of the outcomes.
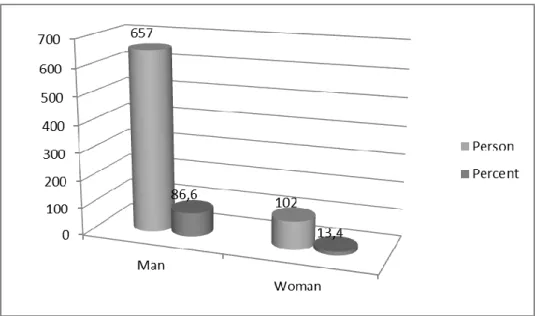
During the observation which biggest advantage is that we can observe the consumers in their natural settings I visited 47 pubs (but in this article I will demonstrate the outcomes of 33 observations). I turned in to the pleasure-grounds at random and I observed the people there 2 times. I spent around 25 minutes every time in these places where I took my observation as an external observer not without any problem because 2 times I was asked about what I am writing in my notices. During the research I analysed on the grounds of a forward planned aspect system and I recorded the observed results on the spot (that led to the mentioned inconveniences). 759 people stayed in the pubs during the 66 observations (Figure 7).
Figure 7. Proportion of people by gender in the pubs Source: Created by the authors
As we can see there were mainly with 86.6% men and the proportion of women was 13.4%. The proportion of the people under the age 20 was quite high with the number of 120, one reason of it can be that a place which is popular among the students too was an observed location but other reason can be that the youths like and often visit these – otherwise cheap – places. The number of girls under the age 20 was 17. The proportion of people above the age 60 is around the number of the previous group, it was 116 people. It can be stated that the visitors of pubs come particularly from the active (between the ages 20-60) population group.
Who has already visited pubs can agree with me and my statement that the visitors are not welcomed “with the best air” in many cases. The main reason of it is the smoke so the writer of this
article (and not I am the only one on the grounds of some conversations in these places) will support those efforts which are for the exemption of smoke in a pleasure-ground. According to the statement of the study the presence of smokers in pubs is not “over represented” because there smoked 241 person which is 31.8%. If we accept the data that states that 34-36% of adult men and 18-28% of adult women smoke I think – considering the proportion of genders in the pleasure-grounds - , the share of smokers is in accordance with the estimated statistical mean. It is evident that the mostly small and closed place consents to the fact that for the visitors of pubs seems the smoke there in many cases unbearable. It would deserve a study – and this is one of the goals of the writer of this publication – that do we smoke more during drinking as otherwise.
If people go to a pub it is evident that they want to drink and talk and pay the bills, too. In some cases they also give tip and some “lucky ones” get something the bill. In the following lines I will give a review about the outcomes of the research (in basic). In Figure 8 the average consumption of group of ages can be seen. This can be regarded as one of the delimitation of the research because from the data we cannot clarify the consumption of an individual. The observations of it can be an aim of another research. In point of the group of ages 14.8% of pub visitors in Győr are under the age of 20 which in my opinion is not a low value. Most of the guests are from the group of 21 between 60 ages.
29.7% of them are 21-40 ages, 34.5% of them are 41-60 ages. The rate of the older people is 21%.
Naturally, the observation can contain imprecision in point of the ages and of the types of alcohol (e.g. in the case of ‘nagyfröccs’” Spritzer big” and ‘hosszúlépés’ “Long Spritzer”) after all I think that the survey gives a correct summary.
Figure 8. Mostly consumed drinks Source: Created by the authors
The data of the figure show to us that in the observed places dominates the wine consumption. On the average one “fröccs” – ” Spritzer big” – (2 dl wine and 1 dl soda water) and nearly one “kisfröccs”
– Spritzer small – (1 dl wine and 1 dl soda water) are consumed by the guests of these places. The mean of the beer consumption is only 0.4 bottle which indicates that the consumption of this product is relatively low. But the proportion of the consumers of hard drinks can be considered high because from 10 groups of ages there are on the average 4 in which somebody consumes medium quality hard drinks. The red wine consumption which is regarded as healthier shows a low rate such as the soft drinks and the coffee.
If we analyse the consumption in divisions of age it will modulate a bit the structure of the
grows to 40% if we compare them with people above the age of 60. We can see similar rates if we consider glasses of beer. But it is depressing that the rate of medium and quality hard drink consumers is 5:1 (in this age group) which is more favourable and only 2:1 among people above 60 and between 21 and 40. Among people between 41 and 59 are in majority the quality hard drink consumers (rate 4:3). All of these data show that the mobility barriers have an important role on the market of consumer’s goods (as special food). Such mobility barriers are the brand choice and the brand names among other.
If we add to the above written facts (we are talking about the people under the age of 20) that from them are drunk 3 times more than the people from the other age groups. The smoke activity of them is also with 30% higher than the average of the other groups so we can say that this picture is really depressing. In point of smoking the youths are with 60% more active than people from the oldest age group. The visitors of pubs live a relatively steady life as it can be seen in the Figure 9.
0,075
0,020 0,037
0,017
20 years and under 21-40 years 41-59 years 60 years and over
Figure 9. Drunkenness (%) Source: Created by the authors
Analysing the data of the figure we can read the previous facts – in point of the drunkenness of youths. If we consider the “mean” than we can notice that “only” 3,5% of the guests are intoxicated in the pubs which I do not regard as a too high rate. My visitations also convinced me of the fact that the presence of drunks is not an often phenomenon (naturally take into consideration my subjective judgment). The distribution of the age groups shows (as I signed it before) that “the youths drink too much”, in their circle the proportion of drunks is nearly 8%. We can see a “good mean” if we consider the groggy people between the age 41 and 59 in the pubs. It is well seen in the figure that the oldest people take care of not to go home drunk.
To the tune of a little idea it is worthy to look the proportion of the non-consumers of a certain product. It can be squarely assessed that the consumption of “nagyfröccs” (it contains 2 dl wine and 1 dl soda water) is relatively fair because the proportion of non-consumer of the product is the lowest only 45%. The means of the groups show that 25.6% of them drink “fröccs” and the rate of those who drink from it with 2 glasses is 18.3%. The ratio of the non-consumer of “kisfröccs” (it contains 1 dl wine and 1 dl soda water) is 67%. 86% of the observed people do not consume red wine. This type of drink is typically consumed by the people above the age 41. 74.1% of the observed people do not drink bottled beer and these people are from all age groups. The youths drink usually 2 bottled beer but middle-aged people drink only 1 from this product. The rate of non-consumers of quality liquor is 73.2% and the rate of them in the case of hard drinks is 83.1%.
One of the central problems of the Hungarian economy is the “existence” of bill giving to the consumers which is in the focus of my study, too and I will give a summary of the outcomes of my observations in the Figure 10.
34 33 23,7
9,3
0 10 20 30 40
no yes occasionally only for foreigners
Figure 10. Bill giving (%) Source: Created by the authors
If I will characterize the data of the figure I will say that the fact of bill giving is not really working in the pleasure-grounds. There is no difference between the genders and the age groups. But the acquaintance is important. “We cannot know” – I heard this sentence when a waiter wrote the bill for a stranger and this fact is also supportable with my own experiences. Only in 33% of the observed pleasure-grounds were given bill regularly. In the most places (34%) were given no bills or just sometimes which I cannot understand – it is likely that the waiter did not know the buyer these times. When I turned into the same place in a short time or when I asked for another drink second time then I did not get the bill most of the time and I experienced the same when somebody else drunk his/her second drink and paid for the drinks. These facts are realized in the rate 9.3% of only for strangers and in the rate 33% of occasionally.
In connection with the bill giving it is practical to mention the issue of tip which distribution is showed in the Figure 11.
1,6
9,7 12,9
21 24,2
30,6
0 5 10 15 20 25 30 35
61-100 forint 41-60 forint 10 forint does not give 21-40 forint 11-20 forint
Figure11: The tip (%)
Source: Created by the authors
It can be determined that nearly 13% of the visitors of pubs give 5 or 10 Forint tip and they mostly drink one glass alcohol. It is also shown in the figure that main proportions 54% of the paying guests give little tip (and I personally state that this is between 10 and 40 Forint). 21% of the guests do not give to the waiter more money than the amount of their consumption. From 11 women 6 (more than 50%) and from 113 men 20 men did not give tip (during my observations I could observe the amount of tips exactly 124 times). The difference is significant. Nearly 12% of the observed people gave more than 40 Forint tip and from them 1.6% rate was who gave tip more than 60 Forint tip.
In 38% of the restaurants there was no television or it was not on. There where it worked there played mostly some kind of sport events – 22% of the times it was handball and 15% of the times it was football. In 14.5% of the pubs the guests saw some types of romance series, but many times the waitress was the most active watcher of these series. The rate of music was 8% and the rate of action film was 2% watched on the television.
References
Baum, A., Krantz, D. S., Gatchel, R. J.: An introduction to health psychology. McGraw-Hill, New York, 1997.
Harris, D. M., Guten, S.: Health protecting behaviour: An exploratory study. Journal of Health and Social Behaviour 20 17-29 (1979)
Kopcsay L. A borpiac szegmentációja, Nyíregyháza, MTN Konferencia, 2001. 10. 29. 235-238. p.
(2001)
KSH, STADAT (2009)
http://portal.ksh.hu/pls/ksh/docs/hun/xftp/stattukor/elelmfogy/elelmfogy08.pdf KSH: Statisztikai évkönyvei (1970-2009),
KSH: Egészségügyi statisztikai évkönyv 2008 KSH: stADAT-táblák – idősoros éves adatok
Magyar Turizmus Zrt. (2006) A magyar lakosság borfogyasztási szokásai, Turizmus bulletin, 2006/3.
12-15. p.
Malhotra, Naresh, K.: Marketingkutatás, Műszaki könyvkiadó, Budapest, 2001.
Sándorné Szennyessy J.: A piackutatás kézikönyve. Közgazdaságtani és Jogi Könyvkiadó, Budapest, 1978.
URL1: http://www.dolceta.eu/magyarorszag/Mod5/spip.php?rubrique43)
URL2: http://www.magyarvagyok.com/kultura/konyha/italok/bor/2738-A-vilag-ital-es-borfogyasztasi- szokasainak-valtozasa.html).
URL3: http://www.marketinginfo.hu/tanulmanyok/essay.php?id=1401 URL4: http://www.geog.ucsb.eu
Abstract
The aim of this article is to present a two-step analysis of a market orientation database about the Hungarian food processing small and middle sized enterprises (SMEs). There are two different scales describing the market orientation, the MARKOR and the MKTOR; we ascertain about their features if they are sufficient for the hypotheses of discriminative capacity and one-dimensionality. As a method for data analysis we used the structural equation modeling. After the calculations we state that one- dimensionality successfully fits from six features in case of five. We found that these features which are fitting to one-dimensionality have significant discriminative capacity.
Keywords: Market orientation, food industry, SMEs, SEM Introduction
The results shown in our presentation are parts of a research program that includes several steps, and the purpose of which is to form a market orientation model applicable for branch, small- and medium sized enterprises which handle the unique features of the marketing activity rooting from SME’s properties properly, but at the same time takes into account the branch specialities of food industry.
The research program consists of four steps. The first one was a nationwide survey carried out in 2009 with 100 dairy and meat industrial small and medium sized enterprises. Its aim was to map the general entrepreneurial practice and opinion about marketing. In the second step, in 2010 we investigated 250 agricultural and food industrial SMEs with internationally used standard questions about their experience about areas that have an influence on marketing activity. The third step is still being carried out at present and it deals with the spread of the research onto several countries. The questionnaires are being filled by Croatian food-industrial enterprises. The last step of the research is to create a market orientation model already mentioned in the introduction, which takes into account the characteristic of SMEs, and which is based on international results.
This current article investigates the applicability of MARKOR and MKTOR scales used in the second step of the research among the SMEs in Hungary.
The aim of the article was to examine the factors of the MARKOR and MKTOR scales, as well as the 49 variables constituting the factors in the database that consists of 168 items in the Hungarian food processing SMEs. The key questions were the following:
Can the three-three factors in the two scales be considered one dimension?
Does each factor have enough discriminating ability, that is do we have the right to separate the variables constituting the factors into three-three factors?
Theory
The idea of examining market orientation has a 50 years old history, but the importance of it was discovered in the last two decades first by Desphande and Webster (e.g. WEBSTER, 1981, 1992, 1994, DESPHANDE, FARLEY,1998, DESPHANDE, FARLEY, WEBSTER, 1993)
There are two different ways to define market orientation. SHAPIRO (1998) developed the decision making approach, which is about the dissemination of information that are important by company considerations. This theory says information should go through all functional fields in order to establish organizational commitment to decisions. To achieve it these decisions should be taken through functions.
DESPHANDE, FARLEY and WEBSTER (1993) are defining customer orientation as the opposite of competitor orientation. This approach is the customer oriented approach, which says the most important issue in a company’s life is the needs of customers.
The strategic approach by RUEKERT (1992) has the companies’ generation of intelligence ability in focus; it says that the aim of customers’ intelligence is for achieve company aims and for the most effective allocation of resources. The theory of market intelligence by KOHLI and JAWORSKY (1990) says the companies are collect and spread the critical information within the organization in order to maintain cooperation among functional fields. According to this the key elements of market orientation are the organization-wide generation of market intelligence, dissemination of the intelligence across departments and organization-wide responsiveness to it.
NARVER and SLATER (1990) considered market orientation as a culturally based behavioral perspective. The authors defined it as a cultural feature that affects to the employers’ behavior. They believe it is a corporate culture which evokes most effectively the proper behavior in order to create higher customer value and by so doing it, to create higher business performance.
Table 1. Market orientation models and their focus
Cultural focused Leadership focused
Desphande Narver, Slater Kohli, Jaworsky Shapiro Ruekert
Customer orientation
Customer orientation
Intelligence generation
Permeate corporate
functions with information
Generate customer information Competitor
orientation
Intelligence dissemination
Make strategy and tactical decisions
Develop strategy for customers Interfunctional
coordination
Responsiveness Execute decisions Implement strategy Source: MOLL et. al. 2007
Models that explain market orientation could be divided into two groups. The first group contains those which have cultural focus like MKTOR scale. The other one focuses on Leadeship approach like Jaworsky and Kohli scale and the MARKOR scale. There are several other scales but the MARKOR and MKTOR are the most widely used.
The questionnaire focusing on market orientation has 49 statements – 32 of them are about the MARKOR scale and 17 of them are about MKTOR scale. The responding companies had to answer by the use of a 5-point Likert-scale to decide how strongly they agree with each statement (1: Not at all like me, 5: very much like me).
The MARKOR scale was developed by Kohli and Jaworsky in 1990; in 1993 they revised it with the assistance of Kumar and they created the MARKOR scale with 32-statement (KOHLI, JAWORSKY and KUMAR; 1993). They thought the market orientation is defined by three main features: generation of
market intelligence, dissemination of the intelligence across departments and organization-wide responsiveness to it. From the 32 questions there are 10 questions about generation of market intelligence, 8 about dissemination of the intelligence and 14 about responsiveness. In the case of MARKOR scale it transpires that the responsiveness, namely the reaction to market changes defines the scale.
The generation of market intelligence is not just about the gathering and analysis of customers’
opinion and experiences. A company must generate information continuously from both micro- and macro environment, because for example competitors or governmental decisions also have their effects on it.
The point of dissemination is to help departments to work together and make them to provide assistance to each other and to the leadership.
The responsiveness means the adaptation rate of a company to the market changes.
The MKTOR scale was also developed in 1990, by Narver and Slater (NARVER, SLATER, 1990). It has just 17 statements also divided into 3 groups. There are 8 questions about customer orientation, 5 about competitor orientation and 4 about interfunctional coordination. By customer orientation a company tries to understand fulfill customers’ demand. It researches not just the present but the future demands too.
The competitor orientation focuses on present and future competitors and tries to assess their weaknesses and strength. After that the company should define its own strengths and weaknesses and then its own position.
The interfunctional coordination coordinates the company resources among different departures.
The possibility of application of MARKOR and MKTOR scales was examined by Farrel and Oczkowski (1997) among Australian companies. Their result states that these two scales with the 20 and the 14 features did not provide a statistically proofed three factor model. In order to apply the three factor model they had to reduce the number of those features (to ten and to eight).
Methodology
The methodology is shown divided into two areas, the methodology of data collection and data analysis.
The data were collected in the summer of 2010 with the help of the interviewer’s network of a Hungarian market research company. The places of the data collection were the seats of the enterprises involved into the research. Face-to-face interviews were made with the marketing leaders of the enterprises, or if they were not available, then the first leader of the company. During the research 250 assessable questionnaires were collected, 191 came from food industrial companies, and 59 from agricultural companies. In our present article we show the results of the food industrial enterprises, as the two sectors showed a significant difference. The composition of the sample accordingly to size categories is shown in Table 2.
Table 2. The composition of the research sample according to size categories in the food industry Number of employees Composition
Head %
0-9 people 136 71,2
10-49 people 42 21,9
50-300 people 13 6,9
Total 191 100
The questionnaire applied in the research contains 5 major groups of questions. In the first one the
innovativeness, company culture, HR policy, marketing tools and abilities, organizational learning). In the third part market orientation was analyzed with MARKOR and MKTOR scales. In the fourth part we put questions about the financial and non-financial productivity of the company, while in the last part the background variables got a place (seat, number of employees, legal form of the company, average market share, net annual income, annual balance-sheet and ownership structure).
The data were analyzed with the structural equation modelling (SEM) method. The SEM is suitable to make revealing analysis as well as to verify previous predictions. In the article the SEM method was used to fortify the applicability of previously constructed models, or to justify their refusal. From among the SEM program packages the AMOS 7.0 program was used because it conforms the SPSS statistical program and it applies SPSS database without data-transformations. The AMOS is suitable to create models in a simple and fast way as well as to visualize them graphically. The excel program was applied to define the probability of the Chi2 distribution.
In order to be able to use the applied mathematical-statistical method, we deleted those items from the database that contained missing values in any of the variables involved into the database.
Results and discussion
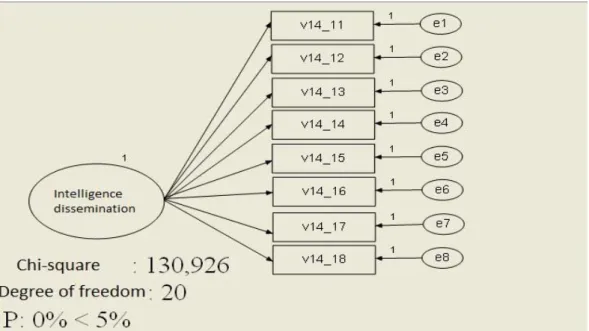
Hypothesis: The factors of MARKOR and MKTOR scales can be regarded as one-dimensional
The process of the one-dimensionality examination of the three-three factors of the two scales is shown trough the example of MARKOR scale’s “Intelligence dissemination” factor. In the database eight variables belong to the “Intelligence dissemination” factor, on Figure 1 the measured variables are the v14_11,…, v14_18 rectangles. If the factor can really be regarded one-dimensional, then a common factor determines them trough a regressional connection. The common factor is not expected to determine the total variance of the measured variable; this is why an error factor is linked to each variable. It belongs to the total identification of the model that the variance of the common factor and the regression weights belonging to the error factor must be given; in our case 1 is the suitable value.
Figure 1. The AMOS model for testing one-dimensionality. Factor: Intelligence dissemination
The obtained probability referred to that that hypothesis which the “Intelligence dissemination”
factor’s eight variables rely on a one-dimensional model must be refused. The correction of the model was solved by deleting the variables one after the other in it. The variable to be deleted was
chosen based on a matrix coming from the standardized differences of the covariance matrixes supposing (Table 4.) and not supposing (Table 3) a one-dimensional model.
Table 3. Covariance matrix without assuming one dimension model. Factor: Intelligence dissemination
Table 4. Covariance matrix with assuming one dimension model. Factor: Dissemination of information
From among the covariance-differences after standardization was chosen the value referring to the greatest difference. Based on this from the original – AMOS model which is suitable for testing one- dimensionality and which refers to the flow of information – model that variable was deleted where the Chi2 statistics showed the bigger fall.
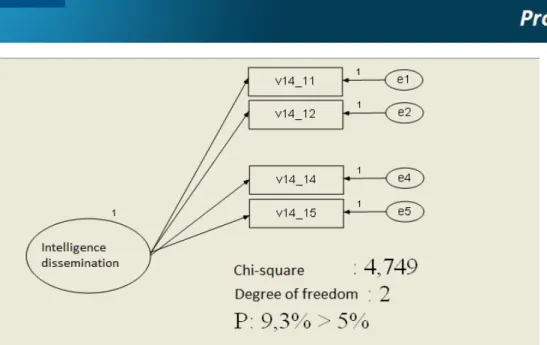
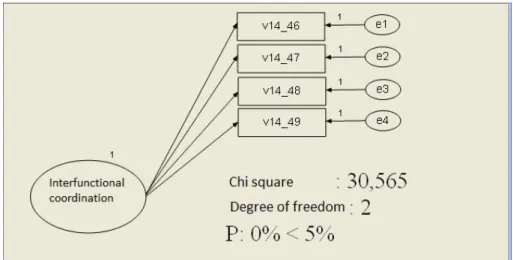
After deleting one variable a significance examination was also carried out on the decreased size model, after that other variables were deleted. Based on this theory in case of booth scales and in case of all their factor-groups the deletion process resulting in one-dimensional models was carried out. The results of the deletion process are shown in Table 6.
The AMOS defines a covariance matrix within a selected feature with two different methods. In the first case without assuming the one dimension model (Fig. 2); than assuming that the hypothesis, which says the factor variables fit to one factor model, is true (Fig. 3). We compare the results with Chi2 statistics (Fig. 1); the degree of freedom is coming from the number of the moments of model variables exceed the number of estimated moments. In this case the moments used by the AMOS are the different variances of variables and the covariance among them. The hypothesis for the validation of one dimension model is rejected if the calculated probability (P) is less than 0, 05.
The probability value on Figure 1. suggests that the hypothesis saying that the eight variables of
“Information dissemination” fit to the one dimension model, should be rejected.
The correction of the model is carried out by the deletion of the variables one after another. We can assume that the widely criticized scales developed in a totally different environment from the Hungarian are not entirely correct in the case of Hungarian companies. The scales behavior could be