R E S E A R C H A R T I C L E Open Access
Impaired early information processing in adult ADHD: a high-density ERP study
Szilvia Papp* , László Tombor, Brigitta Kakuszi, Lívia Balogh, János M. Réthelyi, István Bitter and Pál Czobor
Abstract
Background:Children with attention-deficit/hyperactivity disorder (ADHD) often demonstrate sensory processing difficulties in the form of altered sensory modulation, which may contribute to their symptomatology. Our objective was to investigate the neurophysiological correlates of sensory processing deficits and the electrophysiological characteristics of early information processing in adult ADHD, measured by the P1 event-related potential (ERP).
Methods:We obtained ERPs during a Go/NoGo task from 26 adult patients with ADHD and 25 matched controls using a high-density 128-channel BioSemi ActiveTwo recording system.
Results:ADHD patients had a significantly reduced P1 component at occipital and inferotemporal scalp areas compared to controls. The reduction was associated with inattention and hyperactivity symptom severity, as measured by the Conners’Adult ADHD Rating Scale. ADHD patients with higher inattention scores had significantly smaller P1 amplitudes at posterior scalp sites, while higher hyperactivity scores were associated with higher P1 amplitudes.
Conclusions:Deficits in early sensory processing, as measured by the P1 ERP component, are present in adult ADHD patients and are associated with symptom severity. These findings are suggestive of bottom-up cognitive deficits in ADHD driven by impairments in early visual processing, and provide evidence that sensory processing problems are present at the neurophysiological level in this population.
Keywords:ADHD, Early sensory deficit, ERP, Sensory modulation, Sensory processing difficulties
Background
Attention-deficit/hyperactive disorder (ADHD) affects around 3–6% of children [1] and persists into adulthood at a prevalence of 2.5% [2]. On the symptomatic level, ADHD is characterized primarily by inattention, hyper- activity and impulsivity [3]. While ADHD symptoms and their consequences were thought to diminish when reaching adulthood, deficits are often persistent [4], lead- ing to impaired health-related quality of life of adult ADHD patients [5,6].
Research of childhood ADHD suggests [7] that besides these core symptoms, ADHD may also affect sensory
processing (i.e., the ability of the central nervous system to collect, process and organize responses to sensory in- formation) and sensory modulation (the ability to regulate the degree, intensity and nature of responses to sensory input) [8, 9], in the form of higher sensory dysfunction (measured by both rating scales and by physiological reac- tions to stimuli [7, 10]. Sensory processing problems are severe enough in every sixth child with ADHD to have a negative impact on their everyday life [11]. Even though difficulties arising from altered sensory modulation are be- lieved to adversely affect core ADHD symptomatology, the distinct pattern of sensory processing deficits in ADHD patients is yet to be described [12].
To gain insight to the neural mechanisms associated with symptoms of psychiatric disorders, including ADHD, electro-encephalography (EEG) and event-related potentials
© The Author(s). 2020Open AccessThis article is licensed under a Creative Commons Attribution 4.0 International License, which permits use, sharing, adaptation, distribution and reproduction in any medium or format, as long as you give appropriate credit to the original author(s) and the source, provide a link to the Creative Commons licence, and indicate if changes were made. The images or other third party material in this article are included in the article's Creative Commons licence, unless indicated otherwise in a credit line to the material. If material is not included in the article's Creative Commons licence and your intended use is not permitted by statutory regulation or exceeds the permitted use, you will need to obtain permission directly from the copyright holder. To view a copy of this licence, visithttp://creativecommons.org/licenses/by/4.0/.
The Creative Commons Public Domain Dedication waiver (http://creativecommons.org/publicdomain/zero/1.0/) applies to the data made available in this article, unless otherwise stated in a credit line to the data.
* Correspondence:papp.szilvia@med.semmelweis-univ.hu
Department of Psychiatry and Psychotherapy, Semmelweis University, HU1083, Balassa utca 6., Budapest, Hungary
(ERPs) are commonly employed. Due to its high temporal, and - with high-density EEG–good spatial resolution, EEG offers a detailed understanding of specific cognitive dysfunctions.
While current research focuses mainly on the later timeframe of information processing, the presence of ADHD is thought to affect not only the top-down atten- tional selection but also the early, bottom-up sensory processing [13,14]. Generated in extrastriate visual areas [15], ERP components P1 and N1 represent the early stages of perceptual processing. The P1 component (la- tency 80-150 ms) has traditionally been associated with basic visual processing and spatial attention, along with data supporting the ‘sensory gain control/amplification’
hypothesis that attention directed to the location of the stimulus (inside the receptive field) is associated with in- creased amplitudes of the P1 and N1 components [16,17].
Electrophysiological evidence to the ‘capacity theory’ sup- ports hypotheses which connect perceptual load to early spatial selection in visual processing, namely that spatial se- lection is directly dependent on perceptual load [18].
In case of children with ADHD a reduction in the P1 component has been demonstrated using a wide range of paradigms including oddball [19–21], stop-signal [22]
and CPT (continuous performance task) tasks [23, 24].
In their visual cued CPT study of children with ADHD, Nazari et al. [24] demonstrated a decreased P1 ampli- tude in ADHD patients in the NoGo condition as com- pared to their control peers, suggesting an early deficit in visual sensory integration. EEG data were collected from 64 surface electrodes, peak amplitudes for P1 were measured at 3 occipital electrode sites. The source of P1 was localized to the occipital area by the swLORETA (standardized weighted low resolution electromagnetic tomography) method. Nonetheless, the results overall re- main controversial, with some of the research groups [25–28] finding insignificant differences between (child- hood) ADHD and control groups regarding the P1.
In the adult ADHD literature, Woltering et al. [29] in their dense array electroencephalography Go/NoGo study of 54 college students with ADHD and their typic- ally developing peers did not find group differences between patient and control groups regarding the P1 component. This finding could be attributed to the rela- tively low perceptual processing demands of the para- digm, and may not generalize to other, more demanding tasks [29]. In a 64-electrode EEG setting, Raz and Dan [30] found higher P1 amplitude in the adult ADHD group at occipital and posterior-parietal scalp locations in response to both happy and angry faces, which may reflect specific hyper-vigilance in the visual cortex of adult ADHD patients to emotional faces. However, in the neutral emotional valence setting (response to neu- tral faces), no such difference was found between patient
and control groups. Taking these results together, in the present study we focused on the NoGo trials as we wanted to increase the perceptual load and thereby the assay sensitivity for detecting a group-difference, because we expected that the basic visual processing and early spatial selection is more impaired when the perceptual load is high (as during the NoGo trials in a Go/NoGo task, where the prepotent response tendency is high).
With high-density EEG, due to its excellent time- resolution and topographical information on the whole scalp area, it is possible to gain a more detailed insight into the early sensory (‘bottom-up’) processes. In the current study, in addition to focusing on the region of interest electrodes that were predominantly examined in prior studies, our main goal was to conduct a detailed topographical analysis of the early processing of the sen- sory information in adult ADHD patients and healthy controls based on high density (128-channel) EEG re- cordings. Previous research which examined the topo- graphical distribution of early ERP components in ADHD patients either relied on sparse spatial sampling, or used a lower number of electrodes. However, as shown by Srinivasan et al. [31], ‘ … there does not ap- pear to be a clear asymptote in the scalp topography when the 128-channel data are compared with 64- channel recordings. Instead, there are many examples in which the 128-channel maps show a striking in-crease in topographic detail.’ Additionally, as indicated by the studies of Song et al. [32] and Freeman et al. [33], accur- acy of EEG spatial frequency representation over the scalp can be substantially augmented by increasing the number of electrodes from 64 to 128.
Given the limited and somewhat controversial and methodologically diverse ERP data on adult ADHD, this study with its Go/NoGo paradigm previously success- fully used in functional imaging studies [34, 35] aims to provide a detailed investigation of the early sensory stages of information processing reflected in the P1 component. Based on previous literature of childhood ADHD [19–24] we expected that P1 would be affected in adults with ADHD as well, with a lower observed P1 amplitude in ADHD patients.
Methods Participants
Fifty-one subjects participated in the study, including 26 adult ADHD patients and 25 healthy control subjects.
Healthy controls were matched to the patients on age (±
5 years), gender and level of education. Control subjects were excluded in case of neurological or psychiatric history.
In control subjects, the absence of a current psychiatric condition was confirmed with the Symptom Checklist 90R (SCL-90R) [36]. No control subjects were excluded based on SCL-90R scores. Patients participating in the study were
diagnosed with ADHD persisting into adulthood by an ex- perienced psychiatrist based on a detailed clinical interview.
The interview consisted of the following steps: structured interview for assessing current and (retrospective) child- hood DSM-IV-TR ADHD symptoms; semi-structured and open interviews assessing background information, devel- opmental data, functional impairment, psychiatric comor- bidity; medical history data obtained from medical documentation and close family members; and finally, a wide range of self-rated questionnaires including the Con- ners’Adult ADHD Rating Scale–Self-Report: Long version (CAARS; 66-item, self-reported and long version [37]. All patients met the DSM-IV-TR diagnostic criteria of adult ADHD (16 combined subtype, 3 hyperactive subtype, 7 in- attentive subtype) [38]. A subset of patients (n= 9) was on methylphenidate medication monotherapy, three patients were receiving bupropion (one on monotherapy, one on antidepressant combination, one combined with methyl- phenidate) while fourteen patients were medication-naive.
ADHD patients on stimulant medication were required to go off their medication 24 h prior the EEG session. The study complied with the ethical standards of the Declar- ation of Helsinki, and received approval from the Ethical Committee of Semmelweis University. All participants gave written Informed Consent for the study.
Stimuli and procedure
Participants were seated in a dimly lit room; a computer screen was placed at a viewing distance of approximately 50 cm. The applied Go/NoGo paradigm was previously used and described by Durston et al. [34]. In accordance with the original study, characters from the Pokemon cartoon series were used as visual stimuli. The experi- ment was programmed and presented with the Presenta- tion 13.0 software (Neurobehavioral Systems, Inc.).
Participants were instructed to respond as quickly and accurately as possible by pressing a button upon the ap- pearance of Go trials; they were, however, asked to with- hold response in case of rare NoGo trials. The task consisted of 5 runs. Pictures were presented for 1 s with an interstimulus interval of 3 s. Runs consisted of 57 pic- tures, of which 75% were Go trials, and 25% were NoGo trials. During the task, different types of NoGo trials were presented, NoGos were preceded either by 1, 3, or 5 Go trials. Foil trials (NoGo trials after 2 or 4 Go trials) were also administered to prevent learning; however, those were not included in the analysis. The different types of NoGo trials were pseudorandomly presented.
Clinical measures
ADHD symptom severity was described by the Conners’
Adult ADHD Rating Scale-Self-Report: Long Version (66-item, self-reported version) across core psychopatho- logical domains of ADHD: inattention, hyperactivity,
impulsivity and problems with self-concept [37]. The total score on the SCL-90R was used to measure the se- verity on general domains of psychopathology. Based on the original criteria, a global severity index of > 114 on the SCL-90R was considered high risk for a psychiatric disorder [36,39].
EEG recording and preprocessing
EEG was recorded using a 128-channel active electrode system (BioSemi ActiveTwo). The electrode cap covered the whole head with an equidistant-layout. Eye move- ments were monitored by two electrooculogram (EOG) electrodes placed below the left and above the right ex- ternal canthi. Data were digitized at a sampling rate of 1024 Hz, with a band-pass filter of 0.5-70 Hz using the BioSemi recording system with average reference. Data were stored and analysed off-line subsequently using the Electromagnetic Source Signal Imaging (EMSE) Suite as well as the Statistical Analysis System (SAS 9.4) software.
Artefact rejection, including the exclusion of eye move- ment artefacts based on horizontal and vertical EOG, and subsequently the exclusion of epochs with a voltage exceeding ±90μV on any EEG or EOG channel was con- ducted applying automatic artefact rejection criteria. For stimulus-locked ERP, epochs of 900 ms duration from 100 ms prestimulus to 800 ms poststimulus were ex- tracted from the continuous EEG. The -100 ms time- point was selected in order to establish pre-stimulus baseline, while the 800 ms post-stimulus timepoint was chosen to cover most of the stimulus presentation period, ending before its offset. Our selected timeframe for the ERP epochs is similar to that used in the litera- ture by others who investigated ERP responses in adult ADHD patients (e.g.: Raz and Dan [30] or Helenius et al.
[40]). Altogether, the number of analysed epochs for ADHD patients and controls were 260 and 276, respectively.
ERP analysis and behavioural measures
ERPs during correct NoGo conditions were recorded and averaged at all 128 electrode sites. Time windows for hypothesized components were determined a priori.
Specifically, the P1 was defined as the mean amplitude deflection (i.e., area under curve) occurring in the window from 120 to 150 ms post-stimulus [41]. When investigat- ing relationships between ERPs and clinical measures, midline electrodes (Fz, Cz, Pz and Oz) as sites of interests were defined based on a review of the literature of Go/
NoGo tasks used in adult ADHD studies [29,40,42,43].
Since early visual ERP components such as P1 typically exhibit polarity reversal in the posterior-to-anterior dir- ection [44], at the midline electrode sites of interest we expected that the P1 amplitude will change along the
sagittal axis from positive (occipitally) to negative sign (frontally).
Performance was assessed with measures of the mean reaction time and commission error rates. For reaction times, large values that exceeded the upper threshold of 1 s and small values that were below the threshold of 250 msec (and were therefore unlikely to be stimulus- locked responses) were excluded from the analyses.
Therefore, the accepted reaction time range was between 250 and 1000 ms (inclusive). Less than 0.5% of the indi- vidual reaction time values were rejected in each of the two groups on the basis of these threshold criteria (0.39 and 0.42% in the control and patient group, respect- ively). We checked the distribution of the reaction times after excluding values that were outside the accepted range. As indicated by the Kolmogorov-Smirnov D- statistic, the distribution of reaction times deviated from the normal distribution (p < 0.01 in each of the two study groups). We also investigated the distribution of error rates, and found that it - similarly to reaction times - deviated from the normal distribution in both study groups (p < 0.01). Since the distribution of reaction times and error rates was right skewed with increasingly higher values occurring with increasingly lower fre- quency, these behavioural data were analysed by apply- ing the Generalized Linear Mixed Model (GLIMMIX) analysis with a logarithmic link function to compare the two study groups. This approach makes allowance for non-normally distributed data, such as the right skewed distribution of behavioural data in our study. Measure of central tendency for the reaction time and commission error rate in each group was characterized by the mean and 95% confidence limits, which were derived as back- transformed data from the GLIMMIX procedure from logarithmic to the original units (msec or error rate).
Statistical analyses
The primary statistical analysis for group difference between ADHD and control subjects was based on the random regression hierarchical linear model (HLM).
Amplitude (voltage) values within the time-window of interest (120-150 ms) were used as dependent variable in the HLM. Group, time (sampling point) and their inter- action were applied as independent variables; age and gender and level of education served as covariates in all analyses. A separate analysis was performed for each scalp site of interest (all 128 electrodes, including Fz, FCz, Cz, Pz and Oz). For these topographical analyses using the full set of the 128 channels, the False Discov- ery Rate (FDR)-corrected p-values [45] were computed.
The alpha-level of 0.05 (adjusted for multiple compari- sons) was adopted for statistical significance.
In order to delineate the topographical distribution of the differences, we investigated whether the EEG recording
from multiple individual channels aggregated into electrode clusters with respect to group differences. We defined elec- trode clusters as a group of at least five adjacent scalp deri- vations with significant group difference in the same direction.
For scalp sites of interests that yielded a significant group difference in the primary analysis after Bonferroni correction for multiple testing, we conducted additional analyses to test whether psychopathological variables served as covariates in explaining the significant alter- ations in early sensory activity. These covariates included the total score on the CAARS Hyperactivity, Impulsivity, Inattention, and Problems with Self-Concept domains.
In subsidiary analyses, we also investigated whether comor- bidity (present/absent) and medication status (stimulant treatment yes/no; any psychopharmacological treatment yes/no) impacted our results. In these analyses, the latter variables were included as additional covariates in the HLM model.
Results
Demographics and basic descriptive characteristics Basic demographic and clinical characteristics of the study population are provided in Table1.
The control and the ADHD group did not differ in main demographic variables, including age and gender.
As shown by Table1, the patient group had a somewhat lower achievement in terms of years of education (by <
3 years); the difference obtained statistical significance.
The ADHD group had higher scores on the SCL-90R scale measuring general psychopathology, and was charac- terised by higher severity on all specific symptom dimen- sions, including the CAARS factors of Inattention, Hyperactivity, Impulsivity and Problems with Self-Concept.
A total of 11 (42.3%) of 26 patients had comorbidity ac- cording to the DSM-IV system. All comorbidities fell into DSM-IV affective-categories, including depressive (n= 4), and anxiety disorders (n = 4) or both (n= 3). Approximately half of the 26 patients had psychopharmacological treat- ment (n= 12, [46.2%]); these included patients who received methylphenidate (n= 9, [34.6%]), and 3 patients who had antidepressants (n= 2) or anxiolytic (n = 1).
Behavioural outcomes
Behavioural data including reaction times and accuracy was collected by the Presentation software during task performance. Incorrect NoGo responses represented commission errors, while incorrect Go responses omis- sion errors. Reactions times and accuracy were com- pared between the two groups (ADHD vs. control subjects) using the analysis of covariance (ANCOVA) procedure controlling for age, gender and education as implemented in SAS software version 9.4 (SAS Institute Inc., Cary, NC, USA). Behavioural data are summarized
in Table 1. Mean reaction time was lower in ADHD pa- tients than in control subjects, but the difference did not reach the level of significance (502.51 ms vs. 508.5 ms, p= 0.7670). Overall, ADHD patients were less accurate on commission (false NoGo) trials (p< 0.001) than on omission trials. Commission error response rates were on average 8.85% in ADHD, and 3.04% in control sub- jects (Table1).
ERP
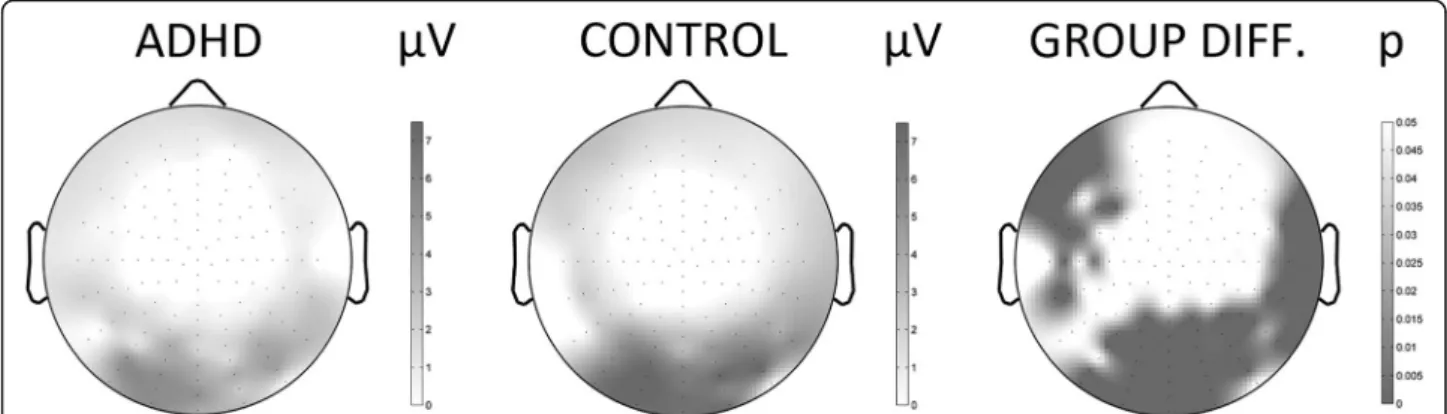
To demonstrate the scalp-distribution of ERPs, Fig.1de- picts the topographical map of the group differences in the 120-150 ms time-window. Besides the topographical map of ERP-voltages, the FDR-corrected map of Type-I error-probabilities is provided. Differences between pa- tient and control groups regarding ERP amplitudes were significant at several brain regions and retained signifi- cance after correction for multiple testing. Specifically, ADHD patients showed significantly reduced P1 ampli- tude at occipital and inferior-temporal areas compared to controls in the NoGo condition (Table 2). Besides Type-I error-probabilities the table provides the covari- ance adjusted Least-Squares Mean (LSMean) estimates
of the ERP amplitudes for both the ADHD and the con- trol group.
Since in the adult ADHD EEG literature midline elec- trodes traditionally have been used as electrode sites of interest where ERP amplitudes are investigated in more detail, besides our ‘whole brain’ approach, we also fo- cused on ERP analyses at Fz, FCz, Cz, Pz and Oz 10–20 midline electrodes. Considering that our results showed that ADHD patients have significantly reduced NoGo P1 amplitude at occipital and inferior-temporal areas in- cluding Cz, Pz and Oz electrodes sites, focusing on mid- line electrode sites enabled comparison of our results with the literature.
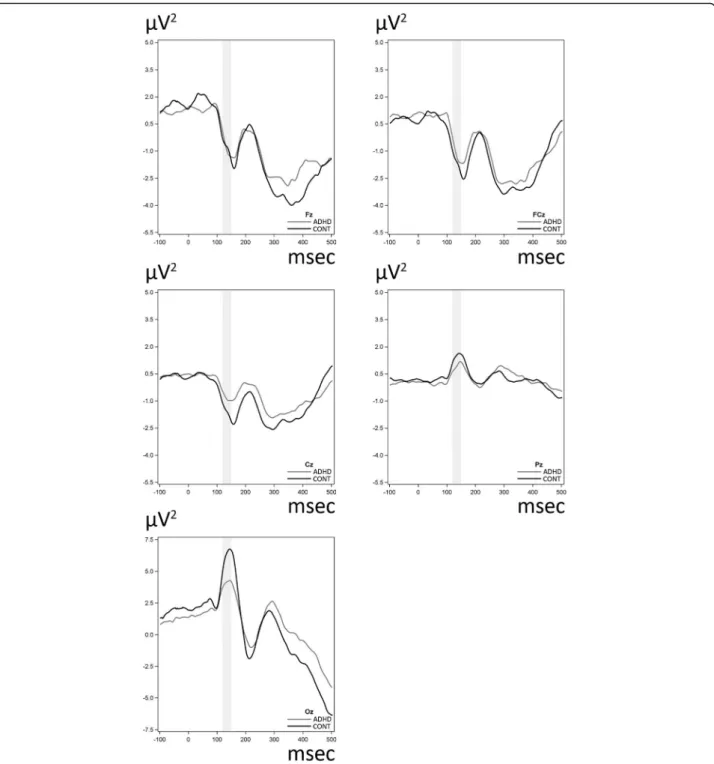
Figure2shows the grand average ERPs of the midline electrodes for NoGo stimuli for the ADHD and the con- trol groups. As for the 10–20 midline electrodes, a sig- nificant difference was found between the ADHD and the control group including and surrounding the Cz, Pz and Oz sites in the 120-150 ms timeframe with lower ERP amplitudes in the patients. We note that in our sub- sidiary analyses we examined whether the aforemen- tioned group differences are present after adjustment for comorbidity and medication status. These analyses Table 1Basic demographic and clinical characteristics of the study samplea
Characteristics Control (N= 25) ADHD (N= 26) Chi2 P
Male, N (%) 19 (76.0) 18 (69.2) 0.29 0.76
Medication
Methylphenidate, N (%) – 9 (34.6) n/a n/a
Antidepressant, N (%) – 2 (7.69) n/a n/a
Anxiolytic, N (%) – 1 (3.85) n/a n/a
Comorbidity
Depressive disorder, N (%) – 4 (15.38) n/a n/a
Anxiety disorder, N (%) – 4 (15.38) n/a n/a
Both, N (%) – 3 (11.54) n/a n/a
F P
Mean age, mean (SD) 27.3 (5.0) 28.9 (8.4) 0.71 0.40
Years of education, mean (SD) 16.3 (1.6) 14.0 (2.5) 13.94 0.0005
CAARSb
Inattention, mean (SD) 11.1 (7.9) 23.7 (7.0) 32.09 < 0.0001
Hyperactivity, mean (SD) 10.1 (6.3) 20.1 (4.8) 36.74 < 0.0001
Impulsivity, mean (SD) 9.1 (6.5) 17.6 (7.4) 16.98 0.0002
Problems with Self Concept (SD) 4.8 (4.4) 10.1 (5.5) 12.92 0.0008
SCL-90Rc, mean (SD) 33.1 (30.1) 86.3 (51.3) 16.48 0.0002
Behavioural measures
Commission errors, %, mean (95% confidence limits) 3.04 (2.32–3.98) 8.85 (7.63–10.2) 46.33 < 0.0001 Reaction time, msec, mean (95% confidence limits) 508.5 (480.12–538.55) 502.51 (475.27–531.31) 0.09 0.7670
aChi-square test for categorical, Analysis of Variance for continuous variables. Generalized Linear Mixed Model (GLIMMIX) analysis was applied for the behavioural measures since this approach makes allowance for non-normally distributed data; mean and 95% confidence limits were estimated from the GLIMMIX model
bCAARS = Conners’Adult ADHD Rating Scales
cSCL-90R = Symptom Checklist-90R
showed that all results which were statistically significant retained their significance after including comorbidity and medication status as additional covariates in the analyses.
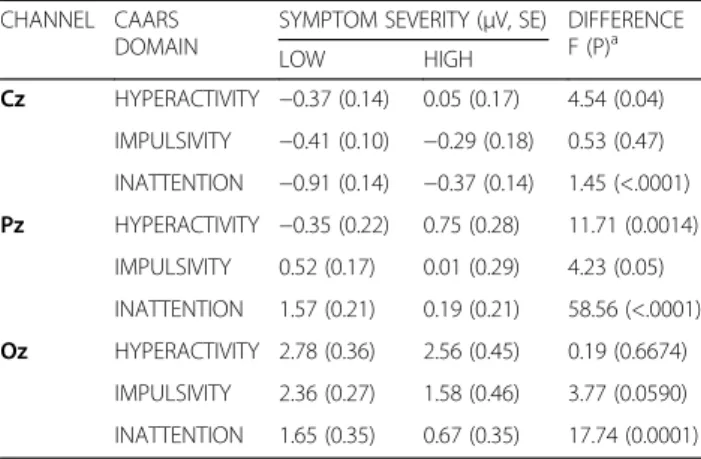
Relationship between ERP and clinical characteristics Dimensional associations between the P1 ERP compo- nent and psychopathological variables, including the severity on the CAARS Hyperactivity, Impulsivity and Inattention subscales were examined using the data of all participants combined. The analysis was conducted for those midline electrodes where a significant group- difference was present in the P1 time-window. Based on the HLM model, we determined the LSMeans for the P1 ERP amplitude for low and high severity of CAARS Hyperactivity, Impulsivity and Inattention subscales in order to interpret the direction of the associations.
After corrections for multiple comparisons, we found that the Inattention factor was related to ERP changes at
Cz, Pz and Oz electrode sites (F = 1.45, p< .0001; F = 58.56, p < .0001; F = 17.74 p= 0.0001, respectively). In- vestigation of the direction of the relationship revealed smaller P1 amplitudes among those subjects who had higher severity on Inattention as compared to subjects with lower subscale severity. Hyperactivity scores were also associated with ERP changes at Cz and Pz sites (F = 4.54, p= 0.04; F = 11.71 p= 0.0014, respectively), with the opposite direction: patients with higher hyperactivity scores had significantly higher P1 amplitudes. The rela- tionship between altered early ERP activity and CAARS symptom dimensions is shown in Table3.
Discussion
The current study investigated the behavioural and neurophysiological correlates of early visual processing reflected in the P1 ERP component in a visual Go/NoGo task in a cohort of adults with ADHD and their healthy controls.
Despite existing controversies regarding their task per- formance, patients with ADHD often perform poorer in the laboratory setting than control subjects on Go/NoGo inhibition tasks [29, 46, 47]. In our Go/NoGo paradigm [35], we used a long interstimulus interval, which could explain the observed high performance of both groups regarding commission errors. Despite this finding, how- ever, in lines with the literature, patients with ADHD made significantly more commission errors than con- trols in our study.
As for reaction times, we found a rather modest, non- significant difference between patients and control sub- jects, with patients being faster than controls. This find- ing is consistent with a significant number of previous observations of childhood ADHD [28,48], and is also in line with some ADHD data reporting adult patients not Table 2Control vs. ADHD: group differencesain the P1
component in the midline 10–20 electrodesb CHAN
NEL
GROUP (μv, SE) F P
ADHDc CONTROLc
Fz −0.87 (0.09) −0.83 (0.09) 0.07 ~ 1.0
FCz −1.20 (0.09) −1.63 (0.09) 11.82 0.1541
Cz −0.85 (0.06) −1.61 (0.06) 71.88 <.0001
Pz 0.94 (0.09) 1.49 (0.09) 18.57 0.0101
Oz 4.12 (0.15) 6.32 (0.15) 104.45 <.0001
aRandom Regression Hierarchical Linear Model analysis with group, time and interaction as independent variables, and with age, gender and years of education as covariates
bTime window for the P1 component: 120-150 ms poststimulus
cLeast-squares means estimates (SE) of stimulus-locked ERP amplitudes for a given study group, adjusted for age, gender and years of education
Fig. 1Topographical maps of the P1 component based on the full set of 128 individual channels for the NoGo condition in ADHD patients and in control subjects. The scalp maps were generated on the basis of the average voltage values in the time-window of the P1 component.
Clusters of at least five adjacent scalp derivations with significant group difference in the same direction were defined as electrode clusters, depicted here. Black-and-white coding represents the amplitude value in microvolts, with darker colours corresponding to higher amplitudes.
False discovery rate (FDR)-corrected map of Type-I error-probabilities for the group-difference of raw amplitude values Control-ADHD (μV) where darker shades represent larger group differences
being significantly different from healthy controls in terms of reaction time [29,43,46,49].
The limited number of ERP studies on early informa- tion processing provided inconsistent results (for a re- view see Johnstone et al. [50]), with some reporting altered P1 amplitudes in adult ADHD subjects compared to controls [30] and others failing to confirm this [29]. It is important to note that the EEG methodology in the
literature is diverse. In our study a high density EEG setting provided data on the whole brain area, while a long interstimulus interval assured that the repetition of stimuli did not confound early sensory compo- nents. As for further methodological issues, while some of the above studies have used a dense array EEG (e.g. Woltering et al.– 64 channels [29], Raz and Dan – 64 channels [30]), ERP peak amplitudes are
Fig. 2Waveforms for raw amplitude (μV) values for stimulus-locked ERPs in five typical scalp sites (Fz, FCz, Cz, Pz, Oz). The waveforms are displayed for both groups for the NoGo condition (commission-error responses). Time-window for the P1 ERP component is shaded
usually measured at a lower number of traditionally used electrode sites.
The main finding of our EEG study is that adults with ADHD showed a reduced P1 amplitude. The P1 is the first positive ERP component present around 100 ms after stimulus, associated with basic visual processing and spatial attention. ERP amplitude is thought to reflect the activation level of the activated central nervous sys- tem neuronal population [24]. Therefore, the reduced amplitude of the P1 component is considered to reflect an early sensory deficit present in adults with ADHD.
While in the ADHD literature later ERP components are more commonly studied, in schizophrenia research the P1 component is considered an endophenotype measure [51] with consistent deficits in the early visual processing in patients with schizophrenia as indexed by a reduced P1 component. This reduction of the P1 amp- litude, observed as well in our sample of patients with ADHD can be related either to a limited capacity in fo- cusing attention or to a decreased attentional gain con- trol mechanism on early sensory responses [24, 48].
Prox et al. [43] suggest that differences in later ERP components indicate that ADHD patients may be over- coming the described early sensory deficits by more ef- fortful later-stage processing. In lines with this, Donohoe et al. [51] state that the P1 is indeed ‘cognitively pene- trable’ with early stages of information processing appearing to be reciprocally modulated by higher pro- cessing areas (top-down effects). Therefore, it could be argued that in patients with ADHD early sensory pro- cessing deficits may contribute to susceptibility to dis- traction/inattention in the illness, with top-down control aiming to adjust this impact on ADHD symptoms (i.e., inattention and impulsivity).
Based on both parent-reported measures and psycho- logical assessment, sensory profile of children significantly
differs from their typically developing peers, including the visual domain [52]. These difficulties have been analysed in some studies with both behavioural and neuropsycho- logical measures [9]. With the high temporal resolution of EEG, we were able to observe early sensory processing in a reliable, detailed manner. Therefore, altered early sen- sory ERPs, including P1 could provide further, electro- physiological evidence of altered sensory processing in patients with ADHD.
The above mentioned P1 amplitude alterations were not only present on occipital regions (the activity of which primarily reflects electrophysiological changes of sensory brain areas), but we also found significant differ- ences between ADHD and control groups regarding the P1 ERP amplitude on left inferior-frontal and inferotem- poral EEG channels. Prior studies found that the left in- ferior frontal gyrus (IFG) plays a crucial role in top- down control, and is reciprocally connected to more posterior regions, including lateral temporal cortices. For example, in a phonological test using functional magnetic resonance imaging (fMRI), Bitan et al. [53] examined top- down control among various brain regions, and found that the left IFG elicits a selective enhancement of task-specific processing in posterior brain regions. Our findings of de- creased P1 amplitude in this region are therefore also con- sistent with the idea of a weakened top-down control in ADHD for the processing of task relevant versus task- irrelevant information [54], which may be due to neurode- velopmental changes that were described in ADHD, espe- cially in the frontal areas [35,55].
Our second goal was to investigate whether alterations in the early sensory processing stages in ADHD are re- lated to psychopathological symptoms. We found that the P1 amplitude reduction correlated with symptoms of inattention as measured by the Conners’ Adult ADHD Rating Scale [37]. This association indicated that our subjects with higher inattention scores showed more pronounced electrophysiological changes at posterior scalp sites. On the other hand, a different pattern was observed regarding the connection between CAARS Hyperactivity subscale and P1 amplitude; lower ampli- tudes were associated with lower symptom severity as measured by the CAARS Hyperactivity subscale.
In particular, the P1 amplitude alteration was associ- ated with higher symptom severity on the CAARS scale regarding inattention at central/posterior electrode sites, while patients with higher hyperactivity scores had a higher (less attenuated) P1 component. These findings are consistent with the idea that symptom presentation in ADHD may not be a unitary phenomenon, and may reflect multiple aetiologies. They are also in line with the causal model of Sokolova et al. [56], which considers in- attention a driving factor for hyperactivity/impulsivity, whereas those factors which lead to high hyperactivity/
Table 3Relations between symptom severity as measured by CAARS and P1 ERP amplitudes on midline electrode sites between 120 and 150 ms.
CHANNEL CAARS DOMAIN
SYMPTOM SEVERITY (μV, SE) DIFFERENCE F (P)a
LOW HIGH
Cz HYPERACTIVITY −0.37 (0.14) 0.05 (0.17) 4.54 (0.04) IMPULSIVITY −0.41 (0.10) −0.29 (0.18) 0.53 (0.47) INATTENTION −0.91 (0.14) −0.37 (0.14) 1.45 (<.0001) Pz HYPERACTIVITY −0.35 (0.22) 0.75 (0.28) 11.71 (0.0014)
IMPULSIVITY 0.52 (0.17) 0.01 (0.29) 4.23 (0.05) INATTENTION 1.57 (0.21) 0.19 (0.21) 58.56 (<.0001) Oz HYPERACTIVITY 2.78 (0.36) 2.56 (0.45) 0.19 (0.6674)
IMPULSIVITY 2.36 (0.27) 1.58 (0.46) 3.77 (0.0590) INATTENTION 1.65 (0.35) 0.67 (0.35) 17.74 (0.0001)
acorrections for multiple comparisons were applied
impulsivity do not necessarily lead to higher inattention.
Also, inattention can be viewed in the context of a pos- sible sensory deficit. In this context, poor inattention may be modulated by higher hyperactivity through a pathological compensatory gain control mechanism.
Although ERP research has grown extensively in the past decades, besides a need for a more rigorous ap- proach to increase the consistency and generalizability of electrophysiological findings [50], it is noteworthy that studies generally rely on analysis of traditional single channel waveforms (typically in Fz, Cz, and Pz areas).
Extending this focus and providing high-density maps of topographical distribution would result in a statistically more confident delineation and a better understanding of electrophysiological changes as well. Dysfunctional early stages of information processing can result in defi- cits in later stages as well, therefore, we suggest that fur- ther research efforts should address these alterations more explicitly. Another important aspect regarding fur- ther studies would be a more thorough examination of study samples, including the relationship between ERP amplitudes, ADHD subtypes and symptoms, which could serve as an initial step in the aim to find the place of EEG/ERPs in diagnosis.
Limitations of our study include that a subset of pa- tients received medication. However, in our subsidiary analyses we examined the impact of medication status on our findings, and found that results remained statisti- cally significant after the adjustment for medication sta- tus. We should also note that although the two groups differed regarding task performance, the relatively good task performance in the ADHD group combined with the low probability of NoGo stimuli did not allow for separate analyses on correct and false NoGo trials.
Conclusions
The current investigation revealed altered P1 amplitudes in adult ADHD patients, indicating that early sensory deficits are present in this patient population. This find- ing and its relationship to ADHD symptomatology are suggestive of bottom-up cognitive deficits in ADHD which are driven by impairments in early visual process- ing, and provide evidence that sensory processing prob- lems are present at the neurophysiological level in this population. Since dysfunctional early stages of informa- tion processing can result in deficits in later stages, fur- ther research efforts should address these alterations more explicitly.
Abbreviations
ADHD:Attention-deficit/hyperactivity disorder; ERP: Event-related potential;
EEG: Electro-encephalography; CPT: Continuous performance task;
swLORETA: Standardized weighted low resolution electromagnetic tomography; SCL-90R: Symptom Checklist 90R; CAARS: Conners’Adult ADHD Rating Scale; EOG: Electrooculogram; EMSE: Electromagnetic Source Signal Imaging; SAS: Statistical Analysis System; HLM: Hierarchical linear model;
FDR: False Discovery Rate; ANCOVA: Analysis of covariance; LSMean: Least- Squares Mean; IFG: Inferior frontal gyrus; fMRI: Functional magnetic resonance imaging
Acknowledgements Not applicable.
Authors’contributions
S.P: conception and design of the study, acquisition and analysis of data, drafting the manuscript and figures. L.T. conception and design of the study, acquisition and analysis of data, drafting the manuscript and figures. B.K.
acquisition and analysis of data. L.B. acquisition and analysis of data. J.M.R.
interpretation of the findings, drafting the manuscript. I.B. clinical supervision, interpretation of the findings, drafting the manuscript. P.C. conception and design of the study, acquisition and analysis of data, drafting the manuscript or figures. All authors read and approved the final manuscript.
Funding
This study was supported by the Hungarian Brain Research Program (NAP), KTIA_NAP_13–12013-0001. The funding body had no role in the design of the study and collection, analysis, and interpretation of data and in writing the manuscript.
Availability of data and materials
The datasets used and/or analysed during the current study are available from the corresponding author on reasonable request.
Ethics approval and consent to participate
The study complied with the ethical standards of the Declaration of Helsinki, and received approval from the Ethical Committee of Semmelweis University. All participants gave written Informed Consent for the study.
Consent for publication Not applicable.
Competing interests
The authors declare that they have no competing interests.
Received: 4 June 2019 Accepted: 31 May 2020
References
1. Faraone SV, Sergeant J, Gillberg C, Biederman J. The worldwide prevalence of ADHD: is it an American condition? World Psychiatry. 2003;2(2):104–13.
2. Simon V, Czobor P, Bálint S, Mészáros Á, Bitter I. Prevalence and correlates of ADHD meta-analysis. Br J Psychiatry. 2009;194:204–11.
3. American Psychiatric Association. Diagnostic and statistical manual of mental disorders. 5th edition. Washington, DC: Author; 2013.
4. Mostert JC, Onnink AMH, Klein M, Dammers J, Harneit A, Schulten T, et al.
Cognitive heterogeneity in adult attention deficit/hyperactivity disorder: a systematic analysis of neuropsychological measurements. Eur
Neuropsychopharmacol. 2015;25(11):2062–74.
5. Klassen AF, Miller A, Fine S. Health-related quality of life in children and adolescents who have a diagnosis of attention-deficit/hyperactivity disorder.
Pediatrics. 2004;114(5):e541–7.
6. Pulay AJ, Bitter I, Papp S, Gulácsi L, Péntek M, Brodszky V, et al. Exploring the relationship between quality of life (EQ-5D) and clinical measures in adult attention deficit hyperactivity disorder (ADHD). Appl Res Qual Life. 2016;
12(2):409–24.
7. Yochman A, Parush S, Ornoy A. Responses of preschool children with and without ADHD to sensory events in daily life. Am J Occup Ther. 2004;58(3):
294–302.
8. Miller LJ, Anzalone ME, Lane SJ, Cermak SA, Osten ET. Concept evolution in sensory integration: a proposed nosology for diagnosis. Am J Occup Ther.
2007;61(2):135–42.
9. Shimizu VT, Bueno OFA, Miranda MC. Sensory processing abilities of children with ADHD. Brazilian J Phys Ther. 2014;18(4):343–52.
10. Mangeot SD, Miller LJ, McIntosh DN, McGrath-Clarke J, Simon J, Hagerman RJ, et al. Sensory modulation dysfunction in children with attention-deficit- hyperactivity disorder. Dev Med Child Neurol. 2001;43(6):399–406.
11. Ben-Sasson A, Carter AS, Briggs-Gowan MJ. Sensory over-responsivity in elementary school: prevalence and social-emotional correlates. J Abnorm Child Psychol. 2009;37(5):705–16.
12. Pfeiffer B, Daly BP, Nicholls EG, Gullo DF. Assessing sensory processing problems in children with and without attention deficit hyperactivity disorder. Phys Occup Ther Pediatr. 2014;35(1):1–12.
13. Janssen TWP, Gelade K, van Mourik R, Maras A, Oosterlaan J, Geladé K, et al.
An ERP source imaging study of the oddball task in children with attention deficit/hyperactivity disorder. Clin Neurophysiol. 2016;127(2):1351–7.
14. Sergeant JA. Modeling attention-deficit/hyperactivity disorder: a critical appraisal of the cognitive-energetic model. Biol Psychiatry. 2005;57(11):
1248–55.
15. Gonzalez CMG, Clark VP, Fan S, Luck SJ, Hillyard SA. Sources of attention- sensitive visual event-related potentials. Brain Topogr. 1994;7(1):41–51.
16. Hillyard SA, Vogel EK, Luck SJ. Sensory gain control (amplification) as a mechanism of selective attention: electrophysiological and neuroimaging evidence. Philos Trans R Soc B Biol Sci. 1998;353(1373):1257–70.
17. Di Russo F, Spinelli D. Electrophysiological evidence for an early attentional mechanism in visual processing in humans. Vis Res. 1999;39(18):2975–85.
18. Handy TC, Mangun GR. Attention and spatial selection: electrophysiological evidence for modulation by perceptual load. Percept Psychophys. 2000;
62(1):175–86.
19. Kemner C, Verbaten MN, Koelega HS, Buitelaar JK, van der Gaag RJ, Camfferman G, et al. Event-related brain potentials in children with attention-deficit and hyperactivity disorder: effects of stimulus deviancy and task relevance in the visual and auditory modality. Biol Psychiatry. 1996;
40(6):522–34.
20. Barry RJ, Clarke AR, McCarthy R, Selikowitz M, Brown CR, Heaven PCL. Event- related potentials in adults with attention-deficit/hyperactivity disorder: an investigation using an inter-modal auditory/visual oddball task. Int J Psychophysiol. 2009;71(2):124–31.
21. Brown CR, Clarke AR, Barry RJ, McCarthy R, Selikowitz M, Magee C. Event- related potentials in attention-deficit/hyperactivity disorder of the predominantly inattentive type: an investigation of EEG-defined subtypes.
Int J Psychophysiol. 2005;58(1):94–107.
22. Shen I-H, Tsai S-Y, Duann J-R. Inhibition control and error processing in children with attention deficit/hyperactivity disorder: an event-related potentials study. Int J Psychophysiol. 2011;81(1):1–11.
23. Banaschewski T, Brandeis D, Heinrich H, Albrecht B, Brunneer E, Rothenberger A. Association of ADHD and conduct disorder - brain electrical evidence for the existence of a distinct subtype. J Child Psychol Psychiatry Allied Discip. 2003;44(3):356–76.
24. Nazari MA, Berquin P, Missonnier P, Aarabi A, Debatisse D, De Broca A, et al.
Visual sensory processing deficit in the occipital region in children with attention-deficit/hyperactivity disorder as revealed by event-related potentials during cued continuous performance test. Neurophysiol Clin Neurophysiol. 2010;40(3):137–49.
25. Strandburg RJ, Marsh JT, Brown WS, Asarnow RF, Higa J, Harper R, et al.
Continuous-processing-related event-related potentials in children with attention deficit hyperactivity disorder. Biol Psychiatry. 1996;40:964–80.
26. Ozdag MF, Yorbik O, Ulas UH, Hamamcioglu K, Vural O. Effect of methylphenidate on auditory event related potential in boys with attention deficit hyperactivity disorder. Int J Pediatr Otorhinolaryngol. 2004;68(10):
1267–72.
27. Yorbik O, Ozdag MF, Olgun A, Senol MG, Bek S, Akman S. Potential effects of zinc on information processing in boys with attention deficit hyperactivity disorder. Prog Neuro-Psychopharmacol Biol Psychiatry. 2008;
32(3):662–7.
28. Smith JL, Johnstone SJ, Barry RJ. Inhibitory processing during the go/NoGo task: an ERP analysis of children with attention-deficit/hyperactivity disorder.
Clin Neurophysiol. 2004;115:1320–31.
29. Woltering S, Liu Z, Rokeach A, Tannock R. Neurophysiological differences in inhibitory control between adults with ADHD and their peers.
Neuropsychologia. 2013;51(10):1888–95.
30. Raz S, Dan O. Altered event-related potentials in adults with ADHD during emotional faces processing. Clin Neurophysiol. 2015;126(3):514–23.
31. Srinivasan R, Tucker DM, Murias M. Estimating the spatial Nyquist of the human EEG. Behav Res Methods Instrum Comput. 1998;30:8–19.
32. Song J, Davey C, Poulsen C, Luu P, Turovets S, Anderson E, et al. EEG source localization: sensor density and head surface coverage. J Neurosci Methods.
2015;256:9–21.
33. Freeman WJ, Holmes MD, Burke BC, Vanhatalo S. Spatial spectra of scalp EEG and EMG from awake humans. Clin Neurophysiol. 2003;114(6):1053–68.
34. Durston S, Thomas KM, Yang YH, Ulug AM, Zimmerman RD, Casey BJ. A neural basis for the development of inhibitory control. Dev Sci. 2002;5(4):F9–16.
35. Durston S, Tottenham NT, Thomas KM, Davidson MC, Eigsti IM, Yang Y, et al.
Differential patterns of striatal activation in young children with and without ADHD. Biol Psychiatry. 2003;53(10):871–8.
36. Derogatis LR, Cleary PA. Factorial invariance across gender for the primary symptom dimensions of the SCL-90. Br J Soc Clin Psychol. 1977;16(4):347–56.
37. Conners CK, Pitkanen J, Rzepa SR. Conners 3rd Edition (Conners 3; Conners 2008). In: Kreutzer JS, DeLuca J, Caplan B, editors. Encyclopedia of clinical neuropsychology. New York, NY: Springer; 2011. p. 675–8.
38. American Psychiatric Association. Diagnostic and Statistical Manual of Mental Disorders. 4th edition, text rev. Washington, DC: Author; 2000.
39. Unoka Z, Rozsa S, Ko N, Kallai J, Fabian A, Simon L. Validity and reliability of the SCL-90 in a Hungarian population sample. Psychiatr Hungarica. 2004;
19(3):235–43.
40. Helenius P, Laasonen M, Hokkanen L, Paetau R, Niemivirta M. Impaired engagement of the ventral attentional pathway in ADHD.
Neuropsychologia. 2011;49(7):1889–96.
41. Pourtois G, Delplanque S, Michel C, Vuilleumier P. Beyond conventional event-related brain potential (ERP): exploring the time-course of visual emotion processing using topographic and principal component analyses.
Brain Topogr. 2008;20(4):265–77.
42. Wiersema R, van der Meere J, Antrop I, Roeyers H. State regulation in adult ADHD: an event-related potential study. J Clin Exp Neuropsychol. 2006;28(7):
1113–26.
43. Prox V, Dietrich DE, Zhang Y, Emrich HM, Ohlmeier MD. Attentional processing in adults with ADHD as reflected by event-related potentials.
Neurosci Lett. 2007;419(3):236–41.
44. Skrandies W. Topographical analysis of electrical brain activity: methodological aspects. In: Zani A, Proverbio AM, editors. The cognitive electrophysiology of mind and brain. San Diego: Academic Press; 2003. p. 401–16.
45. Benjamini Y, Drai D, Elmer G, Kafkafi N, Golani I. Controlling the false discovery rate in behavior genetics research. Behav Brain Res. 2001;125(1–2):279–84.
46. Hervey AS, Epstein JN, Curry JF. Neuropsychology of adults with attention- deficit/hyperactivity disorder: a meta-analytic review. Neuropsychology.
2004;18(3):485–503.
47. Valko L, Doehnert M, Müller UC, Schneider G, Albrecht B, Drechsler R, et al.
Differences in neurophysiological markers of inhibitory and temporal processing deficits in children and adults with ADHD. J Psychophysiol. 2009;
23(4):235–46.
48. Perchet C, Revol O, Fourneret P, Mauguière F, Garcia-Larrea L. Attention shifts and anticipatory mechanisms in hyperactive children: an ERP study using the Posner paradigm. Biol Psychiatry. 2001;50(1):44–57.
49. Lijffijt M, Kenemans JL, Verbaten MN, Van Engeland H. A meta-analytic review of stopping performance in attention-deficit/ hyperactivity disorder:
deficient inhibitory motor control? J Abnorm Psychol. 2005;114(2):216–22.
50. Johnstone SJ, Barry RJ, Clarke AR. Ten years on: a follow-up review of ERP research in attention-deficit/hyperactivity disorder. Clin Neurophysiol. 2013;
124(4):644–57.
51. Donohoe G, Morris DW, De Sanctis P, Magno E, Montesi JL, Garavan HP, et al. Early visual processing deficits in Dysbindin-associated schizophrenia.
Biol Psychiatry. 2008;63(5):484–9.
52. Ghanizadeh A. Sensory processing problems in children with ADHD, a systematic review. Psychiatry Investig. 2011;8(2):89–94.
53. Bitan T, Cheon J, Lu D, Burman DD, Gitelman DR, Mesulam MM, et al.
Developmental changes in activation and effective connectivity in phonological processing. Neuroimage. 2007;38(3):564–75.
54. Petrovic P, Castellanos FX. Top-down dysregulation—from ADHD to emotional instability. Front Behav Neurosci. 2016;10:70.
55. Ambrosino S, De Zeeuw P, Wierenga LM, Van Dijk S, Durston S. What can cortical development in attention-deficit/ hyperactivity disorder teach us about the early developmental mechanisms involved? Cereb Cortex. 2017;27(9):4624–34.
56. Sokolova E, Groot P, Claassen T, Van Hulzen KJ, Glennon JC, Franke B, et al.
Statistical evidence suggests that inattention drives hyperactivity/impulsivity in attention deficit-hyperactivity disorder. PLoS One. 2016;11(10):1–17.
Publisher’s Note
Springer Nature remains neutral with regard to jurisdictional claims in published maps and institutional affiliations.