NON-INVASIVE ASSESSMENT OF HEPATIC
STEATOSIS AND FIBROSIS IN INDIVIDUALS LIVING WITH HIV
PhD thesis
Mihály Sulyok
Clinical Medicine Doctoral School Semmelweis University
Supervisor: István Vályi-Nagy MD, Ph.D Official reviewers: Gergely Kriván MD, Ph.D
Béla Hunyady MD, Ph.D, D.Sc
Head of the Final Examination Committee: Ilona Kovalszky MD, Ph.D, D.Sc Members of the Final Examination Committee: Gabriella Lengyel MD, C.Sc
Mária Mezei Ph.D
Budapest
2017
1
Table of Contents
Table of Contents ... 1
Table of Figures and Tables ... 3
Figures ... 3
Tables ... 4
The List of Abbreviations ... 5
1 Introduction ... 7
2 Study objectives ... 15
2.1 Primary objectives ... 15
2.2 Secondary objectives ... 15
2.3 Exploratory objectives ... 15
3 Methods ... 16
3.1 Study population ... 16
3.2 Interview and clinical parameters ... 17
3.3 Transient elastography ... 18
3.4 Sample size considerations ... 21
3.5 Statistical analysis ... 21
4 Results ... 23
4.1 Study population characteristics ... 23
4.2 Univariate analysis of the association between the CAP value and different variables ... 27
4.3 Multivariate regression models that predict the CAP value ... 31
4.4 Univariate analysis of the association between liver stiffness and different variables ... 39
4.5 Multivariate regression models predicting liver stiffness ... 43
5 Discussion ... 51
6 Conclusions ... 61
7.A Summary ... 63
7.B Összefoglalás ... 64 DOI:10.14753/SE.2017.2035
2
8 Conflicts of interest ... 65
9 Bibliography ... 66
10 Bibliography of the candidate’s publications ... 83
10.1 Related publications ... 83
10.2 Unrelated publications ... 83
11 Acknowledgements ... 85
3
Table of Figures and Tables
Figures
Figure 1. Recruitment Flow of Study Participants………..…17 Figure 2. Staging of liver fibrosis according to liver stiffness values in liver
diseases………..………...……...….20 Figure 3. Associations between antiretroviral medications (ever taken) in the whole study population………..………..………..…26 Figure 4. Correlations between continuous variables and CAP value…...………...…..30 Figure 5. Multivariate analysis: covariates with regression coefficients and confidence intervals of the model predicting CAP value………...…………....33 Figure 6. Information criterions of the multivariate model predicting CAP
value……….34 Figure 7. Bootstrap overfitting-corrected nonparametric calibration curve of the model predicting CAP value………..………...35 Figure 8. Multivariate analysis: covariates with regression coefficients and confidence intervals of the penalized model………..………...…...37 Figure 9. Bootstrap overfitting-corrected nonparametric calibration curve of the
penalized model predicting CAP value………...38 Figure 10. Multivariate analysis after covariate selection: covariates with regression coefficients and confidence
intervals………...……….…...39 Figure 11.. Correlations between Continuous Variables and the liver
stiffness…....………....……….……...42 Figure 12. Multivariate analysis: covariates with regression coefficients and confidence intervals predicting liver
stiffness………..….………….45 Figure 13. Information criterions of the multivariate model predicting liver
stiffness………...….46 Figure 14. Bootstrap overfitting-corrected nonparametric calibration curve of the model predicting liver stiffness………..…..………..………47 Figure 15. Multivariate analysis: covariates with regression coefficients and confidence intervals of the penalized model using liver stiffness as response
variable………...………..……...59 Figure 16. Bootstrap overfitting-corrected nonparametric calibration curve of the
penalized model predicting liver stiffness……….………..50 DOI:10.14753/SE.2017.2035
4
Tables
Table 1. Study population characteristics………...24 Table 2. Univariate analysis: associations of CAP value with continuous (panel A) and categorical (panel B)
variables………..…………...27 Table 3. Regression coefficients of covariets predicting CAP
value……….32 Table 4. Regression coefficients of covariets predicting CAP value in the penalized model………...35 Table 5. Univariate analysis: associations of liver stiffness value with continuous (panel A) and categorical (panel B)
variables……....………..……….40 Table 6. Multivariate model predicting liver
stiffness………..………….…………..……...43 Table 7. Multivariate penalized model predicting liver
stiffness………..…..48
5
The List of Abbreviations
AIC: Aikake Information Criterion ALD: alcoholic liver disease
anti-HBc: antibody against hepatitis B core antigen APC: alcohol per capita consumption
ART: antiretroviral therapy ARV: antiretroviral
BIC: Schwarz Bayesian Information Criterion BMA: Bayesian Model Averaging
BMI: body mass index
CAP: controlled attenuation parameter ART: antiretroviral therapy
cART: combined antiretroviral therapy CI: confidence interval
CVD: cardiovascular DM: diabetes mellitus FLA: Facial lipoatrophy
GALT: Gut-associated lymphoid tissue HBsAg: hepatitis B surface antigen HBV: hepatitis B virus
HCV: hepatitis C virus HDL: low density lipoprotein
HIV: human immunodeficiency virus DOI:10.14753/SE.2017.2035
6 HS: hepatic steatosis
IQR: interquartile range IVDU: intravenous drug user LB: liver biopsy
LDL: high density lipoprotein LF: liver fibrosis
LOWESS: locally weighted scatterplot smoothing LPV/r: ritonavir boosted lopinavir
LSM: liver stiffness measurement LS: liver stiffness
MSM: men having sex with men NAFL: non-alcoholic fatty liver
NAFLD: non-alcoholic fatty liver disease NASH: non-alcoholic steatohepatitis PI: protease inhibitor
PLWH: people living with HIV R: regression coefficient
SD: standard deviation TcR: T-cell receptor TE: transient elastography
VTCE: vibration controlled transient elastography
7 1 Introduction
Following the widespread use of combined antiretroviral treatment (ART), the landscape of the mortality and morbidity of individuals living with HIV has undergone remarkable changes (1-3). The proportion of AIDS-defining events and bacterial infections have declined, while non-AIDS defining events have become more frequent (1, 2, 4). Although the life expectancy of an HIV-infected person has improved dramatically and is nearly equivalent to the uninfected population (5, 6), a significant decrease in health-related quality of life has been observed, even in virologically stable individuals (7). The leading causes of mortality are cardiovascular events, non-AIDS-defining malignancies, liver and pulmonary diseases (1). The association with a heightened risk for cardiovascular disease has been described by several investigators (2, 4, 8, 9), and the rates of osteoporosis (10), physical function impairments, sarcopenia, frailty (11, 12) and neurocognitive decline (13) have also been reported to be higher compared with the general population.
Individuals living with HIV have an increased risk of these age-related morbidities compared with HIV-negative matched controls (9, 14). Whether this increased risk is caused by differences in lifestyle, such as smoking (15), alcohol or drug consumption (16), viral replication or immunologic changes or long-term ART toxicities, remains unclear. However, these factors are not mutually exclusive (17, 18).
The adverse effects and long-term toxicities of antiretroviral drugs involve all major organ systems and may contribute to the etiology of the aforementioned observations. For example, regarding the increased risk of cardiovascular events, a nucleoside reverse transcriptase analogue, abacavir, represents a risk factor for acute myocardial infarction according to observational data (19); however, this association is unclear because of the potential biases in this study (20). In a recent study, abacavir was associated with a greater than two-fold increased risk of CVD, which was not explained by renal dysfunction or other CVD risk factors (20). Another example is the observed loss of bone mineral density in patients treated with tenofovir-based antiretroviral therapy (ART) (21). Regarding these age-related and/or metabolic changes, the effects of the mitochondrial toxicity of older ART drugs are most concerning (22). Older protease inhibitors, such as lopinavir, and nucleoside analogues, such as zidovudine, didanosine or zalcitabine, are well-known
DOI:10.14753/SE.2017.2035
8
for these effects, which mainly manifest as lipid metabolic changes and lipodystrophy (22-26).
Another non-mutually exclusive explanation for the increased risk for these conditions is a chronic HIV-induced inflammatory state (27-29). which can be characterized by numerous immune activation markers, such as elevated levels of plasma interleukin 6 (IL- 6), soluble tumor necrosis factor receptor I and II , soluble CD14, the ratio of kynurenine- to-tryptophan, the levels of CD38+ CD+T cells, the ratio of CD4/CD8 and the levels of D-dimer (30-35).
However, this persistent, low-grade inflammation that is triggered by multiple factors (e.g., viral co-infections with hepatitis B, C virus, CMV, microbial translocation and lifestyle factors, such as intravenous drug use), likely has the pathogenesis of HIV- induced immune dysregulation (18, 27, 28). In addition to the immunocompromising effect of CD4 depletion, ongoing HIV replication and viral proteins represent a strong immune activating signal that results in numerous changes in nearly all of the cellular and non-cellular components of the immune system (27).
The function of HIV-infected CD4 cells is greatly altered early in the course of HIV infection, prior to any detectable numerical decline (36).In contrast, Tregs are relatively preserved, which likely limits immune activation while inhibiting antiviral responses (37). While Treg cell activation may promote tissue fibrosis, it may also contribute to the observed higher rates of lymph node and liver fibrosis in HIV patients (38).
Gut-associated lymphoid tissue (GALT) is the predominant site of HIV replication, and intestinal Th17 and lamina propria CD4 cells are especially affected and rapidly decrease in individuals living with HIV, even in the early stages of infection (39, 40). GALT is the largest lymphoid organ affected by HIV infection, and its dysregulation has a deleterious effect not only on lymphocytes but also on the number and functionality of epithelial tight junctions, resulting in destruction of the gastrointestinal mucosal barrier (41, 42).
Bacterial metabolites and endotoxins are therefore chronically introduced into the bloodstream, resulting in and maintaining a strong proinflammatory environment (27, 42, 43).
9
Together with CD4 Th-cell depletion, the mixed effects of immune depletion and activation result in immune dysfunction, which is thought to be responsible for a chronic inflammatory state with various organ involvement that is often considered to be age- related or metabolic (28, 29).
The idea that chronic, ongoing inflammation is known to play an important role in several long-term pathologic conditions, including carcinogenesis, and has a long history; it was originally described by Virchow in 1863 (44). To date, the importance of the inflammatory state has not only been identified in other types of malignancies, such as gastric MALT lymphoma (45) or diffuse large B-cell lymphoma arising from cryoglobulinemic polyclonal B-cell activation in HCV-infected patients (46-48) but also in the pathogenesis of atherosclerosis and other age-related and metabolic conditions (49).
Therefore, the initiation of early treatment seems to be appropriate for preventing viral replication and the consequent inflammatory state, which results in an increased incidence of non-AIDS defining malignancies and other age-related conditions (50). However, ART-related toxicity and unfavorable metabolic changes remain concerning (51).
The debate about the importance of ART-related toxicities versus ongoing viral replication, chronic inflammation and associated non-AIDS-defining morbidities seems to have ended. The recently published and early terminated INSIGHT START study has provided the most important evidence supporting the idea that control of viral replication, regardless of CD4 counts, is beneficial for patients, outweighing the concerns of ART toxicities. In that trial, participants (HIV-infected individuals with more than 500 CD4 cells per cubic millimeter) were randomized into two different groups. The immediate group received ART immediately, and the deferred group received ART only if the CD4 counts fell below 350 CD4 cells per cubic millimeter. The composite endpoint of non- AIDS-related SAEs was significantly lower in the immediate ART group, with a hazard ratio of 0.61 (95% CI, 0.38 to 0.97; p=0.04) (52). Justified mainly by these results, current major guidelines recommend the initiation of ART regardless of CD4 counts (53, 54), providing benefits not only at the individual level but also at an epidemiological level by reducing transmission (55).
However, concerns regarding complications from long-term ART toxicities, especially in the case of older ART, have not been completely resolved. For example, a substudy of
DOI:10.14753/SE.2017.2035
10
INSIGHT START reported that hip and spine bone mineral density loss was significantly higher in the immediate group than in the deferred group (56).
In low and middle income countries, in which the newest antiretroviral combinations are not always available or affordable, older drugs with less favorable toxicity profiles also contribute to the armamentarium against HIV. In Hungary, a significant proportion of patients receive zidovudine, lamivudine and tenofovir-containing combinations, or they have a history of treatment with older NRTIs or protease inhibitors (PIs) (Sulyok, unpublished 2015). Therefore, although no published data are available, there is likely a high proportion of patients with metabolic complications. In general, little is known about comorbidities of the Hungarian HIV-infected population. To date, only a few studies were published, focusing mainly on infectious complications (57-59).
In our study, we intended to shed light on hepatic conditions among non-AIDS-defining morbidities in the Hungarian HIV-infected population. Liver disease has become one of the most important causes of morbidity and mortality in individuals living with HIV (60), and liver-related deaths occur ten times more frequently in these individuals than in the general population (61). While hepatitis B or C co-infections remain the most significant cause of liver damage, liver-related mortality also affects those infected only with HIV (4, 62). Long-term antiretroviral and non-antiretroviral medications, HIV-induced long- term inflammation, metabolic complications and direct cytopathic effects may also contribute to liver damage and hepatotoxicity (63). While an increasing number of papers has been published on HIV/hepatitis virus co-infected patients (64-81), only a few studies have analyzed the data obtained from HIV-mono-infected individuals (3, 82-92). In addition to fibrosis, there has been increasing concern about the role of non-alcoholic fatty liver disease (NAFLD) and non-alcoholic steatohepatitis (NASH) (93). The pathogenesis of hepatic steatosis is still incompletely understood, and multiple factors have been hypothesized to be necessary for its development and progression (94).
NAFLD is the most common cause of liver disease worldwide, representing an enormous disease burden with an estimated prevalence of 25.24% (22.10-28.65). NAFLD is fueled by the global obesity epidemic (95).
Based on histology, NAFLD is divided into 2 categories (96, 97). Non-alcoholic fatty liver (NAFL) includes patients with hepatic steatosis with absent or mild inflammatory
11
changes (96). The rate of progression to liver cirrhosis is approximately 4%, but in a less well-defined subgroup of patients presenting with hepatic inflammation (but not fulfilling the criteria of NASH), this figure could be higher (98, 99). Non-alcoholic steatohepatitis (NASH) is characterized by hepatocellular injury and ongoing fibrosis, in addition to liver steatosis (96), and it is estimated to occur in 6% of the general US population (100). In contrast to NAFL, NASH is a more progressive condition, resulting in cirrhosis in an estimated 20% of cases (99). Moreover, NAFLD patients have an overall increased risk not only of liver-related mortality but also of malignancies and cardiovascular events (97).
The most important risk factors that are also involved in the pathogenesis of NAFLD are obesity and other metabolic factors, such as insulin resistance (101). However, numerous genetic, environmental and hormonal factors play an important role in the development of this condition (97, 101). Increased visceral adipose tissue generates a chronic inflammatory state and altered lipid and glucose metabolism (101). The ongoing lipotoxicity and proinflammatory state results in hepatic fat accumulation, hepatocellular damage and fibrosis (97). Why some patients only develop liver steatosis while others develop a marked inflammatory response that can result in cirrhosis or carcinogenesis remains unclear. Alterations in the intestinal microbiota appear to contribute to this difference and may be linked to the severity of NAFLD (102).
Currently, the gold standard for the diagnosis and assessment of HS is liver biopsy (LB) (103). Limiting factors of LB are cost and rare, but severe, complications, with the additional concerns of sampling error and difficulties related to reproducibility (104, 105). Furthermore, LB allows only semiquantitative grading. Given the high proportion of individuals with NAFLD in the general population, an invasive method, such as liver stiffness (LS), with possible life-threatening complications is impractical for diagnosis.
Therefore, increasing attention has been paid to numerous non-invasive methods.
Traditional radiologic approaches such as computed tomography (CT) and magnetic resonance imaging (MRI) for HS assessment have also been investigated, but their high cost, limited availability and lack of standardization prevent their widespread use (106).
Another non-invasive and recently developed tool is the controlled attenuation parameter (CAP), which has demonstrated accurate and reliable measurement of HS and has been successfully validated in different patient groups (107, 108). CAP is based on ultrasound
DOI:10.14753/SE.2017.2035
12
attenuation by hepatic fat at the central frequency of the FibroScan M probe and is performed simultaneously with liver stiffness measurements (107).
The evaluation and grading of liver fibrosis is facing similar problems to those observed with hepatic steatosis. Large-scale screenings using LB in patient populations in which the benefit of the assessment of fibrosis is not well-established, such as in HIV-mono- infected individuals, is also impractical and places the subjects at risk of potentially life- threatening complications. However, additional data concerning liver fibrosis in this patient population are urgently needed.
Cross-sectional studies in HIV-mono-infected patients have reported high rates (8.3- 41.9%) of significant liver fibrosis, suggesting that HIV itself may contribute independently to liver damage (63). To date, only limited data are available on the prevalence and risk factors for liver fibrosis among HIV-mono-infected patients. Viral replication, low CD4 cell counts and long-term exposure to antiretroviral regimes have been identified as risk factors for the development of significant liver fibrosis (62, 63, 109). Like hepatic steatosis, ongoing liver fibrosis is not always accompanied by elevated liver enzymes and a diagnosis of liver fibrosis. The prevention of progression to liver cirrhosis is an important challenge. As a result, adequate monitoring strategies for liver disease are needed to optimize the care of HIV-infected individuals (62, 63).
Noninvasive fibrosis determinations, such as liver stiffness measurements (LSM) with transient elastography, the aspartate aminotransferase (AST)-to-platelet ratio index (APRI) and the FIB-4 score, have facilitated cross-sectional and prospective studies to evaluate the prevalence and incidence of liver fibrosis in HIV-infected individuals. These tests are appropriate for predicting the absence of fibrosis or mild fibrosis (liver fibrosis
<2 METAVIR score) and the presence of advanced fibrosis (liver fibrosis >3 METAVIR score) (110). Liver stiffness, which is a value that describes the grade of liver fibrosis, is also simultaneously determined by the CAP measurement using transient elastography.
Therefore, LSM seems to be a practical method for evaluating liver diseases, especially in individuals living with HIV. To date, only a few studies using LSM have examined the prevalence and potential risk factors for hepatic fibrosis among HIV-mono-infected patients. The use of different cutoff values has resulted in a wide range of prevalence estimates (84, 85, 88, 90, 109).
13
While the main pathogenic factors resulting in the development of NAFLD are similar to the ones involved in the development of non-AIDS-defining morbidities in HIV-infected patients, such as chronic inflammation and microbiome changes (43, 101), an increased prevalence in the HIV-infected population is expected. ART may also contribute to hepatotoxicity. Older ART drugs (protease inhibitors and dideoxynucleoside analogs) cause hypertriglyceridemia and lipodystrophy and are considered to be especially harmful (76),(111). Furthermore, people living with HIV are vulnerable to environment-related hepatotoxic factors, such as alcohol consumption, illicit drug use, smoking and mental illnesses that require possible psychiatric medication (112-115). It should be emphasized that patients with normal liver enzymes can still have significant steatosis and fibrosis.
Thus, early detection of HS in HIV-infected patients is the cornerstone of prevention of the silent progression of NAFLD to NASH and cirrhosis (116).
Surprisingly, data from this population are relatively scarce and are limited almost exclusively to hepatitis-co-infected subpopulations. To the date of the publication our first results (117), the only study that assessed HS with CAP in a large population of HIV patients is the one reported by Macías et al., who identified significant HS in 40% of the participants, and 60% of the study population was co-infected with HCV (74). Therefore, data from an unselected group of individuals living with HIV, including HIV-mono- infected patients, are urgently needed to develop better caring and treatment strategies for PLWH with NAFLD. To achieve this goal, the problem of selection and switching of ART in this population should be addressed. However, to our knowledge, the desperately needed large-scale prospective studies and clinical trials that focus on patients with NAFLD and HIV infection have not been performed.
As a first step, epidemiologic, cross-sectional studies are needed to better characterize the prevalence and disease burden. Therefore, we designed and performed a cross-sectional study in an unselected group of individuals living with HIV to assess the prevalence of NAFLD and to identify associated factors. The aim of our study was to assess the prevalence and severity of HS using a continuous CAP value in PLWH and to determine the association with different demographic, immunologic and metabolic factors. Given that the data for liver fibrosis in the HIV-mono-infected population are also limited, we planned to perform a predefined subgroup analysis in this patient population. In contrast
DOI:10.14753/SE.2017.2035
14
to the few published similar studies (84, 85, 88, 109, 118), we planned to use a continuous scale of LS and CAP values as regression endpoints to avoid the information loss and uncertainty that arises from cutoff values adopted from other patient populations (117).
15
2 Study objectives
2.1 Primary objectives
To identify a proportion of significant hepatic steatosis in individuals living with HIV
To determine the associations between antiretroviral agents and hepatic steatosis in individuals living with HIV
To determine the associations between HIV-related immunologic parameters and hepatic steatosis in individuals living with HIV
To determine the associations between metabolic parameters and hepatic steatosis in individuals living with HIV
2.2 Secondary objectives
To characterize the metabolic profile of the Hungarian HIV-infected population
To identify a proportion of significant hepatic fibrosis HIV-mono-infected individuals
2.3 Exploratory objectives
To determine the associations between antiretroviral agents and hepatic fibrosis in HIV-mono-infected individuals without significant alcohol consumption
To determine the associations between HIV-related parameters and hepatic fibrosis in HIV-mono-infected individuals without significant alcohol consumption
To determine the associations between metabolic parameters and hepatic fibrosis in HIV-mono-infected individuals without significant alcohol consumption
DOI:10.14753/SE.2017.2035
16
3 Methods
3.1 Study population
The investigation was performed in accordance with the Helsinki Declaration and was approved by the Institutional Ethics Committee (approval number 34/EB/2013). From March 1, 2014 to October 30, 2014, all HIV-infected patients who attended the outpatient clinic at the HIV Center, St. Laszlo Hospital, Budapest, Hungary were invited to participate in the study. Patients were recruited by dedicated members of the study team during outpatient visits. Informational brochures were placed in the waiting hall of the HIV center, with the agreement of the proprietor.
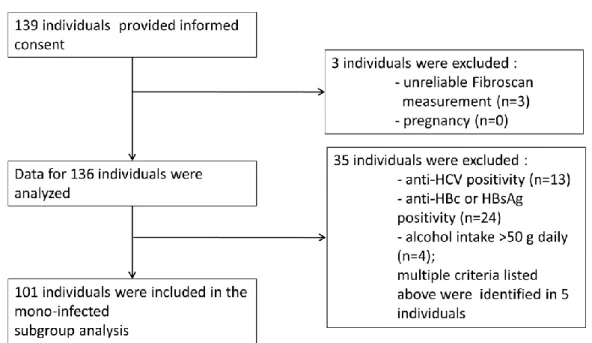
After providing written informed consent, individuals older than 18 years of age were enrolled in the study (n=139, intended to treat population). Pregnant women and patients with unreliable transient elastography measurements (<10 valid measurements) were excluded. Taking these criteria into account, the final study population consisted of 136 individuals (per protocol population, Figure 1.). Following enrollment, all data were pseudonymized. The volunteers received an identification number, and no names, addresses, initials or other information that might identify the participant were stored in the database. Separate confidential files containing identifiable information were stored in secured locations that only the investigators and dedicated members of the study team could access.
Participation was entirely voluntary, and participants could verbally withdraw their consent from the study at any time without providing further explanation. Volunteers received an official copy of their own transient elastography results. Other forms of compensation were not provided.
A prespecified subgroup analysis of HIV-mono-infected individuals without documented or suspected significant alcohol consumption (defined by >50 g alcohol daily) was also performed. This subgroup consisted of 101 participants.
17
Figure 1. Recruitment Flow of the Study Participants.
3.2 Interview and clinical parameters
Interviews with the participants were conducted at the Hepatology Center of Buda, Budapest, Hungary, on the same day as the transient elastography. Information regarding the medical history was collected, including comorbidities, concomitant medications, mode of HIV transmission, known length of HIV positivity, history of antiretroviral therapy, alcohol and illicit drug intake and smoking habits. Anthropometric parameters, such as height, weight, gender, BMI and assessment of facial lipodystrophy, were gathered by an investigator experienced in HIV medicine. Facial lipodystrophy was assessed according to the FLA severity score using the 5-point Carruthers scale (119).
The presence of facial lipodystrophy was defined according to a FLA severity score of 2 (deeper and longer central cheek atrophy, with the facial muscles beginning to show through) or higher (in grade 3, the atrophic area is even deeper and wider, with the
DOI:10.14753/SE.2017.2035
18
muscles clearly showing; in grade 4, atrophy covers a wide area and extends up toward the orbit, with the facial skin lying directly on the muscles over a wide area) (119).
Information obtained during the interviews regarding comorbidities, concomitant medications and history of antiretrovirals was also checked retrospectively in the patients’
archived documentation. In the case of discrepancies between the written and oral information, a consultation with the patient’s HIV specialist was initiated.
Biochemical and immunological parameters, serum cholesterol, serum triglyceride, blood count, CD4 and CD8 count, CD4/CD8, anti-HCV, HBsAg and anti-HBc serology were collected at the visit when informed consent was obtained (<4 weeks before the Fibroscan measurement).
3.3 Transient elastography
Vibration controlled transient elastography (VTCE) is a non-invasive method to quantify liver fibrosis. This technique uses both ultrasound (5 MHz) and low-frequency (50 Hz) elastic shear waves, with a propagation velocity that is related to tissue elasticity (120).
Liver elasticity, or stiffness, is expressed in kPa and is equal to the Young-modulus of the examined tissue, or E=3ρv2, where v is the shear velocity and ρ is the tissue density. The stiffer the tissue, the faster the shear wave propagates (121). Details of the technical background have been previously described (120). VTCE to assess hepatic fibrosis has been validated in different patient populations (122-132). VTCE is approved by the FDA (133) and is recommended by different international and national guidelines (121, 134, 135), e.g., Hungarian consensus guidelines for viral hepatitis (136, 137).
Controlled attenuation parameter measurements based on vibration controlled transient elastography were also simultaneously performed. CAP is the name of the algorithm that assesses the ultrasonic attenuation coefficient based on the ultrasonic properties of the radiofrequency back-propagated signals, or more precisely, it is an estimate of the total ultrasonic attenuation (go-and-return path) at 3.5 MHz (108). Technical details and validation with histological findings have also been extensively described (107, 108, 138).
19
To date, the CAP measurement has been validated for the diagnosis of hepatic steatosis in different patient groups (107, 134, 138-142). In NAFLD, this method is considered to be especially helpful (143-147). The inter-observer concordance of CAP has been demonstrated in HIV-infected individuals (148).
A cutoff of 238 dB/m was selected to define the presence of hepatic steatosis (S1), and cutoff values for more advanced steatosis of 260 dB/m (S2) and 292 dB/m (S3) have been applied (108). Because these cutoffs were adopted from a non-HIV-infected population, they cannot be reliably transferred to an HIV-infected population (117). Therefore, despite the defined cutoff values, for the univariate and multivariate analyses, a continuous scale of CAP values was used.
A similar problem was encountered for the liver stiffness cutoffs. Only a few studies using LS measurements have examined the prevalence and potential risk factors for hepatic fibrosis among HIV-mono-infected patients. Using different cutoff values resulted in a wide range of prevalence estimates (84, 88). Pre-defined cutoffs adopted from the HIV/HCV-co-infected population (significant liver fibrosis defined by liver stiffness >7.2 kPa and 14.6 kPa to identify the presence of cirrhosis) may lead to an underestimation of the number of HIV-mono-infected patients with clinically significant fibrosis because these cutoffs were determined for a population in which ongoing fibrosis is triggered by HCV co-infection (84, 149). A recently published observational study concluded that in HIV-mono-infected adults with biopsy-proven liver disease, LSM by VCTE is the best noninvasive method to predict fibrosis (85). However, LSM (with a cutoff value of 7.1 kPa) was performed in only 59 participants with elevated baseline aminotransferase levels.
However, using cutoffs from the general population in HIV-mono-infected individuals (84) may overestimate the prevalence of significant liver fibrosis.
To overcome this limitation, we used a continuous scale of LS values to interpret this variable in the uni- and multivariate analyses. To characterize the patient population, cutoffs both from the HIV/HCV population and the ones adopted from the normal population (84) were used.
DOI:10.14753/SE.2017.2035
20
Transient elastography examination and CAP measurements were performed by an experienced and qualified investigator at the Hepatology Center of Buda, Budapest, Hungary, using FibroScan 502 equipment (Fibroscan, EchoSens™, Paris, France).
Measurements were performed using an M probe on the right lobe of the liver. Patients were placed in a supine position, with their right arms elevated behind their heads. The tip of the probe was placed in an intercostal region with contact gel in the 9th - 11th intercostal space on the right side. The examining investigator utilized a time-motion image that located the liver tissue (regions with large vessels were avoided), and measurements were collected. The software determined whether a measurement was valid. Examinations with 10 successful shots and an interquartile range (IQR) for liver stiffness less than 30% of the median value and a success rate (the ratio of valid shots to the total number of shots) above 60% were considered reliable and successful (118, 121, 150).
Figure 2. Staging of liver fibrosis according to liver stiffness values in liver disease.
The different stages are coded in colors. Transient zones, such as F1/2 or F2/3, are shown in gradient colors. The large variation between the liver fibrosis grading in different patient populations is evident.
¶: Recurrence after liver transplantation 1: (132); 2: (130); 3: (131)
21 3.4 Sample size considerations
The sample size was calculated a priori using the function nBinomial in the gsDesign package of R software package version 3.1.2 (151). Regarding the first primary objective, to show with a power of 80% and a two-tailed alpha of 5% that significant HS is present in 25% of ART naive participants and 65% of ART experienced individuals (if an estimated 10% of the volunteers are ART naïve), the minimum participant number was calculated to be 132. If metabolic conditions (diabetes, hypertension, obesity) are estimated to be present in every third individual, and in this patient group the proportion of significant HS is also estimated to be 65%, then with 25% of the subjects lacking metabolic conditions, the required participant number is 64, with a power of 80% and a two-tailed alpha of 5%. The same estimation was applied to the third primary objective regarding immune dysregulation. Overall, the first and most stringent calculation was used, and the minimum number of 132 participants was utilized.
3.5 Statistical analysis
The primary outcome variable was the CAP value. The associations of the following factors were analyzed: sex, age, time from diagnosis of HIV infection, CD4 and CD8 cell counts, BMI, self-reported daily alcohol intake, smoking habits, fasting lipid profile (total cholesterol, triglycerides), blood pressure and ART exposure. The univariate association of CAP with categorical variables was assessed using a two-independent-sample Mann- Whitney U test. Stratified descriptive statistics are presented as the mean (median) ± SD (IQR) [min-max]. The univariate correlation of CAP with continuous variables was assessed using the Pearson (linear) and Kendall-τ rank-correlation coefficient.
Visualization was performed with scattergrams, which indicated the best fitting linear curve and LOWESS-smoother for non-parametric regression. Cramér’s V was used to describe multiple associations between categorical data and was visualized as a Circos plot (152). Bonferroni correction was performed to counteract problems related to multiple comparisons.
DOI:10.14753/SE.2017.2035
22
For the multivariate analysis, prespecified covariates were added to a linear regression model, with the CAP value as the response variable, as described by Sulyok et al. (117).
Alterative models with predictor selection based on collinearity diagnostics and with a combined covariable of “Metabolic unfavorable antiretroviral therapy ever taken,” which was defined based on a history of taking ritonavir-boosted lopinavir and/or zidovudine with a binary outcome, was introduced instead of different antiretroviral medications. In this analysis, the covariates serum triglyceride, cholesterol and HBV positivity (defined by HBsAg or anti-HBc positivity) were added to the model. A prespecified, but unpublished, subgroup analysis in HIV-mono-infected individuals without significant alcohol intake was also performed as described above using liver stiffness as the response variable. No interaction was added to the models. Categorical variables were added with Male/No as the reference category. The necessity of non-linearity was investigated by extending the model using restricted cubic splines for the continuous variables and the Wald-F test to assess joint significance. Aikake, Hurvich and Tsai’s corrected Aikake and Bayes Information Criterion was used to determine the necessity of model penalization.
The obtained model was checked and passed routine residual diagnostics. To internally validate the model, a calibration curve and optimism-corrected R2 were calculated using the bootstrap method with 1000 replications (153). p-values less than 0.05 were considered significant. Multicollinearity diagnostics were also performed in the non- penalized models, and a variance inflation factor >10 was considered to indicate a high degree of multicollinearity. Calculations were performed using R software package version 3.1.2 (151) and library rms, with a custom script that is available upon request.
23
4 Results
4.1 Study population characteristics
. Significant steatosis (>238 dB/m) was observed in 65 (47.8%) patients. Twenty-five (18.38%) patients had stage 1, 16 (11.75%) stage 2 and 24 (17.65%) stage 3. The median liver stiffness was 5.2 kPa (IQR 2). Fifty-two (36.76%) patients had a BMI greater than 25 kg/m2, and obesity (defined by a BMI greater than 30 kg/m2) was identified in 6 (4.55%) individuals. Hypertriglyceridemia (serum triglyceride levels >1.7 mmol/L) was detected in 57 (41.92%) patients, and hypercholesterolemia (serum cholesterol levels
>5.2 mmol/L) or low serum HDL-C levels (<1 mmol/L in men, < 1.3 in women) were observed in 67 (49.26%) individuals. The mode of HIV transmission was reported to be sexual intercourse in 134 (98.5%) patients and transfusional or coagulation factor product in 2 (1.5%) individuals with hemophilia. Intravenous drug use was not reported by any patients. The study population characteristics are summarized in Table 1.
Anti-HCV antibodies were detected in 13 (9.56%) individuals. Eight patients had S0 stage HS, 2 had S1 and 3 had S3. The median CAP value was 237 dB/m and 216 dB/m in individuals without anti-HCV antibodies. HBsAg was observed in 11 (8.1%) study participants. The median CAP did not differ significantly between patients with (237 dB/m) and without (238 dB/m) HBsAg positivity. Five (2.94%) individuals reported more than 50 g of daily alcohol intake. One hundred and twenty-five patients were taking antiretroviral medication regularly, and 11 were treatment naive at the time of enrollment.
In the subgroup of 11 naive patients, 4 (36.4%) had CAP values greater than 238 dB/m, and none had stage 2 or stage 3 steatosis. Compared with the ART-exposed patients, among which 66/125 (52.8%) had significant steatosis, 26/66 (39.4%) had stage 2 steatosis and 28/66 (42.4%) had stage 3 steatosis (p=0.465). The associations between antiretrovirals are shown in Figure 3.
DOI:10.14753/SE.2017.2035
24
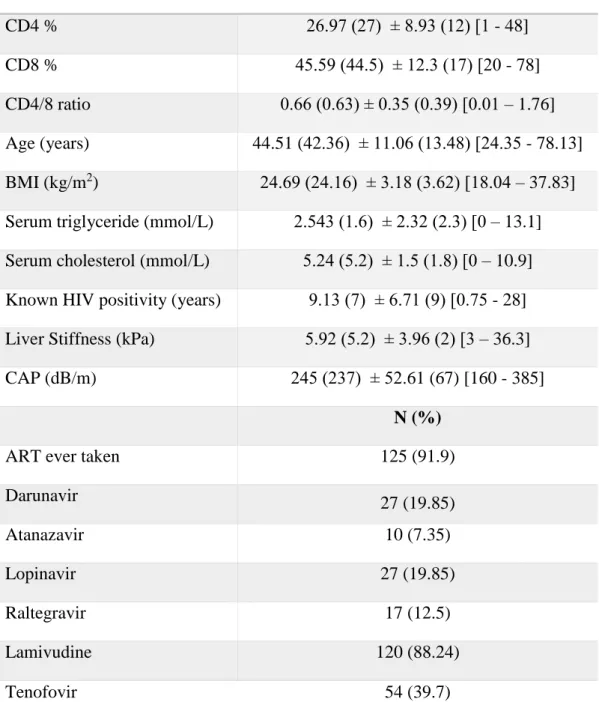
Table 1. Study population characteristics. BMI: body mass index; CAP: controlled attenuation parameter; ART: antiretroviral therapy
Parameter Mean (Median) ± SD (IQR) [Min-Max]
CD4 % 26.97 (27) ± 8.93 (12) [1 - 48]
CD8 % 45.59 (44.5) ± 12.3 (17) [20 - 78]
CD4/8 ratio 0.66 (0.63) ± 0.35 (0.39) [0.01 – 1.76]
Age (years) 44.51 (42.36) ± 11.06 (13.48) [24.35 - 78.13]
BMI (kg/m2) 24.69 (24.16) ± 3.18 (3.62) [18.04 – 37.83]
Serum triglyceride (mmol/L) 2.543 (1.6) ± 2.32 (2.3) [0 – 13.1]
Serum cholesterol (mmol/L) 5.24 (5.2) ± 1.5 (1.8) [0 – 10.9]
Known HIV positivity (years) 9.13 (7) ± 6.71 (9) [0.75 - 28]
Liver Stiffness (kPa) 5.92 (5.2) ± 3.96 (2) [3 – 36.3]
CAP (dB/m) 245 (237) ± 52.61 (67) [160 - 385]
N (%)
ART ever taken 125 (91.9)
Darunavir 27 (19.85)
Atanazavir 10 (7.35)
Lopinavir 27 (19.85)
Raltegravir 17 (12.5)
Lamivudine 120 (88.24)
Tenofovir 54 (39.7)
25
In the subgroup of HIV-mono-infected patients without significant alcohol consumption (n=101), LS ranged from 3.0 kPa to 34.3 kPa, with a median value of 5.1 kPa (IQR 1.7).
According to the HIV/HCV co-infection LS cutoffs, significant liver fibrosis, defined as LS <7.2 kPa, was detectable in 10/101 individuals. The presence of cirrhosis (LS >14.6 kPa) was observed in 2 participants. Applying the cutoff value of 5.3 kPa from a healthy population as described in the study by Han et al., significant fibrosis was detected in 56/101 patients. CAP values in this subgroup ranged from 165 dB/m to 385 dB/m, with a median of 239 dB/m (IQR 74). Fifty-three (52.47%) participants had significant liver steatosis. Stage 1 steatosis was detected in 20 (19.8%) patients, stage 2 in 9 (8.91) and stage 3 in 24 (23.76%). The median BMI was 24.74 (IQR 3.32). A BMI greater than 25 kg/m2 was found in 45 patients, and obesity was present in 5 patients. Age ranged from 24.35 to 71.33 years (median 42.36, IQR 13.4), and 99/101 (98.01%) participants were male. The median CD4% was 29 (IQR 11, min-max 1-46), median CD8 was 44 (IQR 17, min-max 20-78) and CD4/8 ratio was 0.6383 (IQR 0.4502, min-max 0.01282-1.76). The median known disease duration was 7 years (IQR 9, min-max 0.75-25). Eleven patients
Abacavir 20 (14.7)
Zidovudine 47 (34.55)
Etravirine 9 (6.62)
Nevirapine 29 (21.32)
Efavirenz 33 (24.26)
Isolated anti-HBc positivity 13 (9.56)
anti-HCV positivity 13 (9.56)
HBsAg positivity 11 (8.08)
Smoking 16 (11.75)
Alcohol intake (>50g daily) 4 (2.94)
Sex (male) 133 (97.8)
Diabetes 13 (9.56)
Hypertension 29 (21.32)
Lipodystrophy 13 (9.56)
DOI:10.14753/SE.2017.2035
26
were diabetic, 21 had hypertension, and facial lipodystrophy was identified in 12 individuals. The number of ART-experienced participants was 92 (91.09%). Twenty (19.8%) patients were taking darunavir, 7 (6.93%) atanazavir, 26 (25.74%) lopinavir, 8 (7.92%) raltegravir, 9 (8.91%) etravirine, 22 (21.78%) nevirapine, 27 (26.73%) efavirenz, 38 (37.62%) tenofovir, 13 (12.87%) abacavir, 39 (38.61%) zidovudine and 89 (88.11%) lamivudine. There were no significant differences in any of the parameters between this subgroup and the total study population.
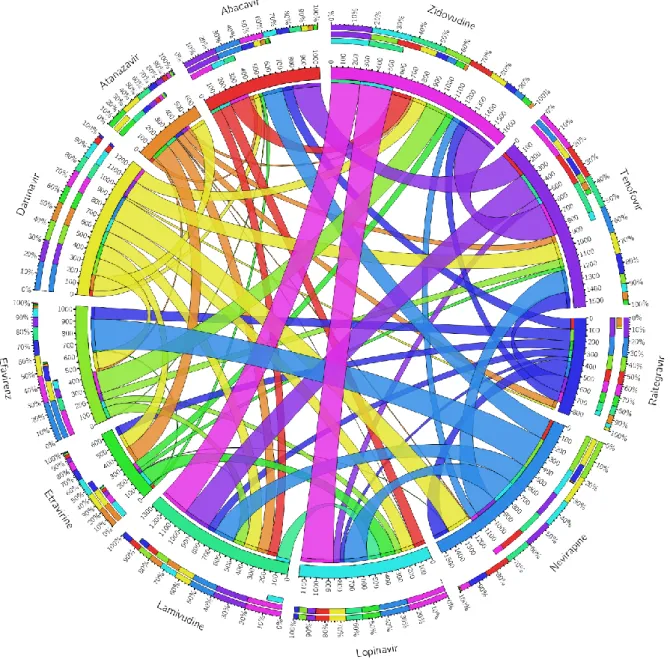
Figure 3. Associations between antiretroviral medications (ever taken) in the whole study population. The 11 most frequent antiretrovirals are coded in different colors.
27
Associations are expressed as Cramér’s V value x 1000 and are displayed as ‘two-way chords’ between the antiretroviral panels. The thickness of the cords, denoting the strength of the association, is presented numerically for the inner ring and displayed as color-coded percentages for the outer rings. The only association that was found to be statistically significant after Bonferroni-correction was between zidovudine and tenofovir (Cramér’s V value: 0.305, p<0.001.)
4.2 Univariate analysis of the association between the CAP value and different variables
The examined continuous variables showed a strong association with the CAP value following the Pearson and Kendall-τ-rank correlation. According to the Bonferroni- correction, the associations of age (adjusted p<0.001), serum triglyceride (adjusted p<0.001), BMI (adjusted p<0.001) and disease duration (adjusted p<0.001) using the Pearson and Kendall-τ-rank correlation and liver stiffness with the Kendall-τ-rank correlation were considered significant (adjusted p<0.001). The association was only negative for the CD8 percentage. Among the categorical variables, the presence of hypertension was considered to be significant (adjusted p<0.001). Associations of the CAP value and different continuous and categorical variables assessed by univariate analysis are shown in Table 2. Figure 4 presents the assessed correlation of continuous variables with the CAP value in graphical form.
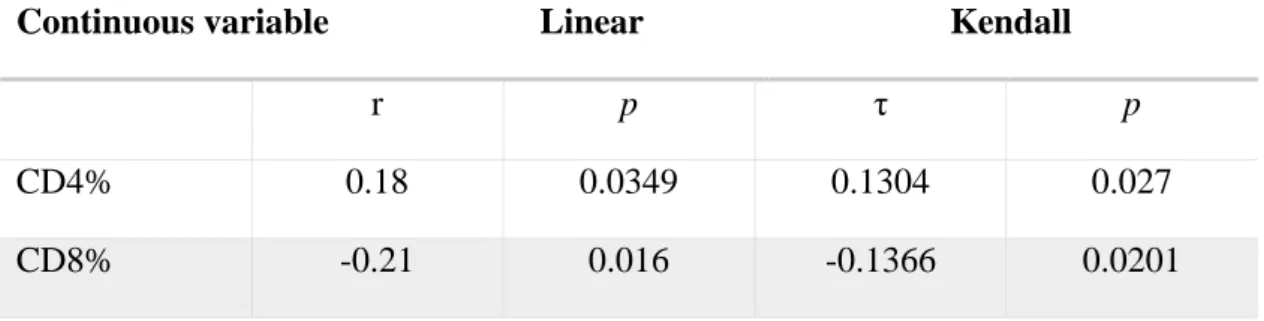
Table 2. Univariate analysis: associations between the CAP value and continuous (panel A) and categorical (panel B) variables.a Results are presented as the mean (median) ± SD (IQR) [min-max]; The p-value pertains to the null hypothesis of no correlation; p-values are unadjusted; BMI: body mass index; CAP: controlled attenuation parameter; ART: antiretroviral therapy; Lipodystrophy: facial lipodystrophy
Continuous variable Linear Kendall
r p τ p
CD4% 0.18 0.0349 0.1304 0.027
CD8% -0.21 0.016 -0.1366 0.0201
DOI:10.14753/SE.2017.2035
28
Continuous variable Linear Kendall
r p τ p
CD4/8 ratio 0.2 0.0199 0.1435 0.0136
Age 0.39 <0.001 0.2456 <0.001
BMI 0.5 <0.001 0.3544 <0.001
Triglyceride 0.35 <0.001 0.2202 <0.001
Cholesterol 0.25 0.0036 0.1693 0.0042
Disease duration
0.36 <0.001 0.2363 <0.001
Liver stiffness 0.18 0.041 0.2076 <0.001
Panel B. Results are presented as the mean (median) ± SD (IQR) [minimum–maximum].
The p-value pertains to the null hypothesis of stochastic equivalence for the two populations (presence/absence). p-values are unadjusted.
a Antiretroviral therapy
Categorical Presence of variablea
Absence of variablea p-value
Darunavir 247 (237) ± 54.4 (64) [79 - 304]
236.9 (237) ± 44.7 (71.5) [171 - 332]
0.502
Atanazavir 243 (237) ± 51.3 (64.5) [160 - 385]
269.9 (263.5) ± 64.9 (89.25) [108 - 287]
0.185
Raltegravir 245.5 (238) ± 51.5 (63) [79 - 304]
241.9 (216) ± 61.8 (51) [92 - 297]
0.457
Etravirine 243.8 (237) ± 52.1 (66) [79 - 304]
262.6 (249) ± 60.2 (98) [116 - 287]
0.358
Nevirapine 243.8 (237) ± 54.3 (67.5) [160 - 385]
249.6 (239) ± 46.6 (49) [97 - 297]
0.394
Efavirenz 239.5 (235) ± 47.4 (58.5) [168 - 385]
262.2 (242) ± 64.2 (120) [79 - 287]
0.094
29 Categorical Presence of
variablea
Absence of variablea p-value
Tenofovir 247 (237.5) ± 52.9 (69) [79 - 297]
241.9 (237) ± 52.5 (68.5) [165 - 385]
0.553
Zidovudine 239.4 (237) ± 49.2 (65) [79 - 304]
255.7 (237) ± 57.7 (79) [92 - 297]
0.208
Lamivudine 222.9 (231.5) ± 45.1 (60.5) [87 - 254]
248 (238) ± 53 (71.5) [160 - 385]
0.087
Lopinavir 240.1 (234) ± 50.4 (67) [79 - 304]
265.1 (245) ± 57.4 (89.5) [185 - 378]
0.042
ARTa ever 247 (237) ± 53.7 (74) [79 - 304]
222.6 (236) ± 31.2 (32.5) [168 - 254]
0.264
HCV 244.4 (237) ± 51.7
(65.25) [160 - 385]
226.8 (216) ± 35.1 (47) [90 - 201]
0.320
HBV 246.16 (237) ± 53.78
(70) [79 - 304]
232 (238) ± 36.1 (64) [92 - 207]
0.632
Smoking 242.8 (237) ± 46.2 (57) [79 - 304]
235.6 (233.5) ± 50.1 (46.5) [92 - 287]
0.425
Alcohol 244.8 (237) ± 53.2 (66.25) [160 - 385]
251.5 (248) ± 29.2 (32) [140 - 208]
0.515
Sex 245.1 (237) ± 53.5
(66.5) [160 - 385]
244 (239) ± 22.6 (22) [132 - 191]
0.652
Diabetes 240.4 (236) ± 49.6 (61.5) [160 - 378]
288.6 (270) ± 62.3 (71) [121 - 304]
0.006
Hypertension 233.2 (229) ± 46.7 (49) [79 - 304]
279.5 (282) ± 49.8 (70) [107 - 297]
<0.001
Lipodystrophy 240.8 (237) ± 49.5 (62.25) [160 - 378]
281.5 (282.5) ± 66 (116.5) [118 - 304]
0.031 DOI:10.14753/SE.2017.2035
30
Figure 4. Correlations between continuous variables and the CAP value.
The black line shows the best fitting linear curve, and the halftone-line shows the LOWESS-smoother for the non-parametric regression. BMI: body mass index (kg/m2);
CAP: controlled attenuation parameter (dB/m). Age and length of known HIV positivity are expressed in years, serum cholesterol and triglyceride in mmol/L and liver stiffness in kPa.
31
4.3 Multivariate regression models that predict the CAP value
To identify significant covariates of the CAP value, a non-linear multivariate model was created using restricted cubic splines for the continuous variables. All examined parameters were entered into the model with the exception of smoking (33.09% of the values were missing) and gender (97.8% of the participants were male). The Wald-F test showed that joint non-linearity was not significant (p=0.1787); therefore, a linear model could be established. The regression showed a strong association with BMI . The associations with other covariates (diabetes, hypertension) were also significant.
Darunavir therapy as reported in the medical history was negatively associated with the CAP value. Covariates with their estimated regression coefficients and 95% confidence intervals are shown in Table 3 and are graphically presented in a Forest plot in Figure 5.
No significant collinearity was detected with the exception of the CD4/8 ratio (virtual influence factor 10.85). Although penalization was not deemed to be necessary (Figure 6), a large number of variables compared with the study population was concerning.
Therefore, model calibration and validation were performed, which revealed poor fitting of the model (shown in Figure 7). To address this problem, we penalized the model. As a result, BMI and hypertension remained significant. The estimated regression coefficients and confidence intervals are shown in Table 4 and are graphically presented in Figure 8. The penalized model calibration and validation are shown in Figure 9.
An alternative model after selection of the covariates revealed similar results. Based on variance inflation factors (VIFs; CD4% VIF=5.37; CD8%-VIF=4.8; CD4/8 ratio VIF=10.85), CD4% and CD8% were removed. A combined variable of “Metabolic favorable ART” with a binary outcome was introduced instead of the 11 covariates of different antiretrovirals. BMI (p<0.0001; regression coefficient: 6.208; 95% CI 3.736- 8.681), diabetes (p=0.0509; regression coefficient 22.599; 95% CI 2.344-42.854) and hypertension (p=0.0291; regression coefficient: 28.0479; 95% CI -0.1092-56.205) remained significant positive predictors, but triglycerides also exhibited a significant, independent association (p=0.0262, regression coefficient 3.964, 95% CI 0.477-7.451).
Significant negative predictors were not identified (Figure 10). Model fitting improved remarkably (R2 = 0.403; optimism-corrected R2 = 0.234), and non-linearity was not significant (p=0.907).
DOI:10.14753/SE.2017.2035
32
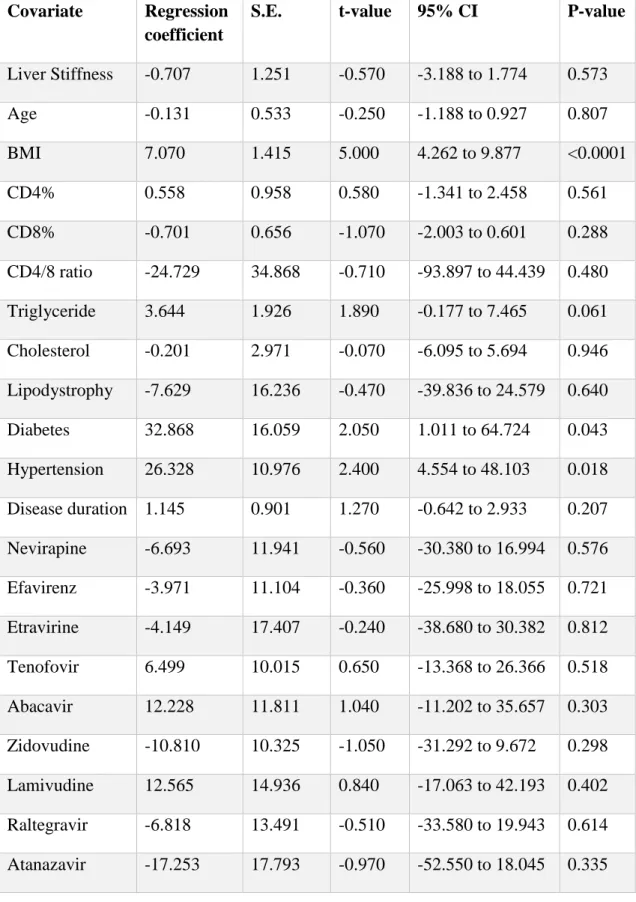
Table 3. Regression coefficients of covariates that predict the CAP value. S.E.:
standard error.
Covariate Regression coefficient
S.E. t-value 95% CI P-value
Liver Stiffness -0.707 1.251 -0.570 -3.188 to 1.774 0.573
Age -0.131 0.533 -0.250 -1.188 to 0.927 0.807
BMI 7.070 1.415 5.000 4.262 to 9.877 <0.0001
CD4% 0.558 0.958 0.580 -1.341 to 2.458 0.561
CD8% -0.701 0.656 -1.070 -2.003 to 0.601 0.288
CD4/8 ratio -24.729 34.868 -0.710 -93.897 to 44.439 0.480 Triglyceride 3.644 1.926 1.890 -0.177 to 7.465 0.061 Cholesterol -0.201 2.971 -0.070 -6.095 to 5.694 0.946 Lipodystrophy -7.629 16.236 -0.470 -39.836 to 24.579 0.640 Diabetes 32.868 16.059 2.050 1.011 to 64.724 0.043 Hypertension 26.328 10.976 2.400 4.554 to 48.103 0.018 Disease duration 1.145 0.901 1.270 -0.642 to 2.933 0.207 Nevirapine -6.693 11.941 -0.560 -30.380 to 16.994 0.576 Efavirenz -3.971 11.104 -0.360 -25.998 to 18.055 0.721 Etravirine -4.149 17.407 -0.240 -38.680 to 30.382 0.812 Tenofovir 6.499 10.015 0.650 -13.368 to 26.366 0.518 Abacavir 12.228 11.811 1.040 -11.202 to 35.657 0.303 Zidovudine -10.810 10.325 -1.050 -31.292 to 9.672 0.298 Lamivudine 12.565 14.936 0.840 -17.063 to 42.193 0.402 Raltegravir -6.818 13.491 -0.510 -33.580 to 19.943 0.614 Atanazavir -17.253 17.793 -0.970 -52.550 to 18.045 0.335
33 Covariate Regression
coefficient
S.E. t-value 95% CI p-value
Darunavir -29.914 12.585 -2.380 -54.879 to -4.949 0.019 Lopinavir 16.644 12.059 1.380 -7.278 to 40.566 0.171 HCV positivity -8.705 15.130 -0.580 -38.718 to 21.308 0.566 HBV positivity -2.244 11.131 -0.200 -24.325 to 19.837 0.841 Alcohol -11.426 24.403 -0.470 -59.835 to 36.984 0.641
Figure. 5. Multivariate analysis: covariates with regression coefficients and confidence intervals of the model predicting the CAP value.
The figure shows the regression coefficients of the covariates. For categorical variables, the change is understood as being the change to the modal category, and for continuous
DOI:10.14753/SE.2017.2035
34
variables, it is a change of 1 IQR. In each case, this is explicitly indicated by two values that are separated by a colon after the variable. BMI is expressed in kg/m2; age and length of known HIV positivity are expressed in years; and liver stiffness is expressed in kPa.
ART, antiretroviral therapy; CAP, controlled attenuation parameter (dB/m);
lipodystrophy, facial lipodystrophy. The thick dark blue lines represents 90% CIs, the thick light blue lines are 95% CIs and the narrow light blue lines are 99% CIs.
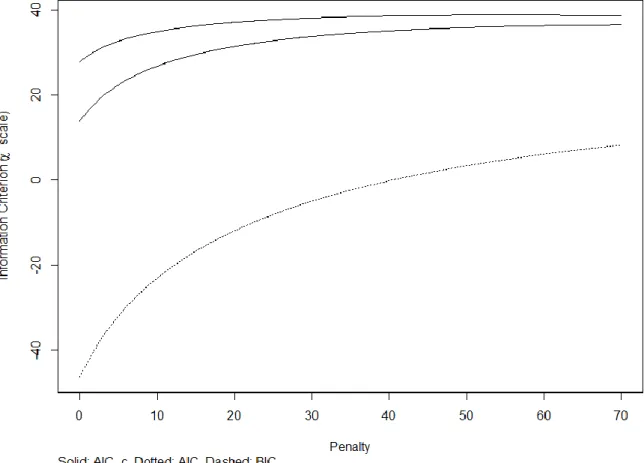
Figure 6. Information criterions for the multivariate model predicting the CAP value. Information criterions for the model predicting the CAP values are shown on the y-axis, and the degree of penalty is shown on the x-axis. The Aikake Information Criterion (AIC-upper curve), Hurvich and Tsai's corrected AIC (AIC_c-middle curve), and Schwarz Bayesian Information Criterion (BIC-lower curve) provided the lowest value without penalty.
35
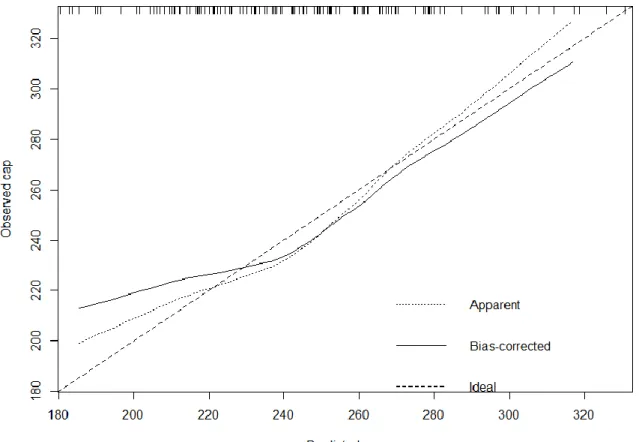
Figure 7. Bootstrap overfitting-corrected nonparametric calibration curve of the model predicting the CAP value. The horizontal axis is the prediction of CAP. The vertical axis is the observed CAP. The dashed line is the identity line. The dotted line is the apparent model performance. The solid line is the bias-corrected (overfitting- corrected) model performance. The optimism-corrected bootstrap validation with 1000 repeats displayed overfitting of the model (R2=0.4635, optimism corrected R2=0.0813).
Table 4. Regression coefficients of the covariates predicting the CAP value in the penalized model (R2=0.41, adjusted R2=0.322).
Covariate Regression coefficient
S.E: t 95% CI p-value
CD4% 0.064 0.409 0.160 -0.764 to 0.873 0.877
DOI:10.14753/SE.2017.2035
36
CD8% -0.231 0.294 -0.790 -0.813 to 0.35 0.433
Age 0.229 0.319 0.720 -0.401 to 0.856 0.474
BMI 3.940 0.996 3.960 1.969 to 5.910 <0.001
CD4/8 ratio 2.184 11.239 0.190 -20.053 to 24.422 0.846 Triglyceride 2.506 1.354 1.850 -0.171 to 5.185 0.067 Cholesterol 0.753 2.117 0.360 -3.435 to 4.942 0.723 Disease duration 0.611 0.537 2.160 -0.450 to 1.673 0.257 Liver Stiffness 0.359 0.802 0.450 -1.2265 to 1.945 0.655 Diabetes 19.097 11.136 1.710 -2.938 to 41.132 0.089 Hypertension 16.557 7.662 0.450 1.396 to 31.718 0.033 Lipodystrophy 3.397 11.027 0.310 -18.424 to 25.217 0.759 Darunavir -9.986 8.277 -1.210 -26.364 to 6.393 0.230 Atanazavir -2.841 12.724 -0.220 -28.021 to 22.338 0.824 Raltegravir -4.150 9.463 -0.440 -22.876 to 14.576 0.662 Etravirine -0.975 12.643 -0.080 -25.993 to 24.044 0.939 Nevirapine 1.397 7.698 0.180 -13.837 to 16.63 0.856 Efavirenz 0.459 7.420 0.060 -14.224 to 15.141 0.951 Tenofovir 2.086 6.585 0.320 -10.94 to 15.117 0.752 Abacavir 2.822 8.486 0.330 -13.971 to 19.615 0.740 Zidovudine -1.635 6.867 -0.240 -15.222 to 11.953 0.812 Lamivudine 5.698 9.851 0.580 -13.769 to 25.191 0.564 Lopinavir 8.807 8.132 1.080 -7.285 to 24.898 0.281 HBV positivity -2.810 8.061 -0.350 -18.761 to 13.144 0.728 HCV positivity -7.747 10.423 -0.740 -28.373 to 12.879 0.459 Alcohol -4.863 17.711 -0.270 -39.909 to 30.183 0.784
37
Fig. 8. Multivariate analysis: covariates with regression coefficients and confidence intervals for the penalized model. The figure shows the regression coefficients of the covariates. For categorical variables, the change is understood as the change in the modal category, and for continuous variables, it is a change of 1 IQR. In each case, this is explicitly indicated by two values that are separated by a colon after the variable. BMI is expressed in kg/m2; age and length of known HIV positivity are expressed in years; and liver stiffness is expressed in kPa. ART, antiretroviral therapy; CAP, controlled attenuation parameter (dB/m); lipodystrophy, facial lipodystrophy. The thick dark blue lines represent 90% CIs, the thick light blue lines 95% CIs and the narrow light blue lines 99% CIs.
DOI:10.14753/SE.2017.2035
38
Figure 9. Bootstrap overfitting-corrected nonparametric calibration curve of the penalized model predicting the CAP value. The horizontal axis is the prediction of CAP. The vertical axis is the observed CAP. The dashed line is the identity line. The dotted line is the apparent model performance. The solid line is the bias-corrected (overfitting-corrected) model performance. Optimism-corrected bootstrap validation with 1000 repeats showed improvement in overfitting of the model (R2=0.4104, optimism corrected R2=0.2698)
39
Figure 10. Multivariate analysis after covariate selection: covariates with regression coefficients and confidence intervals. The figure shows the regression coefficients of the covariates. For categorical variables, the change is understood as the change in the modal category, and for continuous variables, it is a change of 1 IQR. In each case, this is explicitly indicated by two values that are separated by a colon after the variable. BMI is expressed in kg/m2; age and length of known HIV positivity are expressed in years; and liver stiffness is expressed in kPa. ART, antiretroviral therapy; CAP, controlled attenuation parameter (dB/m); lipodystrophy, facial lipodystrophy. The thick dark blue lines represents 90% CIs, the thick light blue lines 95% CIs and the narrow light blue lines 99% CIs.
4.4 Univariate analysis of the association between liver stiffness and different variables
A significant Kendall-τ-rank correlation was identified between the LS and CAP value (adjusted p<0.0001) and body mass index (adjusted p<0.0001). A non-significant but remarkable association was detected with age (adjusted p=0.203). With regard to categorical variables, no significant associations were identified, and the most
DOI:10.14753/SE.2017.2035
40
pronounced correlation was the presence of arterial hypertension (adjusted p>1).
Associations between liver stiffness and different continuous and categorical variables are presented in Table 5 and Figure 11.
Table 5. Univariate analysis: associations between the liver stiffness value and continuous (panel A) and categorical (panel B) variables.
Panel A. Results are presented as the mean (median) ± SD (IQR) [minimum–maximum].
The p-value pertains to the null hypothesis of no correlation; p-values are unadjusted.
a Controlled attenuation parameter
Continuous variable Linear Kendall
r p τ p
CD4% -0.087 0.387 0.008 0.902
CD8% 0.075 0.453 -0.018 0.789
CD4/8 ratio -0.106 0.291 -0.003 0.960
Triglyceride 0.026 0.790 0.079 0.251
Cholesterol 0.028 0.782 0.059 0.392
Age 0.285 0.004 0.185 0.007
BMI 0.255 0.010 0.261 <0.0001
Disease duration 0.147 0.146 0.126 0.074
CAPa 0.226 0.023 0.295 <0.0001
41
Panel B. Results are presented as the mean (median) ± SD (IQR) [minimum–maximum].
The p-value pertains to the null hypothesis of stochastic equivalence for the two populations (presence/absence). p-values are unadjusted.
a Antiretroviral therapy
Categorical Presence of variablea Absence of variablea p-value
Diabetes 6.96 (6.3) ± 3.31 (2.65) [3.9-15.3]
5.5 (5) ± 3.32 (1.6) [3- 34.3]
0.063
Sex 4.66 (4.9) ± 0.58 (0.55) [4-5.1]
5.69 (5.15) ± 3.38 (1.85) [3-34,3]
0.446
Hypertension 6.11 (5.4) ± 2.44 (1.5) [4- 15.3]
5.51 (4,9) ± 3.57 (1.77) [3-34.3]
0.045
Lipodystrophy 5.28 (5.05) ± 0.98 (1.55) [4-6.9]
5.71 (5.1) ± 3.53 (1.7) [3-34.3]
0.821
Darunavir 5.64 (5.3) ± 1.71 (1.97) [3.5-10.2]
5.66 (5) ± 3.63 (1.7) [3-34.3]
0.410
Atanazavir 5.32 (5.2) ± 1.26 (1.6) [3.6-7.3]
5.68 (5.05) ± 3.44 (1.7) [3-34.3]
0.840
Lopinavir 6.73 (5) ± 6.08 (1.8) [3.6- 34.3]
5.29 (5.1) ± 1.41 (1.7) [3-10.2]
0.652
Raltegravir 6.15 (5) ± 3.74 (0.65) [3.9-15.3]
5.62 (5.2) ± 3.31 (1.9) [3-34.3]
0.914
Lamivudine 5.74 (5.1) ± 3.49 (1.8) [3.1-34.3]
5.06 (4.4) ± 1.77 (1.85) [3-9.3]
0.221
Tenofovir 6.33 (5.3) ± 5.13 (2.12) [3.1-34.3]
5.26 (5) ± 1.34 (1.65) [3-10.2]
0.548
Abacavir 5.59 (5.8) ± 1.83 (2) [3.6-10.2]
5.67 (5) ± 3.51 (1.75) [3-34.3]
0.819
Zidovudine 5.51 (4.9) ± 2.01 (1.65) [3.7-15.3]
5.76 (5.15) ± 3.96 (1.85) [3-34.3]
0.941 DOI:10.14753/SE.2017.2035
42 Etravirine 4.93 (4.8) ± 1.04 (1.9)
[3.6-6.3]
5.73 (5.1) ± 3.47 (1.75) [3-34.3]
0.424
Nevirapine 5.28 (5.3) ± 1.14 (1.8) [3.6-7.4]
5.76 (5) ± 3.72 (1.7) [3-34.3]
0.853
Efavirenz 5.42 (5.3) ± 1.44 (2.35) [3.1-8.8]
5.75 (5.05) ± 3.80 (1.67) [3-34.3]
0.590
ARTa ever taken 5.27 (5.1) ± 1.92 (1.62) [3-9.3]
5.69 (5.1) ± 3.43 (1.9) [3.1-34.3]
0.605
Figure 11. Correlations between continuous variables and liver stiffness. The black line shows the best-fitting linear curve, and the red line shows the LOWESS-smoother
43
for nonparametric regression. Liver stiffness is expressed in kPa, BMI in kg/m2; age, length of known HIV positivity in years, and CAP in dB/m. Linearity is clearly justified by matching the LOWESS-smoother and the best-fitting linear curve.
4.5 Multivariate regression models predicting liver stiffness
Non-linearity was deemed unnecessary (p=0.5658) in the multivariate model. The linear regression identified BMI, age and the history of taking lopinavir as independent positive covariates. A history of taking zidovudine over the course of ART and the presence of lipodystrophy were independent negative covariates. Nevertheless, the model exhibited a weak fit. The regression coefficients and confidence intervals are summarized in Table 6 and are presented graphically in Figure 12. To improve goodness-of-fit and to address the problem of multidimensionality (Figure 13, Figure 14), we penalized the model.
Although general model parameters improved, the model still exhibited poor fitting, and no significant covariates were identified (Table 7 and Figure 15 and Figure 16).
In the alternative model, CD4% and CD8% were removed (CD4% VIF=4.99; CD8%- VIF=4.86; CD4/8 ratio VIF=10.10 in the unpenalized model) and “Metabolic favorable ART” was introduced instead of different types of antiretrovirals. Age was identified as a significant positive factor (p=0.036; regression coefficient: 0.09; 95% CI 0.006-0.1736), and the CD4/8 ratio (p=0.0313; regression coefficient-2.1942; 95% CI -4.1886 to - 0.2017) and the presence of lipodystrophy (p=0.0429; regression coefficient -2.7524;
95% CI -5.414 to 0.0898) were identified as significant negative covariates. However, the model again performed poorly (R2=0.2134, optimism-corrected R2=-0.099). Therefore, penalization was conducted, which improved the goodness-of-fit (optimism-corrected R2=0.0497), but significant covariables were no longer identifiable.
Table 6. Multivariate model predicting liver stiffness
a Controlled attenuation parameter Covariate Regression
coefficient
S.E. t 95% CI p-value
CAPa -0.005 0.009 -0.500 -0.0225 to 0.0134 0.615 DOI:10.14753/SE.2017.2035
44 Covariate Regression
coefficient
S.E. t 95% CI p-value
CD4 0.043 0.082 0.530 -0.1198 to 0.2055 0.601
CD8 0.010 0.057 0.170 -0.1036 to 0.1235 0.862
Age 0.096 0.047 2.030 0.0018 to 0.1899 0.046
BMI 0.336 0.145 2.320 0.0466 to 0.6262 0.024
CD4/8 ratio -2.610 2.893 -0.900 -8.3810 to 3.1604 0.370 Triglyceride -0.058 0.161 -0.360 -0.3787 to 0.2634 0.722 Cholesterol -0.028 0.245 -0.120 -0.5170 to 0.4603 0.908 Diabetes 1.729 1.326 1.300 -0.9161 to 4.374 0.197 Hypertension 0.180 0.981 0.180 -1.7775 to 2.1365 0.855 Lipodystrophy -3.694 1.384 -2.670 -6.4539 to -0.9334 0.010 Disease duration 0.046 0.889 0.460 -1.3629 to 2.1857 0.645 Darunavir -2.097 1.134 -1.850 -4.3585 to 0.1651 0.069 Atanazavir -1.813 1.606 -1.130 -5.0176 to 1.3912 0.263 Raltegravir -1.035 1.372 -0.750 -3.7713 to 1.7008 0.453 Etravirine -2.088 1.354 -1.540 -4.7894 to 0.6133 0.128 Nevirapine -0.536 1.081 -0.500 -2.6922 to 1.6206 0.622 Efavirenz -0.552 0.957 -0.580 -2.4619 to 1.3575 0.566 Tenofovir 0.972 0.873 1.110 -0.7687 to 2.7123 0.269 Abacavir 1.401 1.151 1.220 -0.8958 to 3.6975 0.228 Zidovudine -2.016 0.901 -2.240 -3.8131 to -0.2178 0.029 Lamivudine 0.907 1.349 0.670 -3.5973 to 1.783 0.503 Lopinavir 2.459 0.993 2.480 0.4785 to 4.4387 0.016