R E S E A R C H Open Access
GABA, glutamine, glutamate oxidation and succinic semialdehyde dehydrogenase
expression in human gliomas
Zoltán Hujber1, GergőHorváth2, Gábor Petővári1, Ildikó Krencz1, Titanilla Dankó1, Katalin Mészáros3,
Hajnalka Rajnai1, Norbert Szoboszlai4, William P. J. Leenders5, András Jeney1, László Tretter2and Anna Sebestyén1*
Abstract
Background:Bioenergetic characterisation of malignant tissues revealed that different tumour cells can catabolise multiple substrates as salvage pathways, in response to metabolic stress. Altered metabolism in gliomas has received a lot of attention, especially in relation to IDH mutations, and the associated oncometabolite D-2-hydroxyglutarate (2-HG) that impact on metabolism, epigenetics and redox status. Astrocytomas and oligodendrogliomas, collectively called diffuse gliomas, are derived from astrocytes and oligodendrocytes that are in metabolic symbiosis with neurons;
astrocytes can catabolise neuron-derived glutamate and gamma-aminobutyric acid (GABA) for supporting and regulating neuronal functions.
Methods:Metabolic characteristics of human glioma cell models–including mitochondrial function, glycolytic pathway and energy substrate oxidation–in relation to IDH mutation status and after 2-HG incubation were studied to understand the Janus-faced role of IDH1 mutations in the progression of gliomas/astrocytomas. The metabolic and bioenergetic features were identified in glioma cells using wild-type and genetically engineered IDH1-mutant glioblastoma cell lines by metabolic analyses with Seahorse, protein expression studies and liquid chromatography- mass spectrometry.
Results:U251 glioma cells were characterised by high levels of glutamine, glutamate and GABA oxidation. Succinic semialdehyde dehydrogenase (SSADH) expression was correlated to GABA oxidation. GABA addition to glioma cells increased proliferation rates. Expression of mutated IDH1 and treatment with 2-HG reduced glutamine and GABA oxidation, diminished the pro-proliferative effect of GABA in SSADH expressing cells. SSADH protein overexpression was found in almost all studied human cases with no significant association between SSADH expression and clinicopathological parameters (e.g. IDH mutation).
Conclusions:Our findings demonstrate that SSADH expression may participate in the oxidation and/or consumption of GABA in gliomas, furthermore, GABA oxidation capacity may contribute to proliferation and worse prognosis of gliomas. Moreover, IDH mutation and 2-HG production inhibit GABA oxidation in glioma cells. Based on these data, GABA oxidation and SSADH activity could be additional therapeutic targets in gliomas/glioblastomas.
Keywords:Glioma, Bioenergetics, IDH1 mutation, 2-hydroxyglutarate, Glutamine, GABA, Succinic semialdehyde dehydrogenase
* Correspondence:anna@korb1.sote.hu;hsebanna@gmail.com
11st Department of Pathology and Experimental Cancer Research, Semmelweis University, Üllői út 26, Budapest 1085, Hungary Full list of author information is available at the end of the article
© The Author(s). 2018Open AccessThis article is distributed under the terms of the Creative Commons Attribution 4.0 International License (http://creativecommons.org/licenses/by/4.0/), which permits unrestricted use, distribution, and reproduction in any medium, provided you give appropriate credit to the original author(s) and the source, provide a link to the Creative Commons license, and indicate if changes were made. The Creative Commons Public Domain Dedication waiver (http://creativecommons.org/publicdomain/zero/1.0/) applies to the data made available in this article, unless otherwise stated.
Introduction
Gliomas, glial cell derived central nervous system malig- nancies, are a heterogeneous, aggressive tumour type with poor prognosis. The incidence of isocitrate dehydrogenase (IDH) mutations is high in low-grade gliomas. Despite the fact that these malignancies are still incurable, patients with IDH-mutant gliomas have a better prognosis and re- sponse to chemo-and radiotherapy than patients with IDH wild-type tumours [1,2]. IDH mutations can also be implicated in the formation of other tumour types (acute myeloid leukaemia–AML, chondrosarcomas, intrahepa- tic cholangiocarcinoma –ICC). In these non-glial malig- nancies, IDH mutations appear to confer a worse prognosis to the patient; although there is some contro- versy in case of ICC and AMLs [3,4].
Based on highly detailed analyses of the genetic basis for malignant progression (gene amplifications, mutations, loss of chromosome arms, gene expression, DNA methy- lation status), several altered pathways in IDH-mutated gliomas were characterised, including RTK-PI3K-mTOR, Notch signalling, cell cycle and DNA damage response regulation. These studies concluded that IDH mutation is at the centre of epigenetic alterations in glioma cells [5,6].
The prevalence of IDH mutation is high in grade II-III and secondary glioblastomas (70–80%), the most fre- quently (> 90%) mutated IDH isoform is the cytosolic IDH1 R132H [7,8], that has gained a neomorphic activity resulting in conversion of α-ketoglutarate (aKG) to the oncometabolite D-2-hydroxyglutarate (2-HG). In addition, the mutation has a negative impact on the function on the wild-type allele [9].
2-HG can accumulate to millimolar concentrations in cells and in the extracellular environment [10,11]. More- over, mutated IDH1 not only causes 2-HG production, but also initiates changes in metabolic adaptation of mu- tated cells [12]. Mutant IDH1 oxidises NADPH to NADP+ during 2-HG production, instead of reducing NADP+ to NADPH as is done by the wild-type IDH1 enzyme during conversion of isocitrate to aKG. Because 2-HG and aKG are structurally very similar metabolites, 2-HG acts as a competitive inhibitor of aKG-dependent dioxygenases in- cluding prolyl-hydroxylases, histone- and DNA demethy- lases [13–15]. Cancer-related metabolic alterations, adaptations and their role in tumourigenesis and progres- sion are extensively studied in many cancers. The meta- bolic characterisation of human gliomas started with the reinterpretation of Warburg effect suggesting that other substrates than glucose can also be oxidised by glioma cells [12,16,17], such as glutamine and acetate [18–20].
Multiple substrates can fill up the TCA cycle–which is in the centre of metabolic activity–to provide acetyl-CoA;
and many studies reported that cells can use glutamine and/or glutamate as catabolic substrates [21–23]. Previous results suggested that glioma cells adaptively run the TCA
cycle backwards to power the electron transport chain, es- pecially in case of IDH-mutant cells. Analogous to fumar- ate hydratase (FH) and succinate dehydrogenase (SDH) mutations, which can also cause oncometabolite produc- tion, IDH mutation provides an example of how a single mutation can reprogram cellular metabolism and affect pathobiology [13,15,24].
Recent years have yielded exciting findings in the field of tumour metabolism, and some aspects of these meta- bolic alterations related to IDH mutations have also been described [25,26].
Astrocytes and GABA-ergic and glutamatergic neurons play roles in the maintenance of the neurotransmitter pools of glutamate and gamma-aminobutyric acid (GABA).
Astrocytes and neurons are in metabolic symbiosis, astro- cytes can catabolise glutamate and GABA for supporting and regulating neuronal functions. GABA can feed the TCA cycle via the activities of GABA transaminase and succinic semialdehyde dehydrogenase (SSADH) to produce succinate [27]. The expression changes of GABA utilisation enzymes and GABA consumption were only studied in few recent publications in cancer research [28,29].
An emerging question is whether glioma cells have the ability to use the GABA shunt to support energy pro- duction and proliferation. This indicates a need to understand the effect of produced 2-HG (caused by IDH1 mutations) on the former pathway.
Our study provides an exciting opportunity to advance our knowledge of the effects of IDH1 mutation and 2-HG accumulation to identify several mechanisms which can help to understand the Janus-faced role of IDH1 mutations in the progression of gliomas – IDH mutations could be driver oncogenic alterations, how- ever, IDH-mutant human gliomas have better prognosis than wild-type. In the present study, the alterations of bioenergetic characteristics and different substrate oxi- dation capacities in relation to the expressions of rele- vant proteins in glioma cell lines were analysed (Additional file 1: Figure S1 summarises the analysed pathways). Our presented results demonstrate that SSADH expression – an IDH mutation independent in vivo characteristic of human glioma cells – provides a possibility for GABA oxidation. This may have special importance in survival, proliferation and metabolic adap- tation of glioma cells.
Methods
All materials were purchased from Merck-Sigma-Aldrich (Darmstadt, Germany), except where it is indicated in the text.
In vitro cell cultures
U251 MG (U251 wt), genetically engineered U251 MG mutant IDH1 R132H overexpressing (U251 IDH1m)
[25], U87 MG (ATCC) and U373 MG (kindly provided by G. Sáfrány) human astrocytoma/glioblastoma cells were cultured in DMEM high glucose medium supple- mented with 10% foetal bovine serum, 2 mM L-glutamine and 100 UI/ml penicillin-streptomycin. R132H mutation status was confirmed by immunocytochemistry using anti-IDH1 R132H (Dianova, H09 clone, 1:80) antibody in different cell lines after paraformaldehyde (4%) fixation. For metabolic flux experiments, cells were washed with DMEM D5030 (glucose-, glutamine- and pyruvate-free medium) followed by incubation with DMEM D5030 medium con- taining U-13C-glucose, U-13C-glutamine or 2-13C-acetate (Cambridge Isotope Laboratories Inc.). T25 or T75 flasks (for Western blot, liquid chromatography-mass spectrom- etry (LC-MS) and 13C-labelling experiments) and 96-well plates (sulforhodamine-B and Alamar Blue proliferation as- says), special Seahorse plates were used with appropriate cell numbers (3–8 × 10⁵ cells/flask or 2.5 × 10³ – 5 × 10⁴ cells/well) for different treatments and measurements. To analyse the direct effect of 2-HG accumulation and the role of GABA metabolism in U251 wt cells, 4 mM 2-HG, 5 mM GABA and 0.6 mM vigabatrin were added for various time periods (24 h, 72 h and 14/28 days). We selected concentra- tions based on previous publications.
Cell proliferation measurements
Beside cell counting the proliferation rate was analysed by sulforhodamine-B (SRB) assay which correlates to the protein content of the analysed samples. For 72-h prolif- eration assays 2.5 × 10³untreated or pre-treated glioma cells/100 μl well were seeded; followed by incubation under different conditions. Thereafter the cells were fixed with 10% trichloroacetic acid subsequently stained with SRB using 10 mM Tris, and the absorbance was measured at 570 nm. In addition, Alamar Blue (Thermo Fisher Scientific) test was also used for proliferation studies. The incubation period was 4 h, fluorescence was measured by Fluoroskan Ascent FL fluorimeter software (Labsystems International). Percentages of proliferation were given relative to control samples.
Expression analysis of different proteins by Western blot Protein concentrations of cell extracts were measured with using Bradford assay (Biorad). Equal amounts of pro- teins were separated by 8–12% SDS-PAGE gels following their transfer to PVDF membrane applying BioRad Trans Blot Cell. Membranes were stained with Ponceau S, before incubation the following primary antibodies were used in expression studies: anti-phosphofructokinase P (PFKP) (Cell Signaling 1:1000 #8164); anti-hexokinase 2 (HK2) (Cell Signaling 1:1000 #2867); anti-β-F1-ATPase (ATPB) (Abcam 1:2000 #14370), anti-glutaminase (Gls) (Abcam 1:1000 #156876); anti-acetyl-CoA synthetase 2 (ACSS2) (Cell Signaling 1:1000 #3658); anti-alanine, serine, cysteine
-preferring transporter 2 (ASCT2) (Bethyl 1:2000
#A304-353A); anti-succinic semialdehyde dehydrogenase (SSADH) (Abcam 1:1000 #129017); anti-GABA trans- porter 1 (GAT1) (Abcam 1:500 #426). Finally, biotinylated secondary antibodies, Vectastain Elite ABC Kit (Vector) and enhanced chemiluminescence technique (Thermo Fisher Scientific ECL Western Blotting Substrate) were applied by using C-Digit System (Li Cor Biosciences) de- tection equipment. The membranes were stripped and probed by anti-β-actin antibody (Sigma-Aldrich; #A228;
1:5000), to prove equal protein loading as well.
Assay to detect cellular respiration and extracellular pH changes
Real-time measurements of oxygen consumption rate (OCR), reflecting mitochondrial oxidation and extracel- lular acidification rate (ECAR), indicated as a parameter of glycolytic activity, were performed on a Seahorse XF96 Analyzer (Agilent Technologies, USA) based on previous descriptions [30–32].
Glioma cell lines were plated in 100μl complete DMEM growth media at 1.5 × 10⁴cells/well density onto 96-well Seahorse plates (Agilent Technologies, USA) 24 h prior to the assays. The medium was removed and was replaced by glucose-, glutamine- and pyruvate-free DMEM medium (D5030 pH 7.4). The basal OCR and ECAR were calculated via XF96 Analyzer software (Agilent Technologies, USA) after 1.5-h incubation at this condition.
Following this, substrate utilisation was measured by using different substrates in parallel wells.
During the measurements freshly prepared substrates (glucose 10 mM, glutamine 2.5 mM, citrate 5 mM, GABA 5 mM, lactate 5 mM, malate 10 mM, acetate 10 mM and glutamate 5 mM) and/or metabolic inhibi- tors/modulators (oligomycin 2 μM, 2,4-dinitrophenol - DNP 100μM and antimycin A + rotenone 1–1μM) were injected into each well to reach the desired final working concentration.
LC-MS/MS method for quantitative metabolite analysis Intra- or extracellular metabolites - citrate, aKG, succin- ate, fumarate, malate, glutamate, 2-HG - were extracted by a modified method based on Szoboszlai et al. [33, 34].
Cells (minimum 5 × 10⁵cells) were quenched in liquid ni- trogen. Metabolites were extracted from cells and in paral- lel 300–500μl supernatant by methanol-chloroform-H2O (9:1:1) and vortexed at 4 °C. After centrifugation (15,000×g, 10 min, 4 °C) the clear supernatants were stored at -80 °C until measurements. Citrate, aKG, succin- ate, fumarate, malate, glutamate and 2-HG concentrations were assessed by using calibration curves obtained with the dilution of analytical purity standards in the range of 0.5–50 μM. LC-MS grade water, LC-MS grade methanol
and LC-MS grade formic acid were purchased from VWR International Ltd. (Debrecen, Hungary).
LC-MS/MS assays were performed on a Perkin-Elmer Flexar FX10 ultra-performance liquid chromatograph coupled with a Sciex 5500 QTRAP mass spectrometer.
For chromatographic separation a Phenomenex Luna Omega C18 column, (100 × 2.1 mm, 1.6 μm) was used (GenLab Ltd., Budapest, Hungary). The mobile phase consisted of water containing 0.1% (v/v) formic acid (A) and methanol containing 0.1% (v/v) formic acid (B). The mass spectrometer was operating in negative electro- spray ionisation mode with the following settings: source temperature: 300 °C ionisation voltage:−4000 V, curtain gas: 35 psi, gas1: 35 psi, gas2: 35 psi, entrance potential:
-10 V, CAD gas: medium. Quantitative analysis was per- formed in multiple reaction monitoring (MRM) mode.
Different substrate consumptions were analysed using
13C-labelling and LC-MS measurements
Sub-confluent cells were washed and incubated in DMEM D5030 medium with 10 mM D-U-13C-glucose or 4 mM L-U-13C-glutamine or 10 mM 2-13C-acetate (Cam- bridge Isotope Laboratories, Andover, MA, USA) addition for 1 h in short-time labelling experiments before the ex- traction [32]. In 24-h labelling experiments – avoiding long-term starvation/non-physiological conditions– cells were seeded in DMEM D5030 medium supplemented with FBS, and the combination of labelled and/or un- labelled glucose (10 mM) and glutamine (4 mM) or acet- ate (10 mM) were added to cell cultures for 24 h.
SSADH expression analysis by immunohistochemistry (tissue microarray) in clinical samples
47 glioma patients (type: astrocytoma n= 14, oligo- dendroglioman= 14, glioblastoma n= 19; sex: female n
= 23, male = 24; WHO grade: IIn= 9, III n= 19, IVn= 19; IDH1 R132H mutation: positiven= 32, negativen= 15) were included in a tissue microarray (TMA) study.
Three normal brain and renal tissues were included as controls. Expression studies by IHC on biopsy materials were approved by the Institutional Ethical Review Board (TUKEB no. 7/2006). TMA sections were deparaffinised, endogenous peroxidase blocking was followed by antigen retrieval (sodium citrate; pH 6). Immunostaining was performed by routine diagnostic antibodies (such as anti-IDH1 R132H), SSADH (Abcam #129017 1:500) antibody and Novolink Polymer Detection System (Novocastra, Wetzlar, Germany), visualised by DAB and counterstained with haematoxylin. H-scores (scale of 0–
300) were determined by two independent pathologists with semi quantitative analysis of immunoreactivity using 3DHistech Pannoramic Viewer program according to Krencz et al. [35]. The H-score was calculated from staining intensity (0, 1+, 2+, or 3+) and positively stained
tumour cells (percentage). The final H-score was calcu- lated by averaging the H-scores of all the scores from the same tissue. SSADH expression was categorised as low (H-score 0–149) and high (H-score 150–300).
Statistical analysis
The data are presented as mean with standard deviation and calculated from three independent experiments with minimum three or more parallels depending on the method used. Results were statistically evaluated through one-way ANOVA with post-hoc Tukey’s and Dunnett’s tests for multiple comparisons by IBM SPSS Statistics soft- ware, version 22 (SPSS Inc.). Mann-Whitney U test and Kruskal-Wallis test were used to compare SSADH expres- sions and clinicopathologic parameters in human gliomas using IBM SPSS Statistics software, version 22 (SPSS Inc.).
p< 0.05 was considered statistically significant.
Results
Characteristics of cellular respiration and glycolytic activity in glioma cells
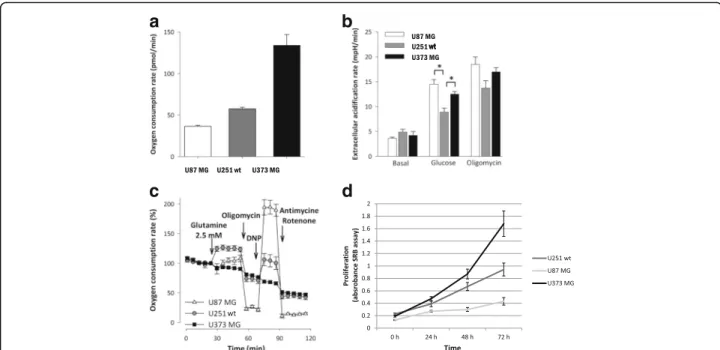
The basal oxygen consumption rates (OCR) among the in- vestigated gliomas showed significant differences. The lowest respiration rate was observed in U87 MG, while the highest basal rate was produced by U373 MG cells in DMEM D5030 medium (Fig.1a). In contrast with the re- spiratory parameters, there were no differences in the basal extracellular acidification (ECAR) rates. However, glucose addition reveals alteration in the metabolic adap- tation of gliomas. Lactate productions using glucose ad- ministration with or without mitochondrial respiratory inhibitor were the highest in U87 MG cells, which have the lowest basal respiratory activity (Fig. 1b). These find- ings indicate an inverse relationship between the basal oxygen consumption and the glycolytic activity. Addition- ally, we compared the glutamine metabolising properties of the examined gliomas. The glutaminolysis-driven re- spiratory capacity was significantly higher in U251 wt cells than in U87 MG or U373 MG cells (Fig.1c). Using same cell density, time-dependent growth showed individual differences in these glioma cells (Fig. 1d), but these did not correlate to their oxygen consumptions. U373 MG cells have the fastest proliferation and these cells have both high glucose utilisation and high respiratory capacity.
IDH1 mutation and related 2-HG accumulation increase the basal respiration and decrease the glycolytic capacity The effects of the most frequent IDH1 mutation (R132H) of gliomas in energy metabolism and substrate consump- tion were studied in an IDH1 mutation (R132H) carrying glioma model (isogenic pair: U251 wt and its genetically engineered counterpart - U251 IDH1m). Besides, we stud- ied the short-term effects of 2-HG incubation in U251 wt cells. Comparing the basal respiration of wt, 2-HG-treated
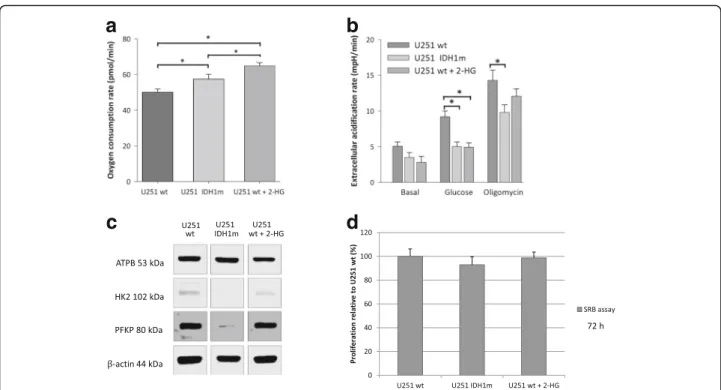
wt and IDH1m U251 cells, significantly elevated OCR was observed in case of IDH1m and 2-HG-treated wt cells (Fig. 2a). In contrast, higher extracellular acidification rates–especially after glucose addition–were measured in U251 wt cells compared to IDH1m and 2-HG-treated U251 wt cells (Fig.2b). These alterations were detected by Seahorse measurements, the altered characteristics related to IDH1 mutation and 2-HG treatment were supported by Western blot analyses of certain metabolic enzyme ex- pressions in these models (Fig. 2c). Higherβ-F1-ATPase expression was detected in IDH1m cells in parallel with increased OCR compared to wt cells. However, short-term 2-HG addition did not elevate the expression level of β-F1-ATPase in U251 wt cells. Analysing certain key en- zymes of glycolysis (e.g. hexokinase 2, phosphofructoki- nase P), decrease in their expression was detected in IDH1m and 2-HG-treated wt cells.
U251 wt and IDH1m cells have significantly different in vitro growth characteristics. The proliferation of mutant cells was lower than of wild-type cells registered by cell number during culturing and SRB assay (doubling times were calculated based on Roth V. et al.–[36]–the doub- ling time of IDH1m cells was 1 h longer than wt by both cell counting and proliferation assay. However, 72-h (short-term) 2-HG treatment had no significant growing ef- fect on cell proliferation rates in U251 wt cultures (Fig.2d).
Intracellular metabolite concentration differences and the main source of 2-HG production
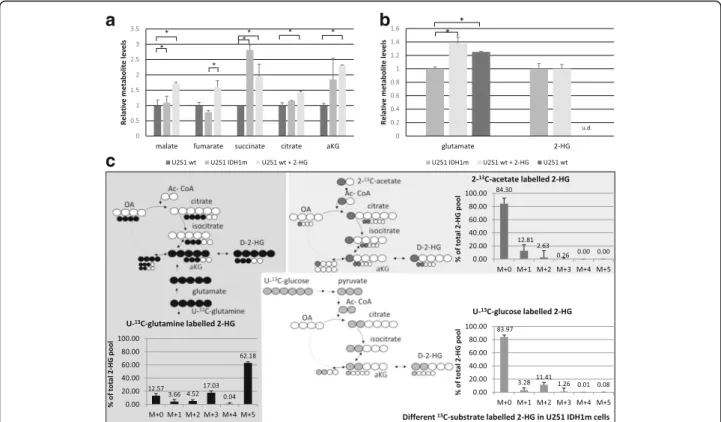
The intracellular metabolite concentrations (measured by LC-MS) confirmed the metabolic differences detected among U251 cell culture systems (Fig. 3a). High level of 2-HG was measured in IDH1m cells and similar 2-HG level was observed in 2-HG-treated wt cells by LC-MS (Fig. 3b). Moreover, elevated levels of TCA metabolites were observed in IDH1m and 2-HG-treated U251 wt cells (Fig 3a). Inverse alterations were detected in glutamate concentrations. The amount of glutamate was decreased in IDH1m, but it was increased in 2-HG-treated wt cells comparing to wt cells (Fig.3b).
To identify which substrates are the prominent sources for 2-HG production in IDH1-mutant U251 cells, the cells were fed with 13C-labelled energy substrates (U-13C-glu- cose, U-13C-glutamine, 2-13C-acetate) in D5030 medium.
Based on our 1-h-labelling results, both glutamine and glucose could be sources of 2-HG (5.5% 13C-labelled 2-HG from glutamine and ~ 2% from glucose were de- tected). Performing 24-h-labelling experiments, glutamine was proven to be the main source of 2-HG – 87.43%
(sum-total = M + n isotopomers) of the total intracellular 2-HG pool containing glutamine-derived 13C-labelling (Fig.3c), as compared to13C-incorporation percentages of 15.95 and 15.7% from glucose and acetate, respectively
a
c
b
d
Fig. 1Oxygen consumption, extracellular acidification rate and glutamine oxidation differences were measured by Seahorse in U87 MG, U251 wt, U373 MG glioma cell lines using D5030 medium.aDifferent oxygen consumption rates in the studied cell lines (pmol/min).bExtracellular acidification rates were measured in minimal medium (D5030) at basal rate and after glucose (10 mM) addition following oligomycin (2μM) treatment.cOxygen consumption rate curves in minimal medium (D5030), and after glutamine (2.5 mM) addition and using several metabolic inhibitors and modulators (oligomycin - 2μM; 2,4-dinitrophenol - DNP - 100μM; antimycin - 1μM - and rotenone - 1μM) *:p< 0.05.dTime- dependent growth of different glioma cell lines (U87 MG, U251 wt and U373 MG) at normal non-starving conditions. Cell proliferation was monitored by SRB test using 2.5 × 10³cells/100μl at the starting point of the experiments
(Fig.3c). Labelling intensities of extracellular 2-HG levels correlated to and followed the intracellular ones in our measurements (Additional file2: Figure S2).
IDH1 mutation and 2-HG related different substrate - including GABA - oxidation in U251 MG models
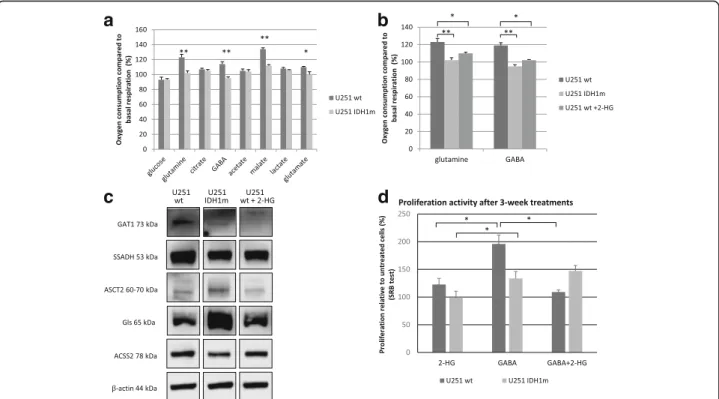
Beside glucose and glutamine, other substrates were also involved to study different substrate oxidations by Sea- horse technique using wt, IDH1m and 2-HG-treated U251 wt cells. No differences between U251 wt and U251 IDH1m cells were detected with respect to lactate, citrate or acetate oxidations. In contrast, decreased oxi- dation of glutamine, glutamate and malate was measured in IDH1m cells (Fig. 4a). 2-HG-treated U251 wt cells mimicked IDH1m cells regarding oxidation (Fig.4b). En- zyme expressions related to glutamine and acetate con- sumption were detected by Western blot (Fig.4c).
Intriguingly, significant GABA oxidation was detected in U251 wt cells (OCR was elevated with 20%) (Fig.4a). How- ever, IDH1m cells did not oxidise GABA and this could be mimicked in 2-HG treated U251 wt cells (Fig. 4b). The pro- or anti-proliferative effects of short- and long-term GABA, 2-HG and GABA+ 2-HG combination treatments were also tested in U251 wt and IDH1m cells. Long-term
GABA treatment (for more than 3 weeks) significantly en- hanced the proliferation of U251 wt cells, whereas signifi- cantly lower increase in proliferation was found in IDH1m cells (Fig.4d). While 2-HG could not significantly reduce the proliferation of the long-term GABA treated IDH1m cells, 2-HG combination treatments reversed long-term GABA effects in the wild-type cells (Fig. 4d). Short-term (72 h) GABA, 2-HG treatments and their combination showed similar tendency in wild-type cells, however, no significant effect could be observed (data not shown).
According to the Human Protein Atlas (http://
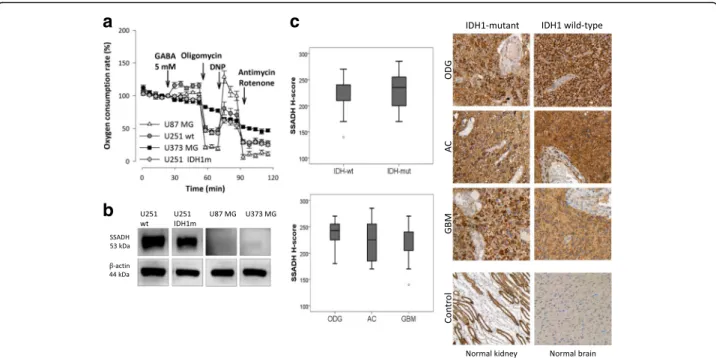
www.proteinatlas.org) database, U251 cells do not ex- press GABA receptor subunit mRNAs (GABRA 1–6, GABRB1–3, GABRR1–3, GABRE and GABRQ), exclud- ing receptor mediated effects of GABA. However, U251 cells do express SSADH and GAT1 proteins as shown by Western blot. Of note, SSADH and GAT1 protein level differences in IDH1m and 2-HG-treated U251 wt cells were also found (Fig. 4c.). Noteworthy, U87 MG and U373 MG did not express SSADH. Accordingly, these cells did not oxidise GABA (Fig.5aandb). To test the potential role of GABA shunt and SSADH activity in the survival and the proliferation of SSADH expressing U251 wt cells, we tested the effect of vigabatrin (GABA transaminase
a
c
b
d
Fig. 2IDH1 mutation (IDH1m) and the elevated 2-HG level related metabolic alterations in U251 glioma cells (oxygen consumption and metabolic enzyme expression differences).aOxygen consumption rates in U251 wt, U251 IDH1m and 2-HG pre-treated (72 h, 4 mM) U251 wt cells (OCR was measured in D5030 medium by Seahorse).bExtracellular acidification data in minimal medium (D5030), and after glucose (10 mM) addition and using oligomycin (2μM) thereafter (Seahorse measurements).cAlterations in the expression of different metabolic enzymes in IDH1m and 2-HG-treated (72 h, 4 mM) U251 glioma cells (representative Western blot results using anti-β-F1-ATPase - ATPB, anti- hexokinase 2 - HK2, anti-phosphofructokinase P - PFKP andβ-actin).dDifferences in proliferation of U251 wt, IDH1m and 2-HG pre-treated (72 h) wt cells. The relative proliferation was calculated related to U251 wt (100%), the growing capacity was monitored by SRB tests using 2.5 × 10³ cells/100μl at the starting point of the experiments; *:p< 0.05
inhibitor). Vigabatrin reduced the proliferation of glioma cells, as we could see this slight decrease in U251 wt cell cultures, as well. In U251 wt cells, vigabatrin could lower GABA oxidation, and in case of the presence of vigabatrin, GABA addition was not able to influence the cellular prolif- eration positively (Additional file 3: Figure S3). The exact role of SSADH in the detected GABA-dependent pro-proliferative effect needs examinations using specific SSADH inhibition in further studies.
SSADH overexpression in human glioma cases
In vitro cell lines do not necessarily reflect clinical tu- mours in all aspects [37]. Therefore, SSADH expression was studied in human glioma biopsies and peritumoural normal brain tissues (both cerebrum and cerebellum) by immunohistochemistry. In peritumoural cerebral tissues, high expression with H-score > 150 was observed in the cortical region, however, white matter astrocytes showed low to moderate expression (150 > H-score). In the cere- bellum, moderate to high expression was observed in both the molecular and the granular cell layers similarly
to the Purkinje cells; we recorded that cells have low SSADH staining intensity (0/+) at non-tumoural areas.
We could detect a moderate expression level in astro- cytes of white matter in situ and 3+ positivity in glioma cells. Based on our results, SSADH protein level is higher in glioma cells than in normal tissues in almost all studied cases; therefore, we could not find any differ- ences between IDH-mutant and wild-type cases at this level. In the glioma biopsies, high SSADH expression was characteristic for all histological subtypes (Fig. 5c).
High SSADH expression was found in 97% of cases. This SSADH expression showed no associations with clinico- pathological parameters such as age, gender, tumour type, grade or IDH mutation status.
Discussion
Our main aim was to characterise the bioenergetic differ- ences related to IDH mutations by using an isogenic cell line pair with and without the IDH1 R132H mutation.
The effects of epigenetic and other (e.g. metabolic) alter- ations caused by IDH1 mutation have been described
a
c
b
Fig. 3Altered metabolite concentrations in IDH1-mutant and 2-HG-treated (72 h, 4 mM) U251 wt cells and the evaluation of the bioenergetic source of 2-HG production in U251 IDH1m cells (LC-MS measurements).aTCA cycle related metabolite levels (relative to wt) in IDH1m and 2-HG- treated U251 wt cells - (DMEM high glucose medium + 10% FBS + 2 mM L- glutamine).bAlterations in intracellular glutamate and 2-HG levels (relative to IDH1m) in 2-HG-treated U251 wt cells and in wt cells; u.d. = under detectable level - (DMEM high glucose medium 10% FBS + 2 mM L- glutamine).cUnlabelled and13C-labelled intracellular 2-HG productions (% of total 2-HG pool) (24-h labelling period). To avoid starving condition, the medium was supplemented with 10% FBS and 10 mM D-glucose and/or 4 mM L-glutamine: 4 mM U-13C-glutamine labelling in D5030 + 10%
FBS and 10 mM D-glucose; 10 mM U-13C-glucose labelling in D5030 + 10% FBS and 4 mM L-glutamine; or 10 mM 2-13C-acetate labelling in D5030 medium + 10% FBS + 10 mM D-glucose and 4 mM L-glutamine. Unlabelled 2-HG does not contain incorporated13C atoms, M + 1/2/3/4/5 = mass number increased with 1/2/3/4 or 513C atoms in 2-HG from different labellings; *:p< 0.05
previously [38–40]. However, few data are available about the bioenergetic consequences of IDH1 mutation and their role in growth and survival of tumour cells [25,41].
Based on our Seahorse measurements (oxygen consump- tion and extracellular acidification), higher oxygen con- sumption is strongly correlated to mutant IDH1-produced 2-HG. In addition, after using 2-HG treatment in wild-type cell cultures, the respiration was increased to similar level as in IDH1-mutant cells. Alterations of intra- and extracel- lular 2-HG besides Krebs cycle metabolite levels were ob- served. These observations suggest the presence of metabolic compensatory mechanisms in these cells. Our results confirmed, that the Warburg phenotype is domin- ant in IDH1 wild-type cells, whereas IDH1-mutant cells prefer oxidative phosphorylation using substrates other than glucose. Khurshed et al. published that glycolytic enzyme mRNA expression levels are higher in IDH wild-type tumour tissues and the expression levels of TCA related enzymes are higher in IDH1-mutant human cases [20]. It was also described that mutant IDH1 enzyme was
correlated with high mitochondrial density and increased mitochondrial activity in oligodendroglioma cell line xeno- grafts in vivo [41].
In our study, the significantly reduced glutamate level in IDH1-mutant cells could correlate to enhanced glutamino- lytic pathway (glutamine-glutamate-aKG-2-HG axis). This was not observed in U251 wt cells after 2-HG incubation, suggesting that glutamatolysis in IDH1-mutant cells is re- lated to the necessity to replenish aKG levels, rather than by 2-HG induced effects [16]. Previous spectrometric analyses have shown and highlighted that the most important source of 2-HG is glutamine, and only low labelling could derive from glucose due to limited glucose turnover [26]. Glutam- ine was the main source of 2-HG in our experiments using
13C-labelled substrates in 1-h-and 24-h-labelling periods which is in line with previous report [23]. Glucose and acet- ate also contributed to 2-HG-labelling in 24-h13C-labelling experiments. This potential contribution of acetate substrate in significant 2-HG 13C-labelling after 24 h was detected first in our experiments. Previous TCGA-based analyses
a
c
b
d
Fig. 4Energy substrate oxidation differences in wt, IDH1m and 2-HG-treated U251 wt cells.aOxygen consumption compared to basal respiration (%) after using different energy substrates: glucose (10 mM), glutamine (2.5 mM), citrate (5 mM), GABA (5 mM), acetate (10 mM), malate (10 mM), lactate (5 mM), glutamate (5 mM) in U251 wt and U251 IDH1m cell lines in D5030 medium by Seahorse measurements, *:p<
0.05 **:p< 0.01.bEffects of 2-HG on glutamine and GABA oxidation in U251 wt, IDH1m and 2-HG-treated wt cells (the oxidation was measured after with or without 2-HG (4 mM) pre-treatment (72 h) in D5030 by Seahorse measurements) *:p< 0.05, **:p< 0.01.cGABA metabolism related enzyme (GAT1 - GABA transporter 1; SSADH - succinic semialdehyde dehydrogenase) expressions; glutamine metabolism related enzyme expressions (glutaminase, ASCT2 - alanine, serine, cysteine-preferring transporter 2); and acetate consumption related ACSS2 (acetyl-CoA synthetase 2) enzyme expression in U251 wt, IDH1m and 2-HG (4 mM) treated cells (72 h) using Western blot analyses.dDifferent growing characteristics of U251 wt and U251 IDH1m cells using long-term (3-week-long) 2-HG (4 mM), GABA (5 mM) and combination treatments in DMEM high glucose. After 3-week long- term continuous treatment (intermittently passaging 2 or 3 times per week) 2.5 × 10³cells/100μl were plated for 72 h and terminated by SRB tests.
Data show the average of relative proliferations (untreated U251 wt–100%) *:p< 0.05
suggest that glucose and acetate are preferential substrates in IDH wild-type, rather than IDH-mutant gliomas [20];
therefore, the relative contribution of glucose and acetate in clinical IDH-mutant gliomas needs further investigations.
It has been shown in in silico studies that IDH1-mu- tant gliomas have significantly higher lactate dehydro- genase B expression comparing to wild-type tumours;
and higher lactate oxidation was hypothesised in IDH1 mutation bearing cells [20]. In our observations, we could not detect significant differences in lactate and acetate oxidation between wild-type and IDH1-mutant glioma cells. However, our results show that glutamine, glutamate and GABA energy substrates could significantly increase oxygen consumption rate in IDH1 wild-type U251 glioma cells (approximately 20% increase in OCR), but not in their IDH1-mutant counterpart cells. These suggest that GABA and glutamine can have an important role in energy production through substrate oxidation preferentially in IDH1 wild-type gliomas.
Dependency on glutamine and/or glutamate of IDH- mutant gliomas has been reported previously [21, 23].
Our current study has demonstrated for the first time, that GABA oxidation (using GABA as an energy sub- strate) via the activity of SSADH can produce energy, explaining our finding the GABA stimulated prolifera- tion of U251 wild-type cells. However, emerging data
about the exact mechanism of GABA receptor mediated pro-proliferative effects are still unclear and contradict- ory [42, 43]. The detected pro-proliferative effect was not the result of GABA-receptor stimulation [44] as U251 cells lack expression of these. Based on our results, 2-HG could reverse the effect of GABA on proliferation.
In line with the absence of SSADH expression in U87 MG and U373 MG, these cell lines were not able to oxi- dise GABA. Recent publications highlight the import- ance of GABA shunt in primer and metastatic brain tumours. The heterogeneity in cell lines with respect to SSADH expression and GABA oxidation warrants fur- ther investigation towards GABA use in human glioma cases and in other tumours which may rely on the effect of GABA use [28, 29, 45, 46]. Our IHC studies reveal that both IDH-mutant and wild-type gliomas express high levels of SSADH in contrast to normal brain, sug- gesting certain role for GABA in growth and survival in clinical tumours. This correlates to data of Human Pro- tein Atlas, where 90% of studied human gliomas showed moderate or high SSADH expression which indicates a significantly higher expression than normal brain tissue.
Related to these El-Habr and his co-workers have demon- strated that the accumulation of gamma-hydroxybutyrate (by-product of GABA in central nervous system) and the re- lated SSADH downregulation contribute to a less aggressive
a
b
c
Fig. 5GABA oxidation and SSADH expression differences in glioma cell lines; and common SSADH expression in human glioblastoma/glioma samples.aOxygen consumption rates after using GABA - as an energy substrate - in U251 wt, U251 IDH1m, U87 MG and U373 MG cells in D5030 (representative oxygen consumption curves - Seahorse measurements).bSSADH expression in U251 wt, U251 IDH1m, U87 MG and U373 MG cells (representative Western blot results).cSummarised data about the evaluation of SSADH expressions in wt and IDH1m human samples (upper diagram) and in different human glioma types (lower diagram) and representative IHC stainings with HE counterstaining (DAB-brown staining, magnification 200×; normal human brain tissue and kidney were used as controls). ODG-oligodendroglioma, AC-astrocytoma and GBM-primer glioblastoma
phenotype in glioblastoma cases. They found higher SSADH protein expression in glioma cells than in normal brain tis- sue. They also described that downregulation, lowered ex- pression and inhibited function of SSADH (shRNA silencing and gamma-hydroxybutyrate–structurally shows similarities to aKG and 2-HG – treatment) correlated to lower proliferation capacity of glioma cells in vitro and in vivo [47]. Regarding to high-grade gliomas which showed lower SSADH expression at mRNA level in TCGA database, in our study (47 cases were analysed), we could not confirm this difference at protein level. Based on our and others’re- sults, SSADH protein level is higher in almost all glioma cells than in normal tissues. These suggest that SSADH pro- tein overexpression at tissue level could have special tumour cell survival and growth promoting effect in both IDH-mutant and wild-type cases. To clarify the role of GABA metabolism, SSADH expression and functions need further studies using both mRNA and protein expression studies with patient follow-up. In these studies, overall sur- vival data evaluations and if it is possible some SSADH func- tion related analyses should be performed.
Our findings suggest that 2-HG may contribute to a less aggressive phenotype through its inhibitory effect on GABA oxidation. The detected SSADH overexpression in human cases could support GABA metabolism through either GABA oxidation or alternative GABA consump- tions. Regarding to our and others’results, GABA metab- olism of gliomas might be a possible novel entry point for therapy, especially in glioma patients with poor prognosis and limited treating opportunities.
Conclusions
As discussed above, evaluating the dominant bioener- getic pathways, preferred substrates (such as glutamine or GABA) which can support tumour growth could help to understand metabolic reprogramming and adaptation facility better in glioma cells, and to seek new alterna- tives for targeted therapy in this incurable aggressive dis- ease, respectively.
Additional files
Additional file 1:Figure S1.Simplified scheme of the examined bioenergetic pathways in the studied IDH1 wild-type and mutant glioma cells. In our study, different energy substrate oxidation and metabolic enzymes relating to the following bioenergetic pathways were analysed regarding the role of IDH1 mutation. Energy substrate oxidation: glucose, glutamine, citrate, GABA, acetate, malate, lactate and glutamine were measured by Seahorse technique. Energy metabolites - succinate, fumarate, malate, citrate,α-ketoglutarate, glutamate and 2- hydroxyglutarate were determined by liquid chromatography-mass spectrometry. Several protein expressions were measured by Western blot analysis or immunohistochemistry - Glycolysis: hexokinase 2 (HK2), phosphofructokinase P (PFKP), Glutaminolysis: alanine, serine, cysteine- preferring transporter 2 (ASCT2), glutaminase (Gls), GABA shunt: GABA transporter (GAT1), succinic semialdehyde dehydrogenase (SSADH), acetate consumption: acetyl-CoA synthetase 2 (ACSS2). Other
abbreviations can be found in the figure: GLUT1: glucose transporter 1, IDH: isocitrate dehydrogenase, LDH: lactate dehydrogenase, MCT1:
monocarboxylate transporter 1, OAC: oxaloacetate, SSA: succinic semialdehyde. (PDF 348 kb)
Additional file 2:Figure S2.Extracellular 2-HG levels after13C-substrate labellings detected by LC-MS in U251 IDH1m cells. a., 2-HG pool after 24 h following13C-substrates incubation: 4 mM U-13C-glutamine labelled intra- and extracellular 2-HG. b., 10 mM U-13C-glucose labelled extracellular 2-HG in D5030. c., 10 mM 2-13C-acetate labelled 2-HG in D5030. Unlabelled 2-HG did not contain incorporated13C atoms, M + 1/2/3/4/5 = mass number increased with 1/2/3/4 or 513C atoms in 2-HG from different labellings (the low rate of M + 4 is not visible in the figure). The labelling conditions were given in the legends of Fig3. (PDF 197 kb)
Additional file 3:Figure S3.Vigabatrin abolished the pro-proliferative effect of GABA a., The effect of GABA (5 mM), vigabatrin (0.6 mM) and GABA+vigabatrin on the proliferation of U251 wt glioma cells. SRB and Alamar Blue (AB) proliferation assays were used in 24-h treated cell cultures; b., Alterations in cell numbers (U251 wt cells) followed in every 4-day passage using 3-week continuous treatment, the average cell numbers were calculated from triplicates. (PDF 198 kb)
Abbreviations
2-HG:D-2-hydroxyglutarate; ACSS2: Acetyl-CoA synthetase 2; AML: Acute myeloid leukaemia; ASCT2: Alanine, serine, cysteine-preferring transporter 2;
ATPB:β-F1-ATPase; FH: Fumarate hydratase; GABA: Gamma-aminobutyric acid; GAT1: GABA transporter 1; Gls: Glutaminase; HK2: Hexokinase 2;
ICC: Intrahepatic cholangiocarcinoma; IDH: Isocitrate dehydrogenase;
IDH1m: IDH1-mutant; PFKP: Phosphofructokinase P; SDH: Succinate dehydrogenase; SSADH: Succinic semialdehyde dehydrogenase;
TCA: Tricarboxylic acid
Acknowledgements
We gratefully acknowledge to the clinicians (neurosurgeons, pathologists and oncologists) for their helpful work in the diagnosis and patients care and to Attila Patócs for the accessibility of LC-MS in his laboratory. The authors thank Géza Sáfrány who kindly provided U373 MG cell line in some experiments and László Kopper for his careful reading, helpful advice and discussion during the manuscript preparation. We are grateful to Gergely Sváb for his help in final Seahorse measurements and to Éva Mátrainé Balogh, Anna Tamási and Mónika Szilágyiné Paulusz for their technical assistance in histological processing of human biopsies.
Funding
Our work was supported by Bolyai Fellowship Program of the Hungarian Academy of Sciences and STIA (Scientific and Innovative Research Found of Semmelweis University) (A.S.) and Hungarian National Talent and National Excellence Programs (Z.H., I.K. and T.D.: supported by the ÚNKP-17-2/3 and ÚNKP-18-3 New National Excellence Program of the Ministry of Human Capacities); Z.H.’s research work was supported by Richter Centenarium Foundation Fellowship-2016. Recent research works at 1st Department of Pathology and Experimental Cancer Research were funded by NVKP_16-1- 2016-0004 grant of the Hungarian National Research, Development and Innovation Office (NKFIH).
Availability of data and materials
All data generated or analysed during this study are included in this manuscript. Further details are available on request.
Author’s contributions
We declare that all authors have contributed significantly and all authors are in agreement with the content of the manuscript. Conception and design: ZH, AS.
Development of methodology: ZH, GH, GP, IK, KM, NS. Acquisition of data (provided cell lines, provided facilities, etc.): WPJL, AJ, LT, AS. Analysis and interpretation of data (e.g. statistical analysis, biostatistics, computational analysis): ZH, GH, IK, TD, HR, WPJL, AS. Writing, review, and/or revision of the manuscript: ZH, AJ, WPJL, LT, AS. Administrative, technical, or material support (i.e. reporting or organising data, constructing databases): ZH, GP, IK, TD, KM.
Study supervision: AS. All authors read and approved the final manuscript.
Competing interests
The authors declare that they have no competing interests.
Ethics approval and consent to participate
The archived tissue samples were used with the approval of the Institutional Ethical Review Board (TUKEB no. 7/2006).
Consent for publication Not applicable.
Publisher’s Note
Springer Nature remains neutral with regard to jurisdictional claims in published maps and institutional affiliations.
Author details
11st Department of Pathology and Experimental Cancer Research,
Semmelweis University, Üllői út 26, Budapest 1085, Hungary.2Department of Medical Biochemistry, MTA-SE Laboratory for Neurobiochemistry,
Semmelweis University, Budapest 1444, Hungary.3Hungarian Academy of Sciences - Momentum Hereditary Endocrine Tumours Research Group, Semmelweis University - National Bionics Program, Budapest 1088, Hungary.
4Laboratory of Environmental Chemistry and Bioanalytics, Department of Analytical Chemistry, Institute of Chemistry, Eötvös Loránd University, Budapest 1518, Hungary.5Department of Biochemistry, Radboud University Medical Center, Nijmegen, The Netherlands.
Received: 19 April 2018 Accepted: 26 October 2018
References
1. Hartmann C, Meyer J, Balss J, Capper D, Mueller W, Christians A, et al. Type and frequency of IDH1 and IDH2 mutations are related to astrocytic and oligodendroglial differentiation and age: a study of 1,010 diffuse gliomas. Acta Neuropathol. 2009;118(4):469–74.https://doi.org/10.1007/s00401-009-0561-9.
2. Yan H, Bigner DD, Velculescu V, Parsons DW. Mutant metabolic enzymes are at the origin of gliomas. Cancer Res. 2009;69(24):9157–9.https://doi.org/10.
1158/0008-5472.
3. Molenaar RJ, Maciejewski JP, Wilmink JW, van Noorden CJF. Wild-type and mutated IDH1/2 enzymes and therapy responses. Oncogene 2018. 2018;
37(15):1949–60.https://doi.org/10.1038/s41388-017-0077-z.
4. Dang L, Yen K, Attar EC. IDH mutations in cancer and progress toward development of targeted therapeutics. Ann Oncol. 2016;27(4):599–608.
https://doi.org/10.1093/annonc/mdw013.
5. Miller JJ, Shih HA, Andronesi OC, Cahill DP. Isocitrate dehydrogenase- mutant glioma: evolving clinical and therapeutic implications. Cancer. 2017;
123(23):4535–46.https://doi.org/10.1002/cncr.31039.
6. Bai H, HarmancıAS, Erson-Omay EZ, Li J, Coşkun S, Simon M, et al.
Integrated genomic characterization of IDH1-mutant glioma malignant progression. Nat Genet. 2016;48(1):5966.https://doi.org/10.1038/ng.3457.
7. Turkalp Z, Karamchandani J, Das S. IDH mutation in glioma: new insights and promises for the future. JAMA Neurol. 2014;71(10):1319–25.https://doi.
org/10.1001/jamaneurol.2014.1205.
8. Dang L, Su SM. Isocitrate dehydrogenase mutation and (R)-2-
Hydroxyglutarate: from basic discovery to therapeutics development. Annu Rev Biochem. 2017;86:305–31.https://doi.org/10.1146/annurev-biochem- 061516-044732.
9. Waitkus MS, Diplas BH, Yan H. Isocitrate dehydrogenase mutations in gliomas.
Neuro-Oncology. 2016;18(1):16–26.https://doi.org/10.1093/neuonc/nov136.
10. Jalbert LE, Elkhaled A, Phillips JJ, Neill E, Williams A, Crane JC, et al.
Metabolic profiling of IDH mutation and malignant progression in infiltrating glioma. Sci Rep. 2017;7:44792.https://doi.org/10.1038/srep44792.
11. Dang L, White DW, Gross S, Bennett BD, Bittinger MA, Driggers EM, et al.
Cancerassociated IDH1 mutations produce 2-hydroxyglutarate. Nature. 2009;
462(7274):739–44.https://doi.org/10.1038/nature08617.
12. Strickland M, Stoll EA. Metabolic reprogramming in glioma. Front Cell Dev Biol. 2017;5:43.https://doi.org/10.3389/fcell.2017.00043.
13. Morin A, Letouzé E, Gimenez-Roqueplo AP, Favier J. Oncometabolites-driven tumorigenesis: from genetics to targeted therapy. Int J Cancer. 2014;135(10):
2237–48.
14. Clark O, Yen K, Mellinghoff IK. Molecular Pathways: Isocitrate Dehydrogenase Mutations in Cancer. Clin Cancer Res. 2016;22(8):1837–42.
15. Nowicki S, Gottlieb E. Oncometabolites: tailoring our genes. FEBS J. 2015;
282(15):2796805.https://doi.org/10.1111/febs.13295.
16. Salamanca-Cardona L, Shah H, Poot AJ, Correa FM, Di Gialleonardo V, Lui H, et al. In Vivo Imaging of Glutamine Metabolism to the Oncometabolite 2- Hydroxyglutarate in IDH1/2 Mutant Tumors. Cell Metab. 2017;26(6):830–841.
e3.https://doi.org/10.1016/j.cmet.2017.10.001.
17. Zhu L, Ploessl K, Zhou R, Mankoff D, Kung HF. Metabolic imaging of glutamine in Cancer. J Nucl Med. 2017;58(4):533–7.https://doi.org/10.2967/
jnumed.116.182345.
18. Mashimo T, Pichumani K, Vemireddy V, Hatanpaa KJ, Singh DK, Sirasanagandla S, et al. Acetate is a bioenergetic substrate for human glioblastoma and brain metastases. Cell. 2014;159(7):1603–14.https://doi.
org/10.1016/j.cell.2014.11.025.
19. Comerford SA, Huang Z, Du X, Wang Y, Cai L, Witkiewicz AK, et al. Acetate dependence of tumors. Cell. 2014;159(7):1591–602.https://doi.org/10.1016/j.
cell.2014.11.020.
20. Khurshed M, Molenaar RJ, Lenting K, Leenders WP, van Noorden CJF. In silico gene expression analysis reveals glycolysis and acetate anaplerosis in IDH1 wild-type glioma and lactate and glutamate anaplerosis in IDH1- mutated glioma. Oncotarget. 2017;8(30):49165–77.https://doi.org/10.18632/
oncotarget.17106.
21. van Lith SA, Navis AC, Verrijp K, Niclou SP, Bjerkvig R, Wesseling P, et al.
Glutamate as chemotactic fuel for diffuse glioma cells: are they glutamate suckers? Biochim Biophys Acta. 2014;1846(1):66–74.https://doi.org/10.1016/j.
bbcan.2014.04.004.
22. Maus A, Peters GJ. Glutamate andα-ketoglutarate: key players in glioma metabolism. Amino Acids. 2017;49(1):21–32.https://doi.org/10.1007/s00726- 016-2342-9.
23. Seltzer MJ, Bennett BD, Joshi AD, Gao P, Thomas AG, Ferraris DV, et al.
Inhibition of glutaminase preferentially slows growth of glioma cells with mutant IDH1. Cancer Res. 2010;70(22):8981–7.https://doi.org/10.1158/0008- 5472.CAN-10-1666.
24. Sciacovelli M, Gonçalves E, Johnson TI, Zecchini VR, da Costa AS, Gaude E, et al. Fumarate is an epigenetic modifier that elicits epithelial-to- mesenchymal transition. Nature. 2016;537(7621):544–7.https://doi.org/10.
1038/nature19353.
25. Esmaeili M, Hamans BC, Navis AC, van Horssen R, Bathen TF, Gribbestad IS, et al. IDH1 R132H mutation generates a distinct phospholipid metabolite profile in glioma. Cancer Res. 2014;74(17):4898–907.https://doi.org/10.1158/
0008-5472.CAN-14-0008.
26. Fack F, Tardito S, Hochart G, Oudin A, Zheng L, Fritah S, et al. Altered metabolic landscape in IDH-mutant gliomas affects phospholipid, energy, and oxidative stress pathways. EMBO Mol Med. 2017;9(12):1681–95.https://
doi.org/10.15252/emmm.201707729.
27. Schousboe A, Bak LK, Waagepetersen HS. Astrocytic Control of Biosynthesis and Turnover of the Neurotransmitters Glutamate and GABA. Front Endocrinol (Lausanne). 2013;4:102.https://doi.org/10.3389/fendo.2013.00102.
28. Lenting K, Khurshed M, Peeters TH, van den Heuvel CNAM, van Lith SAM, de Bitter T, et al. Isocitrate dehydrogenase 1-mutated human gliomas depend on lactate and glutamate to alleviate metabolic stress. FASEB J. 2018;33:
fj201800907RR.https://doi.org/10.1096/fj.201800907RR. [Epub ahead of print].
29. Neman J, Termini J, Wilczynski S, Vaidehi N, Choy C, Kowolik CM, et al.
Human breast cancer metastases to the brain display GABAergic properties in the neural niche. Proc Natl Acad Sci U S A. 2014;111(3):984–9.
30. Jády AG, Nagy ÁM, Kőhidi T, Ferenczi S, Tretter L, Madarász E. Differentiation dependent energy production and metabolite utilization: a comparative study on neural stem cells, neurons, and astrocytes. Stem Cells Dev. 2016;
25(13):995–1005.https://doi.org/10.1089/scd.2015.0388.
31. Németh B, Doczi J, Csete D, Kacso G, Ravasz D, Adams D, et al. Abolition of mitochondrial substrate-level phosphorylation by itaconic acid produced by LPS-induced Irg1 expression in cells of murine macrophage lineage. FASEB J. 2016;30(1):286–300.https://doi.org/10.1096/fj.15279398.
32. Nagy AM, Fekete R, Horvath G, Koncsos G, Kriston C, Sebestyen A, et al.
Versatility of microglial bioenergetics machinery under starving conditions.
Biochim Biophys Acta. 2018;1859(3):201–14.https://doi.org/10.1016/j.bbabio.
2017.12.002.
33. Szoboszlai N, Guo X, Ozohanics O, Oláh J, Gömöry Á, Mihucz VG, et al.
Determination of energy metabolites in cancer cells by porous graphitic carbon liquid chromatography electrospray ionization mass spectrometry for the assessment of energy metabolism. Anal Chim Acta. 2014;819:108–15.
https://doi.org/10.1016/j.aca.2014.01.055.
34. Hujber Z, Petővári G, Szoboszlai N, Dankó T, Nagy N, Kriston C, et al.
Rapamycin (mTORC1 inhibitor) reduces the production of lactate and 2- hydroxyglutarate oncometabolites in IDH1 mutant fibrosarcoma cells. J Exp Clin Cancer Res. 2017;36(1):74.https://doi.org/10.1186/s13046-0170544-y.
35. Krencz I, Sebestyén A, Fábián K, Márk Á, Moldvay J, Khoor A, et al.
Expression of mTORC1/2-related proteins in primary and brain metastatic lung adenocarcinoma. Hum Pathol. 2017;62:66–73.https://doi.org/10.1016/j.
humpath.2016.12.012.
36. Roth V. 2006 Doubling Time Computing, Available from:http://www.
doubling-time.com/compute.php
37. Lenting K, Verhaak R, ter Laan M, Wesseling P, Leenders W. Glioma:
experimental models and reality. Acta Neuropathol. 2017;133(2):263–82.
https://doi.org/10.1007/s00401017-1671-4.
38. Mazor T, Chesnelong C, Pankov A, Jalbert LE, Hong C. Hayes jet al. Clonal expansion and epigenetic reprogramming following deletion or
amplification of mutant IDH1. Proc Natl Acad Sci U S A. 2017;114(40):10743– 8.https://doi.org/10.1073/pnas.1708914114.
39. Wong CC, Qian Y, Yu J. Interplay between epigenetics and metabolism in oncogenesis: mechanisms and therapeutic approaches. Oncogene. 2017;
36(24):3359–74.https://doi.org/10.1038/onc.2016.485.
40. Jin Y, Elalaf H, Watanabe M, Tamaki S, Hineno S, Matsunaga K, et al. Mutant IDH1 dysregulates the differentiation of mesenchymal stem cells in association with GeneSpecific histone modifications to cartilage- and bone- related genes. PLoS One. 2015;10(7):e0131998.https://doi.org/10.1371/
journal.pone.0131998.
41. Navis AC, Niclou SP, Fack F, Stieber D, van Lith S, Verrijp K, et al. Increased mitochondrial activity in a novel IDH1-R132H mutant human
oligodendroglioma xenograft model: in situ detection of 2-HG andα-KG.
Acta Neuropathol Commun. 2013;1:18.https://doi.org/10.1186/2051-5960-1-18.
42. Young SZ, Bordey A. GABA's control of stem and cancer cell proliferation in adult neural and peripheral niches. Physiology (Bethesda). 2009;24:171–85.
https://doi.org/10.1152/physiol.00002.2009.
43. Takehara A, Hosokawa M, Eguchi H, Ohigashi H, Ishikawa O, Nakamura Y, Nakagawa H. Gamma-aminobutyric acid (GABA) stimulates pancreatic cancer growth through overexpressing GABAA receptor pi subunit. Cancer Res. 2007;67(20):9704–12.
44. Kuol N, Stojanovska L, Apostolopoulos V, Nurgali K. Role of the nervous system in cancer metastasis. J Exp Clin Cancer Res. 2018;37(1):5.https://doi.
org/10.1186/s13046-018-0674-x.
45. Knott EL, Miriyala S, Nam H, Panchatcharam M, Leidenheimer N. The role of the GABA shunt in prostate cancer metabolic reprogramming and aggressive. Cancer Res. 2018;78(13):5486.https://doi.org/10.1158/1538-7445.
AM2018-5486.
46. Schnepp PM, Lee DD, Guldner IH, O'Tighearnaigh TK, Howe EN, Palakurthi B, Eckert KE, Toni TA, Ashfeld BL, Zhang S. GAD1 upregulation programs aggressive features of Cancer cell metabolism in the brain metastatic microenvironment. Cancer Res. 2017;77(11):2844–56.
47. El-Habr EA, Dubois LG, Burel-Vandenbos F, Bogeas A, Lipecka J, Turchi L, et al. A driver role for GABA metabolism in controlling stem and proliferative cell state through GHB production in glioma. Acta Neuropathol. 2017;133(4):
645–60.https://doi.org/10.1007/s00401016-1659-5.