Article
Diverse Effect of Two Cytokinins, Kinetin and Benzyladenine, on Plant Development, Biotic Stress Tolerance, and
Gene Expression
Zoltán Bozsóand Balázs Barna *
Citation: Bozsó, Z.; Barna, B. Diverse Effect of Two Cytokinins, Kinetin and Benzyladenine, on Plant
Development, Biotic Stress Tolerance, and Gene Expression.Life2021,11, 1404. https://doi.org/10.3390/
life11121404
Academic Editor: Francois Lefort
Received: 22 November 2021 Accepted: 11 December 2021 Published: 15 December 2021
Publisher’s Note:MDPI stays neutral with regard to jurisdictional claims in published maps and institutional affil- iations.
Copyright: © 2021 by the authors.
Licensee MDPI, Basel, Switzerland.
This article is an open access article distributed under the terms and conditions of the Creative Commons Attribution (CC BY) license (https://
creativecommons.org/licenses/by/
4.0/).
Centre for Agricultural Research, ELKH, Plant Protection Institute, Herman OttóStr. 15, H-1022 Budapest, Hungary; bozso.zoltan@atk.hu
* Correspondence: barna.balazs@atk.hu
Abstract:The plant hormones cytokinins affect a various array of plant growth and development processes as well as responses to biotic and abiotic stresses. In this study, the opposite effect of two different cytokinins kinetin (N6-furfuryladenine) and benzyladenine (BA) on development and on the tolerance ofArabidopsisand tobacco plants to virus, bacteria, and fungi infection was reported.
Treatments of Arabidopsisand tobacco seedlings with saturated solutions of BA inhibited plant progress, while treatments with saturated water solution of kinetin promoted plant development.
Furthermore, BA pre-treatments strongly reduced the number of TMV (Tobacco mosaic virus) lesions on tobacco and the tissue damage caused by the incompatiblePseudomonasbacteria onArabidopsis and tobacco leaves. Similarly, BA pre-treatment significantly reduced the necrotic disease symptoms ofBotrytis cinereainfection. Kinetin pre-treatments had a much weaker or no protective effect on the damage caused by the above pathogens. Accordingly,Arabidopsisgene expression profiles after treatments also showed that the two cytokinins have different effects on several plant processes.
The gene expression results supported the more robust effect of BA, which up and downregulated more than 2000 genes, while only 436 genes were influenced by kinetin treatment. It is noteworthy that BA and kinetin treatment changed gene expressions in the same direction only in a relatively few cases (73 upregulated and 70 downregulated genes), and even 28 genes were regulated into the opposite directions by BA and kinetin. Both treatments had a strong effect on auxin and gibberellin- related genes, but only BA had a significant effect on cytokinin-induced processes. While kinetin exclusively activated the flavonoid synthesis genes, BA affected more significantly protein synthesis, photosynthesis, and plant defence-related genes. In conclusion, BA solution had sometimes the opposite and generally a much stronger effect than kinetin solution not only on the development and on biotic stress tolerance of tobacco andArabidopsisplants but also on the gene expressions.
The stronger protective effect of BA to necrotic stresses is probably due to its stronger senescence inhibitory effect on plant tissues, as supported by the stronger chlorophyll retardation of the BA- treated leaves.
Keywords:benzyladenine; kinetin;Arabidopsis; tobacco;Tobacco mosaic virus;Pseudomonas syringae;
Botrytis cinerea; gene expression changes; chlorophyll content
1. Introduction
Although much is known about cytokinins, still, many important open questions remain. Since in preliminary experiments, we found that kinetin and benzyladenine pre- treatments have different effects on the development ofArabidopsisplants, our aim was to compare the effect of these two cytokinins onArabidopsisand tobacco plants under the same conditions.
Cytokinins are a class of plant hormones that promote cell division, plant growth, and plant development, in addition to responses to abiotic and biotic stresses. Moreover, cytokinins have been shown to slow the senescence of plants and assembling nutrients
Life2021,11, 1404. https://doi.org/10.3390/life11121404 https://www.mdpi.com/journal/life
Life2021,11, 1404 2 of 21
from nearby tissues [1–4]. Furthermore, cytokinins are signalling molecules acting both locally and at a distance [5,6]. The first cytokinin to be identified was kinetin as a degra- dation product of DNA that promotes plant cell division. Evidence for the presence of kinetin in natural products has been provided by mass spectrometric analysis of DNA components [7]. Both benzyladenine and kinetin are adenine-type cytokinins with a similar chemical structure, but in BA, a benzyl group can be found instead of the furfuryl group. It is noteworthy that senescence was delayed by kinetin and BA in an oat leaf test, but not by natural cytokinins, zeatin, and isopentenyl adenine [8]. In addition, both benzyladenine and kinetin show antioxidant properties in human skin fibroblast and in mammalian cells [9,10].
Elevated cytokinin and auxin content has a pivotal role in keeping juvenility and the active metabolism of plant tissue infected by biotrophs, such as rust or powdery mildew (green island syndrome), and in directing nutrient transport to the infected plant parts.
On the other hand, it has been known for a long time that the senescence or juvenility of plant tissues has a strong effect on their reactions to abiotic stresses and pathogen attacks [11]. Generally, necrotrophic pathogens prefer senescent tissues, but biotrophic pathogens prefer juvenile tissues, while hemibiotrophic pathogens such asPseudomonas bacteria orPhytothora infestansare in some respect in between [12,13]. Accordingly, any type of inhibition of plant senescence, such as treatment with cytokinins or transformation with cytokinin biosynthesis genes shall improve the resistance of plants to necrosis-inducing necrotrophic pathogens such asBotrytis cinereaor Sclerotinia ssp., but it shall increase susceptibility to biotrophic pathogens such as powdery mildew or rust [14]. In addition, many studies demonstrate that a number of senescence-associated transcription factors (Sen-TFs) function as positive or negative regulators of plant immunity [11,13].
Although in the past decades, significant progress has been made in the understand- ing of the molecular mechanisms of plant disease resistance, still, there are many open questions [11,15–17]. This statement is also valid regarding the role of plant hormones and especially of cytokinins in plant immunity [18–20]. InArabidopsis, it was suggested that cytokinin-mediated resistance functions through SA-dependent mechanisms based on the finding that ARR2 (a positive regulator of cytokinin signalling) interacts with TGA3 (a transcription factor involved in inducing SA-responsive genes) in the regulation of the disease marker gene PR1 against biotrophic infections in plants [18]. Furthermore, cytokinin overexpressing transgenic plants and exogenous cytokinins feeding approaches unanimously resulted in “more cytokinins less disease symptoms” and vice versa [21].
Similarly, we also found that cytokinin overproduction induced the juvenility of plant tissues correlated with augmented antioxidant activities, and it is connected to elevated tolerance to necrotic symptoms caused by pathogens [14,22–24].
Here, we report on the diverse, sometimes opposite effect of the two cytokinins, kinetin and benzyladenine, onArabidopsisand tobacco plant development, chlorophyll content of senescent leaves, and their tolerance to virus, bacteria, and fungi, in addition to the effect on gene expressions.
2. Materials and Methods 2.1. Plant Materials and Pathogens
Experiments were carried out with the wild-type Columbia ecotype ofArabidopsis thaliana(L.) Heynh, andNicotiana tabacumL. cv. Xanthi-nc carrying the hypersensitiveN resistance gene to TMV. Seeds ofArabidopsisplants were sown into pots and kept 2 days at 5◦C in dark; then, they were put into a growth chamber for an 11 h photoperiod light/13 h dark, 140µmol m−2s−1fluorescent lightening. Tobacco plants were grown under standard greenhouse conditions (18–23◦C; about 16 h daylight with 160µmol m−2s−1supplemental light for 8 h per day; relative humidity: 75–80%).
Tobacco leaves were inoculated with a suspension of the U1 strain ofTobacco mosaic virus(TMV) as described earlier [25]. Briefly, the virus was maintained inN. tabacumcv.
Samsun plants carrying noNresistance gene, and leaves showing typical symptoms of
TMV infection were ground (1 g in 10 mL of 10 mM sodium phosphate buffer, pH 7.0) in a mortar, and the homogenate was used for inoculation.
Two strains of the hemibiotrophicPseudomonasbacteria were used: P. syringaepv.
syringae61 (P.s. pv. s. 61 [26]) and P. syringaepv. tomato strain DC3000 (P.s. pv. t.
DC3000 [27]). P.s. pv. s. 61 elicits the hypersensitive response (HR) in non-host plants.
P.s. pv.t. DC3000 is the cause of bacterial speck disease on tomato andArabidopsis, and it gives a compatible reaction on Columbia ecotype. Bacterial cultures were maintained on nutrient agar at 30◦C. Cultures were transferred to fresh medium 16 to 24 h prior to use. For infection, all fully developed plant leaves were brushed either with water (control) or with bacterial suspension (108cfu cm−3) [28]. In the case of tobacco, in addition to incompatibleP. s. pv. s. 61, suspensions of the compatibleP.s. pv. tabaci(P.s. pv. tabaci, NCAIM1 B.01601-National Collection of Agricultural and Industrial Microorganisms, Budapest, Hungary) bacteria were injected into the leaves and evaluated by scoring (from 0 to 4) the necrotic damage caused by bacterial suspensions injected into tobacco leaves 3 days post inoculation.
As a necrotrophic pathogen,Botrytis cinereastrain b05.10 [29] was used. Infection was carried out on leaves derived from 50–55-day-old tobacco plants treated with 10 mL water, BA, or kinetin solutions for 14 days. The leaves were placed on wet filter papers in glass Petri dishes (28 cm in diameter) and inoculated with 0.5 diameter agar discs fromBotrytis cinerea5-day-old culture. Evaluation of the symptoms was carried out by measuring lesion development on the leaves. The significance of the difference between two values of disease damage was evaluated byt-test.
2.2. Experimental Design and Chlorophyll Content Determination
Saturated water solutions of kinetin (0.349 mM) or BA (0.266 mM) were used for treatments throughout the experiments. Older and youngerArabidopsisand tobacco plants were used to examine the effect of the two cytokinins on plants of different ages. For Arabidopsistreatments, either plant leaves that were 45–50 days old were brushed with the solutions, orArabidopsisplants that were 30–35 days old were sprinkled with 5 mL solution to the root every day for 14 days. In the case of tobacco at an early seedling stage (35–40 days old) or at a later stage (50–55 days old), plants were sprinkled with 5 or 10 mL solution respectively to the root for 10 days. Water-treated plants were used as controls.
In separate experiments, Xanthi tobacco plants that were 50–55 days old were sprin- kled with saturated BA, saturated Kin, or water solutions in 3 groups. The first group of plants received 30 mL of cytokinin solutions only on the first day, the second group received theirs three days after the first doses had the second 30 mL (altogether 60 mL) of cytokinin solutions, and the third group of plants again after 3 days received a third 30 mL (altogether 90 mL) of test solutions.
Chlorophyll content was measured in the second fully developed leaves (from the soil level) of tobacco plants. Five weeks after the last treatment with the cytokinin solutions, chlorophyll was extracted with 80% acetone from tobacco leaves and determined at 647 and 660 nm as described earlier [30].
2.3. RNA Purification
For one RNA sample, approximately 100 mg of leaf tissues were collected from three BA, kinetin, or water-treated plants at indicated times. The samples were frozen in liquid nitrogen and stored at−70◦C. To obtain three independent biological replicates, sample collections were repeated with three plant generations. Total RNA was extracted from frozen tissues using Qiagen RNeasy Plant Mini kit and Qiagen Rnase-free Dnase Set (Qiagen, Germantown, MD, USA). RNA purity was determined through a Nanodrop ND- 1000 (NanoDrop Technologies Inc., Wilmington, DE, USA), and the integrity was checked by 2100 Bioanalyser (Agilent Technologies Inc., Santa Clara, CA, USA).
Life2021,11, 1404 4 of 21
2.4. Microarray
Agilent Arabidopsis (V4) Gene Expression Microarray, 4×44K Array (one glass slide formatted with four high-definition 44K arrays) were used for gene expression detections.
Amplification and labelling were performed according to the Agilent protocol (Two- Color Microarray-Based Gene Expression Analysis Version 6.7). The method uses a T7 RNA Polymerase Blend, which simultaneously amplifies the target material and incorporates Cyanine 3-CTP or Cyanine 5-CTP.
The hybridization protocol was processed through a hybridization oven (Agilent Technologies Inc., Santa Clara, CA, USA). Then, a gasket slide (Agilent Technologies Inc., Santa Clara, CA, USA) was stuck on the microarray slide and then put it in to Agilent Microarray Hybridization Chamber (Agilent Technologies Inc., Santa Clara, CA, USA). The hybridization master mix solution was prepared with components from a Gene Expression Hybridization Kit (Agilent Technologies Inc., Santa Clara, CA, USA) and prepared according to the Agilent protocol. Hybridization solution samples were mixed and loaded onto the gasket slide surface. Then, the microarray slide was added on the top of the gasket slide. Three assembled slides chambers were placed in a rotisserie in a hybridization oven, and they were hybridized for 17 h at 65◦C. The hybridization rotator was set to rotate at 10× g. Post-hybridization washing was done using Gene Expression Wash Buffer Kits with increasing stringency (Agilent Technologies Inc., Santa Clara, CA, USA). Microarrays were scanned with InnoScan 900 (Innopsys, Carbonne, France) at a resolution of 5 µm. Grid files (gpr file) were created in Mapix software (Innopsys, Carbonne, France) through a microarray image file and a microarray layout file (.gal file). All data processing was performed using functions from package limma in R.
We performed background correction by the method “normexp” [31] at first. As a second step, we performed within array normalization by the method “loess” [32–34], and then, we performed between array normalization by method “Aquantile” [35]. As a last step of data preprocessing, we replaced all groups of replicated probes by their average value.
The differential expression was also computed with use of package limma, particularly by functions lmFit, eBayes, and top Table.
2.5. Primer Design and Quantitative RT-PCR Analysis of Gene Expression
DNase-treated (TURBO DNA-free Kit, Thermofisher, Waltham, MA, USA) total RNA (1.5µg) was used for the synthesis of 20µL cDNA (High-Capacity cDNA Reverse Tran- scription Kit, Applied Biosystems) with random primers. Two and a halfµL from a 10-fold dilution of cDNA stock was used in each 15µL reaction using a qPCRBIO SyGreen Mix Lo-ROX (PCR Biosystems, London, UK) real-time PCR mix. The final primer concentra- tions in 15µL PCR reaction were 0.3µM. Real-time PCR amplifications were performed in a DNA Engine Opticon 2 thermocycler (MJ Research, Hercules, CA, USA). The cycling parameters were 95◦C for 3 min followed by 40 cycles of 95◦C for 10 s and 60◦C for 30 s. Melting curve runs were also performed at the end of each PCR reaction to verify the presence of a single product. Measured C(T) values were normalized to the constitu- tive expressed ubiquitin-conjugating enzyme AT1G14400 C(T) values (forward primer:
CTCTGTGACCCTAATCCGAATTCT; reverse primer: GCGCTTGCTTTCGCTGTAC). A total of 24 representative genes that showed significant expression changes in microarray experiments were used for qPCR validating measurements (Supplementary Table S2). The relative quantification of gene expression was carried out using the comparative cycle threshold [C(T)] method for the calculation of∆C(T) and∆∆C(T) values. Three biological replicates of treated (benzyladenine or kinetin) and untreated control samples were used for PCR, and the averages of the treated values were divided by the values of untreated values.
3. Results
3.1. Benzyladenine and Kinetin Have Different Effects on Plant Development
To compare the effects of BA and kinetin on plant phenotype, we treated plants with the two cytokines by various ways at different developmental stages ofArabidopsisand
Life2021,11, 1404 5 of 21
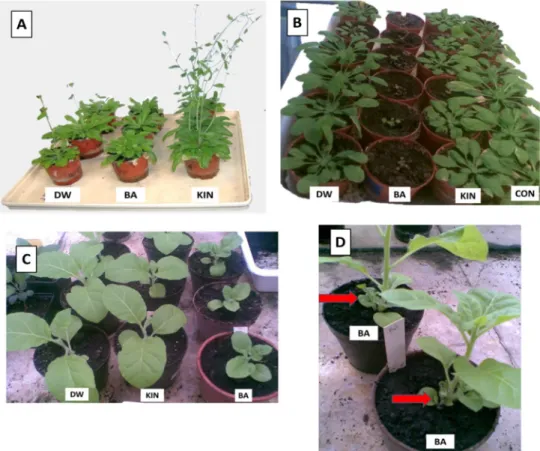
tobacco. Brushing ofArabidopsisleaves with BA solution inhibited the development of the flowering stem and induced thickening and curling of the central rosette leaves. In contrast, kinetin treatment rather promoted flowering, and no rosette leaf thickening or curling was observed (Figure1A). In addition, when BA solution was sprinkled at an early developmental stage to the roots, the development of bothArabidopsisand tobacco plants was strongly inhibited, while a similar application of kinetin had no visible effect (Figure1B,C). The application of BA solution to tobacco at later developmental stage by watering caused a rapid formation of small leaves close to the soil level (Figure1D), while the same application of kinetin had no or weak effect (data not shown).
kinetin) and untreated control samples were used for PCR, and the averages of the treated values were divided by the values of untreated values.
3. Results
3.1. Benzyladenine and Kinetin have Different Effects on Plant Development
To compare the effects of BA and kinetin on plant phenotype, we treated plants with the two cytokines by various ways at different developmental stages of Arabidopsis and tobacco. Brushing of Arabidopsis leaves with BA solution inhibited the development of the flowering stem and induced thickening and curling of the central rosette leaves. In contrast, kinetin treatment rather promoted flowering, and no rosette leaf thickening or curling was observed (Figure 1A). In addition, when BA solution was sprinkled at an early developmental stage to the roots, the development of both Arabidopsis and tobacco plants was strongly inhibited, while a similar application of kinetin had no visible effect (Figure 1B,C). The application of BA solution to tobacco at later developmental stage by watering caused a rapid formation of small leaves close to the soil level (Figure 1D), while the same application of kinetin had no or weak effect (data not shown).
Figure 1. Effect of distilled water (DW), benzyladenine (BA), or kinetin (KIN) solutions on Arabidopsis (A,B) and tobacco (C,D) development. Plant leaves were brushed with the solutions for 14 days (A) or sprinkled with 5 mL solution to the root at early seedling (B,C) or with 10 mL solutions for 10 days at a later stage (D). CON = non-treated control. On picture (D), the red arrows show the small leaves close to the soil level induced by BA treatment.
When older tobacco plants were treated with different doses of BA, it was observed that the effect of lower BA doses was weaker. Meanwhile, a 3 × 30 mL dose of saturated BA solution strongly (Figure 1D), 2 × 30 mL doses slightly, and the 1 × 30 mL dose did not induce the rapid formation of small leaves close to the soil level. The effect of kinetin Figure 1.Effect of distilled water (DW), benzyladenine (BA), or kinetin (KIN) solutions onArabidopsis (A,B) and tobacco (C,D) development. Plant leaves were brushed with the solutions for 14 days (A) or sprinkled with 5 mL solution to the root at early seedling (B,C) or with 10 mL solutions for 10 days at a later stage (D). CON = non-treated control. On picture (D), the red arrows show the small leaves close to the soil level induced by BA treatment.
When older tobacco plants were treated with different doses of BA, it was observed that the effect of lower BA doses was weaker. Meanwhile, a 3×30 mL dose of saturated BA solution strongly (Figure1D), 2×30 mL doses slightly, and the 1×30 mL dose did not induce the rapid formation of small leaves close to the soil level. The effect of kinetin compared to BA was weaker because kinetin solution at 3×30 mL dose caused a slight formation of small leaves at the soil level, while 2×30 mL and 1×30 mL doses caused no formation of small leaves at the soil level at all (data not shown).
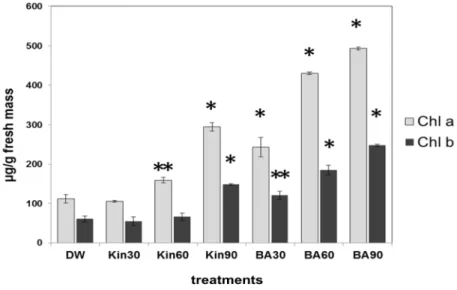
Since we found that high doses of cytokinins were able to inhibit the senescence of older tobacco leaves, the chlorophyll content as a senescence marker of these leaves was determined. The chlorophyll content of the second fully developed leaves (from the ground) of tobacco plants showed correlation with the amount of the applied cytokinins (Figure2).
Compared with kinetin, BA was more efficient in the retardation of both chlorophyll a and
Life2021,11, 1404 6 of 21
b degradation, but the highest dose of kinetin (3×30 mL) was more effective than the lowest doses of BA (1×30 mL). The lowest dose of kinetin (1×30 mL) had no inhibitory effect on chlorophyll degradation compared to control, water-treated tobacco leaves.
Life 2021, 11, 1404 6 of 22
compared to BA was weaker because kinetin solution at 3 × 30 mL dose caused a slight formation of small leaves at the soil level, while 2 × 30 mL and 1 × 30 mL doses caused no formation of small leaves at the soil level at all (data not shown).
Since we found that high doses of cytokinins were able to inhibit the senescence of older tobacco leaves, the chlorophyll content as a senescence marker of these leaves was determined. The chlorophyll content of the second fully developed leaves (from the ground) of tobacco plants showed correlation with the amount of the applied cytokinins (Figure 2). Compared with kinetin, BA was more efficient in the retardation of both chlorophyll a and b degradation, but the highest dose of kinetin (3 × 30 mL) was more effective than the lowest doses of BA (1 × 30 mL). The lowest dose of kinetin (1 × 30 mL) had no inhibitory effect on chlorophyll degradation compared to control, water-treated tobacco leaves.
Figure 2. Chlorophyll a and b contents (µg/g fresh mass) of leaves from Xanthi tobacco plants pre-treated with distilled water (DW), 30 mL (1 × 30), 60 mL (2 × 30), or 90 mL (3 × 30) of saturated benzyladenine (BA) or kinetin (KIN) solutions. Chlorophyll contents were determined five weeks after the last treatment with the cytokinin solutions. Bars represent mean ± standard deviations of three replicates of a representative experiment from two independent experiments with similar results. The significant difference from the corresponding water-treated control was determined (*
p < 0.005, ** p < 0.05, two-tailed t-test).
3.2. Benzyladenine and Kinetin have Different Effect on Biotic Stress Tolerance
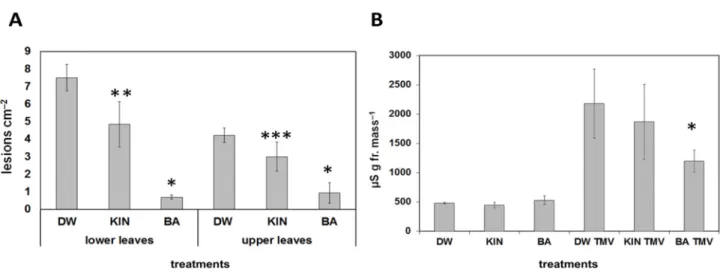
Pre-treatments with the BA or kinetin had a different effect on the reactions of plants to pathogen infections as well. Tobacco mosaic virus (TMV) induced necrotic lesions in the incompatible reactions on leaves of Nicotiana tabacum cv. Xanthi nc tobacco. The lesion number caused by TMV infection was strongly and significantly reduced both on lower or upper leaves as compared to water-treated leaves if tobacco plants were sprinkled every day for 10 days with BA solution before infection. On the other hand, pre-treatment with kinetin solution had a more slight effect on lesion number both on lower and upper leaves as compared to the control water-treated plants (Figure 3A).
Figure 2. Chlorophyll a and b contents (µg/g fresh mass) of leaves from Xanthi tobacco plants pre-treated with distilled water (DW), 30 mL (1×30), 60 mL (2×30), or 90 mL (3×30) of saturated benzyladenine (BA) or kinetin (KIN) solutions. Chlorophyll contents were determined five weeks after the last treatment with the cytokinin solutions. Bars represent mean±standard deviations of three replicates of a representative experiment from two independent experiments with similar results. The significant difference from the corresponding water-treated control was determined (*p< 0.005, **p< 0.05, two-tailedt-test).
3.2. Benzyladenine and Kinetin Have Different Effect on Biotic Stress Tolerance
Pre-treatments with the BA or kinetin had a different effect on the reactions of plants to pathogen infections as well.Tobacco mosaic virus(TMV) induced necrotic lesions in the incompatible reactions on leaves ofNicotiana tabacumcv. Xanthi nc tobacco. The lesion number caused by TMV infection was strongly and significantly reduced both on lower or upper leaves as compared to water-treated leaves if tobacco plants were sprinkled every day for 10 days with BA solution before infection. On the other hand, pre-treatment with kinetin solution had a more slight effect on lesion number both on lower and upper leaves as compared to the control water-treated plants (Figure3A).
Ion leakage correlates well with the membrane damage during necrosis development, and it is a good marker of cell damage; therefore, conductivity measurements were carried out as well. Similarly to lesion numbers, ion leakage from TMV-infected tobacco leaf discs was significantly reduced when the plants were pre-treated with BA as compared to water-treated controls, but no significant difference was found when tobacco plants were pre-treated with kinetin solution (Figure3B). The effect of different doses of the two cytokinins on TMV-induced lesions on Xanthi tobacco leaves was also tested. We found that the higher the amount of BA or kinetin, the less the number of TMV-induced lesions.
Again, BA had a stronger effect than kinetin, but the highest dose of kinetin was more effective at suppressing TMV lesions than the lowest dose of BA (Figure4).
Life2021,11, 1404 7 of 21
Life 2021, 11, 1404 7 of 22
Figure 3. Effect of water (DW), kinetin (KIN), or benzyladenine (BA) pre-treatment on TMV infection on Xanthi nc.
tobacco leaves. Infection was carried out 2 days after the last treatment. (A) Number of lesions on lower and upper TMV-infected leaves. * p < 0.001, ** p < 0.05, *** p < 0.1 two-tailed t-test. (B) Ion leakage from TMV-infected leaf discs of water (DW), kinetin (KIN), or benzyladenine (BA) pre-treated tobaccos. Bars represent the mean ± standard deviations of three replicates of a representative experiment from three independent experiments with similar results. The significant difference from the corresponding water-treated control was determined (* p < 0.05, two-tailed t-test).
Ion leakage correlates well with the membrane damage during necrosis development, and it is a good marker of cell damage; therefore, conductivity measurements were carried out as well. Similarly to lesion numbers, ion leakage from TMV-infected tobacco leaf discs was significantly reduced when the plants were pre-treated with BA as compared to water-treated controls, but no significant difference was found when tobacco plants were pre-treated with kinetin solution (Figure 3B). The effect of different doses of the two cytokinins on TMV-induced lesions on Xanthi tobacco leaves was also tested. We found that the higher the amount of BA or kinetin, the less the number of TMV-induced lesions. Again, BA had a stronger effect than kinetin, but the highest dose of kinetin was more effective at suppressing TMV lesions than the lowest dose of BA (Figure 4).
Figure 4. Effect of pre-treatments with various doses (30 mL (1 × 30), 60 mL (2 × 30), and 90 mL (3 × 30)) of saturated benzyladenine (BA), kinetin (KIN), or distilled water (DW) on the number of TMV lesions on Xanthi tobacco leaves (3 dpi). Infection was carried out 2 days after the last treatment.
Bars represent mean ± standard deviations of three replicates of a representative experiment from two independent experiments with similar results. The significant difference from the corresponding water-treated control was determined (* p < 0.001, ** p < 0.05, two-tailed t-test).
Figure 3.Effect of water (DW), kinetin (KIN), or benzyladenine (BA) pre-treatment on TMV infection on Xanthi nc. tobacco leaves. Infection was carried out 2 days after the last treatment. (A) Number of lesions on lower and upper TMV-infected leaves. *p< 0.001, **p< 0.05, ***p< 0.1 two-tailedt-test. (B) Ion leakage from TMV-infected leaf discs of water (DW), kinetin (KIN), or benzyladenine (BA) pre-treated tobaccos. Bars represent the mean±standard deviations of three replicates of a representative experiment from three independent experiments with similar results. The significant difference from the corresponding water-treated control was determined (*p< 0.05, two-tailedt-test).
Figure 3. Effect of water (DW), kinetin (KIN), or benzyladenine (BA) pre-treatment on TMV infection on Xanthi nc.
tobacco leaves. Infection was carried out 2 days after the last treatment. (A) Number of lesions on lower and upper TMV-infected leaves. * p < 0.001, ** p < 0.05, *** p < 0.1 two-tailed t-test. (B) Ion leakage from TMV-infected leaf discs of water (DW), kinetin (KIN), or benzyladenine (BA) pre-treated tobaccos. Bars represent the mean ± standard deviations of three replicates of a representative experiment from three independent experiments with similar results. The significant difference from the corresponding water-treated control was determined (* p < 0.05, two-tailed t-test).
Ion leakage correlates well with the membrane damage during necrosis development, and it is a good marker of cell damage; therefore, conductivity measurements were carried out as well. Similarly to lesion numbers, ion leakage from TMV-infected tobacco leaf discs was significantly reduced when the plants were pre-treated with BA as compared to water-treated controls, but no significant difference was found when tobacco plants were pre-treated with kinetin solution (Figure 3B). The effect of different doses of the two cytokinins on TMV-induced lesions on Xanthi tobacco leaves was also tested. We found that the higher the amount of BA or kinetin, the less the number of TMV-induced lesions. Again, BA had a stronger effect than kinetin, but the highest dose of kinetin was more effective at suppressing TMV lesions than the lowest dose of BA (Figure 4).
Figure 4. Effect of pre-treatments with various doses (30 mL (1 × 30), 60 mL (2 × 30), and 90 mL (3 × 30)) of saturated benzyladenine (BA), kinetin (KIN), or distilled water (DW) on the number of TMV lesions on Xanthi tobacco leaves (3 dpi). Infection was carried out 2 days after the last treatment.
Bars represent mean ± standard deviations of three replicates of a representative experiment from two independent experiments with similar results. The significant difference from the corresponding water-treated control was determined (* p < 0.001, ** p < 0.05, two-tailed t-test).
Figure 4. Effect of pre-treatments with various doses (30 mL (1×30), 60 mL (2×30), and 90 mL (3×30)) of saturated benzyladenine (BA), kinetin (KIN), or distilled water (DW) on the number of TMV lesions on Xanthi tobacco leaves (3 dpi). Infection was carried out 2 days after the last treatment.
Bars represent mean±standard deviations of three replicates of a representative experiment from two independent experiments with similar results. The significant difference from the corresponding water-treated control was determined (*p< 0.001, **p< 0.05, two-tailedt-test).
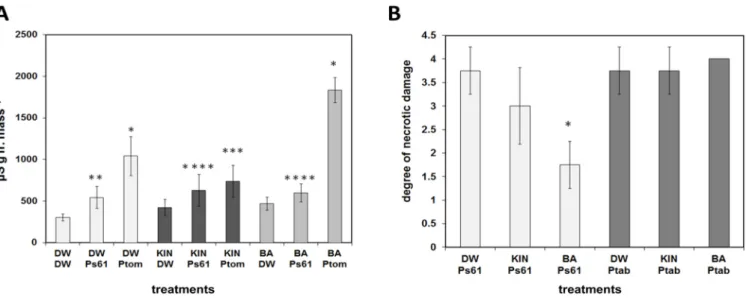
Furthermore, the effect of pre-treatments with BA or kinetin on the reaction of plants to incompatible and compatible bacteria gave similar but somewhat surprising results.
Electrolyte leakage from water, BA, or kinetin pre-treatedArabidopsisleaves after inocula- tion (brushing with bacterial suspension) with incompatibleP.s.pv.s.61 or compatibleP.s.
pv.t.DC3000 bacteria were measured 3 days after infection (Figure5A). It is noteworthy that BA and kinetin treatments alone increased ion leakage. In water pre-treated leaves, the incompatible bacteria caused a significant 78% increase in conductivity (leakage of electrolytes) compared to its non-infected control, indicating the damage of plant cell membranes during HR in control leaves. In kinetin pre-treated leaves, the conductivity increase caused by the incompatible bacteria was smaller (49% increase as compared to its
Life2021,11, 1404 8 of 21
kinetin-treated non-infected control), and it was almost abolished in BA pre-treated plants (only 27% increase as compared to its non-infected control) (Figure5A). Thus, similarly to TMV infection, the cell death and necrosis suppressor effect of BA was strong, while that of kinetin was much less expressed. On the other hand, as compared to the incompatible one, the compatible hemi-biotrophic bacteria caused much stronger leakage of electrolytes 3 dpi, which is probably due to vigorous multiplication and leaf spot disease-inducing ability of the bacteria in susceptible leaves (Figure5A). However, surprisingly, while in BA, pre-treated leaves infection withP.s. pv. t. DC3000 bacteria increased ion leakage by 293% (compared to BA pre-treated non-infected leaves) and in water-treated control leaves by 241% (compared to non-infected control), in kinetin pre-treated leaves infection withP.s. pv.t.DC3000 bacteria increased ion leakage only by 75%. Thus, in this respect, BA and kinetin treatments had the opposite effect on the reaction ofArabidopsisleaves to compatible bacteria since BA increased and kinetin decreased ion leakage.
Life 2021, 11, 1404 8 of 22
Furthermore, the effect of pre-treatments with BA or kinetin on the reaction of plants to incompatible and compatible bacteria gave similar but somewhat surprising results.
Electrolyte leakage from water, BA, or kinetin pre-treated Arabidopsis leaves after inoculation (brushing with bacterial suspension) with incompatible P.s. pv. s. 61 or compatible P.s. pv. t. DC3000 bacteria were measured 3 days after infection (Figure 5A).
It is noteworthy that BA and kinetin treatments alone increased ion leakage. In water pre-treated leaves, the incompatible bacteria caused a significant 78% increase in conductivity (leakage of electrolytes) compared to its non-infected control, indicating the damage of plant cell membranes during HR in control leaves. In kinetin pre-treated leaves, the conductivity increase caused by the incompatible bacteria was smaller (49%
increase as compared to its kinetin-treated non-infected control), and it was almost abolished in BA pre-treated plants (only 27% increase as compared to its non-infected control) (Figure 5A). Thus, similarly to TMV infection, the cell death and necrosis suppressor effect of BA was strong, while that of kinetin was much less expressed. On the other hand, as compared to the incompatible one, the compatible hemi-biotrophic bacteria caused much stronger leakage of electrolytes 3 dpi, which is probably due to vigorous multiplication and leaf spot disease-inducing ability of the bacteria in susceptible leaves (Figure 5A). However, surprisingly, while in BA, pre-treated leaves infection with P.s. pv. t. DC3000 bacteria increased ion leakage by 293% (compared to BA pre-treated non-infected leaves) and in water-treated control leaves by 241% (compared to non-infected control), in kinetin pre-treated leaves infection with P.s. pv. t. DC3000 bacteria increased ion leakage only by 75%. Thus, in this respect, BA and kinetin treatments had the opposite effect on the reaction of Arabidopsis leaves to compatible bacteria since BA increased and kinetin decreased ion leakage.
Figure 5. (A) Electrolyte leakage from water (DW), kinetin (KIN), or benzyladenine (BA) pre-treated Arabidopsis leaves at 3 dpi after inoculation with water (DW), incompatible P. s. pv. s. 61 (Ps61), or compatible P. s. pv. t. DC3000 (Ptom) bacteria. * p < 0.01, ** p < 0.05, *** p < 0.1, **** p < 0.2 two-tailed t-test. (B) The reaction of water (DW), kinetin (KIN), or benzyladenine (BA) pre-treated tobacco plant leaves to incompatible P.s. pv. s. 61 (Ps61) or compatible P.s. pv. tabaci (Ptab) bacteria at 3 dpi as evaluated by scoring (from 0 to 4) the necrotic damage caused by bacterial suspensions injected into tobacco leaves. W = water. * p = 0.001 two-tailed t-test. Bars represent mean ± standard deviations of three replicates of a representative experiment from three independent experiments with similar results. The significant difference from the corresponding water-treated control was determined.
Figure 5.(A) Electrolyte leakage from water (DW), kinetin (KIN), or benzyladenine (BA) pre-treatedArabidopsisleaves at 3 dpi after inoculation with water (DW), incompatibleP. s. pv. s.61 (Ps61), or compatibleP. s. pv. t.DC3000 (Ptom) bacteria.
*p< 0.01, **p< 0.05, ***p< 0.1, ****p< 0.2 two-tailedt-test. (B) The reaction of water (DW), kinetin (KIN), or benzyladenine (BA) pre-treated tobacco plant leaves to incompatibleP.s. pv. s. 61 (Ps61) or compatibleP.s. pv. tabaci(Ptab) bacteria at 3 dpi as evaluated by scoring (from 0 to 4) the necrotic damage caused by bacterial suspensions injected into tobacco leaves.
W = water. *p= 0.001 two-tailedt-test. Bars represent mean±standard deviations of three replicates of a representative experiment from three independent experiments with similar results. The significant difference from the corresponding water-treated control was determined.
In tobacco, by measuring the reaction of leaves to incompatibleP.s.pv.s.61 or com- patibleP.s.pv.tabacibacteria, we got similar results, although the injection of compatible bacteria into tobacco leaves caused much stronger damage (disease development) than brushingArabidopsisleaves with the same bacterial suspension. Therefore, the compatible bacteria caused total necrotization (score 4) of the injected leaf area in BA treated and only slightly less strong necrosis in water or kinetin-treated plants 3 days post inoculation (Figure5B). On the other hand, the hypersensitive necrotic response caused by the incom- patible bacteria was significantly suppressed again in leaves of BA pre-treated (46.7%) and not significantly in the kinetin pre-treated (80%) tobacco plants as compared to the water-treated (100%) ones (Figure5B).
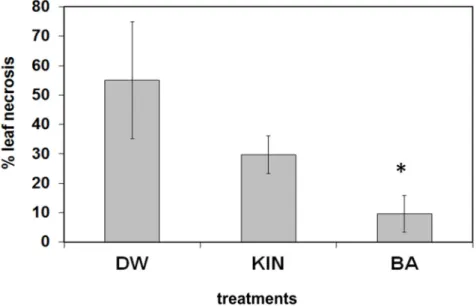
In order to learn the effect of the above cytokinin pre-treatments on the reaction of plants to necrotrophic fungi, leaves from BA or kinetin-treated tobacco plants were infected with agar discs fromBotrytis cinerea5-day-old culture and kept on wet filter paper in a Petri dish. As it can be seen from Figure6, the pathogen caused very severe necrotic symptoms on leaves from water-treated plants, somewhat less on leaves from kinetin-treated plants,
Life2021,11, 1404 9 of 21
and significantly less on leaves from BA-treated plants, as is quantified by percentage of leaf necrosis.
In tobacco, by measuring the reaction of leaves to incompatible P.s. pv. s. 61 or compatible P.s. pv. tabaci bacteria, we got similar results, although the injection of compatible bacteria into tobacco leaves caused much stronger damage (disease development) than brushing Arabidopsis leaves with the same bacterial suspension.
Therefore, the compatible bacteria caused total necrotization (score 4) of the injected leaf area in BA treated and only slightly less strong necrosis in water or kinetin-treated plants 3 days post inoculation (Figure 5B). On the other hand, the hypersensitive necrotic response caused by the incompatible bacteria was significantly suppressed again in leaves of BA pre-treated (46.7%) and not significantly in the kinetin pre-treated (80%) tobacco plants as compared to the water-treated (100%) ones (Figure 5B).
In order to learn the effect of the above cytokinin pre-treatments on the reaction of plants to necrotrophic fungi, leaves from BA or kinetin-treated tobacco plants were infected with agar discs from Botrytis cinerea 5-day-old culture and kept on wet filter paper in a Petri dish. As it can be seen from Figure 6, the pathogen caused very severe necrotic symptoms on leaves from water-treated plants, somewhat less on leaves from kinetin-treated plants, and significantly less on leaves from BA-treated plants, as is quantified by percentage of leaf necrosis.
Figure 6. Effect of water (DW), kinetin (KIN), or benzyladenine (BA) pre-treatment on Botrytis cinerea infection on tobacco leaves. Pre-treated leaves were removed from tobacco plants and infected with a 0.5 cm in diameter agar culture disk of the pathogen in glass Petri dishes After 5 days, the extent of pathogen-induced leaf necrosis relative to the total leaf area was determined.
Bars represent mean ± standard deviations of three replicates of a representative experiment from three independent experiments with similar results. The significant difference from the corresponding water-treated control was determined (* p = 0.019 two-tailed t-test).
3.3. Benzyladenine Causes Stronger Transcriptomic Alterations Than Kinetin in Arabidopsis Leaves
In order to obtain a wider picture of the plant responses to different cytokinin treatments and to find some answer for the possible background of different responses, we performed transcriptomic experiments. For gene expression measurements, Arabidopsis plants were treated with leaf brushing with BA or kinetin, and water-treated plants were used as a control. The transcriptomic changes were measured by Agilent Arabidopsis (V4) Gene Expression Microarray (4 × 44K). Gene expressions data of the microarray assays confirmed the diverse results of development and pathogen stress in BA and kinetin-treated plants.
Figure 6.Effect of water (DW), kinetin (KIN), or benzyladenine (BA) pre-treatment onBotrytis cinerea infection on tobacco leaves. Pre-treated leaves were removed from tobacco plants and infected with a 0.5 cm in diameter agar culture disk of the pathogen in glass Petri dishes After 5 days, the extent of pathogen-induced leaf necrosis relative to the total leaf area was determined. Bars represent mean
±standard deviations of three replicates of a representative experiment from three independent experiments with similar results. The significant difference from the corresponding water-treated control was determined (*p= 0.019 two-tailedt-test).
3.3. Benzyladenine Causes Stronger Transcriptomic Alterations Than Kinetin in Arabidopsis Leaves
In order to obtain a wider picture of the plant responses to different cytokinin treat- ments and to find some answer for the possible background of different responses, we performed transcriptomic experiments. For gene expression measurements,Arabidopsis plants were treated with leaf brushing with BA or kinetin, and water-treated plants were used as a control. The transcriptomic changes were measured by Agilent Arabidopsis (V4) Gene Expression Microarray (4 × 44K). Gene expressions data of the microarray assays confirmed the diverse results of development and pathogen stress in BA and kinetin-treated plants.
After data processing, the results showed that at a significance level of adj.P.Val < 0.05, only the BA treatment caused transcriptomic alterations compared to water-treated control.
However, at a slightly lower significance level (adj.P.Val < 0.07), the kinetin treatment also showed many gene expression alterations. To confirm the reliability of the expression data at adj.P.Val < 0.07, we performed qPCR measurements with 24 representative genes. We choose three representative genes from the eight group of genes (BA repressed/kinetin activated, BA activated/kinetin repressed, both BA and kinetin activated, both BA and kinetin repressed, only BA activated, only BA repressed, only kinetin activated, only kinetin repressed). The results of the qPCR tests practically corresponded to the microarray data. As it can be seen from Supplementary Table S2 and Figure 7, the qPCR results showed the same tendency and similar values as the microarray experiments (Pearson correlation coefficient value of R is: 0.9523). Since the gene expression data were reliable at adj.P.Val < 0.07, the results were further analysed at this significance level. BA treatments upregulated 1011 genes and downregulated 1011 genes, which were not changed after kinetin treatment (Figure8).
Life2021,11, 1404 10 of 21
Life 2021, 11, 1404 10 of 22
After data processing, the results showed that at a significance level of adj.P.Val <
0.05, only the BA treatment caused transcriptomic alterations compared to water-treated control. However, at a slightly lower significance level (adj.P.Val < 0.07), the kinetin treatment also showed many gene expression alterations. To confirm the reliability of the expression data at adj.P.Val < 0.07, we performed qPCR measurements with 24 representative genes. We choose three representative genes from the eight group of genes (BA repressed/kinetin activated, BA activated/kinetin repressed, both BA and kinetin activated, both BA and kinetin repressed, only BA activated, only BA repressed, only kinetin activated, only kinetin repressed). The results of the qPCR tests practically corresponded to the microarray data. As it can be seen from Supplementary Table S2 and Figure 7, the qPCR results showed the same tendency and similar values as the microarray experiments (Pearson correlation coefficient value of R is: 0.9523). Since the gene expression data were reliable at adj.P.Val < 0.07, the results were further analysed at this significance level. BA treatments upregulated 1011 genes and downregulated 1011 genes, which were not changed after kinetin treatment (Figure 8).
Figure 7. Comparison of expression changes of selected Arabidopsis genes detected with microarray and real-time RT-PCR after kinetin (KIN) or benzyladenine (BA) treatments. X-axes show the average log2 transcription activation or repression detected with microarray (up or downregulated in kinetin or benzyl adenine treatments leaves compared to water-treated control). Y-axes show the average log2 transcription activation or repression detected with real-time RT-PCR (up or downregulated in kinetin or benzyladenine treatments leaves compared to water-treated control).
Figure 8. Number of up and downregulated genes after benzyladenine or kinetin treatments in Arabidopsis leaves. The figure shows the results of the microarray experiments. Genes activated or repressed significantly at least two times compared to water-treated control was indicated. = upregulated genes, = downregulated genes, =genes regulated by the treatments to opposite directions.
Figure 7.Comparison of expression changes of selectedArabidopsisgenes detected with microarray and real-time RT-PCR after kinetin (KIN) or benzyladenine (BA) treatments. X-axes show the average log2transcription activation or repression detected with microarray (up or downregulated in kinetin or benzyl adenine treatments leaves compared to water-treated control). Y-axes show the average log2transcription activation or repression detected with real-time RT-PCR (up or downregulated in kinetin or benzyladenine treatments leaves compared to water-treated control).
Life 2021, 11, 1404 10 of 22
After data processing, the results showed that at a significance level of adj.P.Val <
0.05, only the BA treatment caused transcriptomic alterations compared to water-treated control. However, at a slightly lower significance level (adj.P.Val < 0.07), the kinetin treatment also showed many gene expression alterations. To confirm the reliability of the expression data at adj.P.Val < 0.07, we performed qPCR measurements with 24 representative genes. We choose three representative genes from the eight group of genes (BA repressed/kinetin activated, BA activated/kinetin repressed, both BA and kinetin activated, both BA and kinetin repressed, only BA activated, only BA repressed, only kinetin activated, only kinetin repressed). The results of the qPCR tests practically corresponded to the microarray data. As it can be seen from Supplementary Table S2 and Figure 7, the qPCR results showed the same tendency and similar values as the microarray experiments (Pearson correlation coefficient value of R is: 0.9523). Since the gene expression data were reliable at adj.P.Val < 0.07, the results were further analysed at this significance level. BA treatments upregulated 1011 genes and downregulated 1011 genes, which were not changed after kinetin treatment (Figure 8).
Figure 7. Comparison of expression changes of selected Arabidopsis genes detected with microarray and real-time RT-PCR after kinetin (KIN) or benzyladenine (BA) treatments. X-axes show the average log2 transcription activation or repression detected with microarray (up or downregulated in kinetin or benzyl adenine treatments leaves compared to water-treated control). Y-axes show the average log2 transcription activation or repression detected with real-time RT-PCR (up or downregulated in kinetin or benzyladenine treatments leaves compared to water-treated control).
Figure 8. Number of up and downregulated genes after benzyladenine or kinetin treatments in Arabidopsis leaves. The figure shows the results of the microarray experiments. Genes activated or repressed significantly at least two times compared to water-treated control was indicated. = upregulated genes, = downregulated genes, =genes regulated by the treatments to opposite directions.
Figure 8.Number of up and downregulated genes after benzyladenine or kinetin treatments in Arabidopsisleaves. The figure shows the results of the microarray experiments. Genes activated or repressed significantly at least two times compared to water-treated control was indicated.
Life 2021, 11, 1404 10 of 22
After data processing, the results showed that at a significance level of adj.P.Val <
0.05, only the BA treatment caused transcriptomic alterations compared to water-treated control. However, at a slightly lower significance level (adj.P.Val < 0.07), the kinetin treatment also showed many gene expression alterations. To confirm the reliability of the expression data at adj.P.Val < 0.07, we performed qPCR measurements with 24 representative genes. We choose three representative genes from the eight group of genes (BA repressed/kinetin activated, BA activated/kinetin repressed, both BA and kinetin activated, both BA and kinetin repressed, only BA activated, only BA repressed, only kinetin activated, only kinetin repressed). The results of the qPCR tests practically corresponded to the microarray data. As it can be seen from Supplementary Table S2 and Figure 7, the qPCR results showed the same tendency and similar values as the microarray experiments (Pearson correlation coefficient value of R is: 0.9523). Since the gene expression data were reliable at adj.P.Val < 0.07, the results were further analysed at this significance level. BA treatments upregulated 1011 genes and downregulated 1011 genes, which were not changed after kinetin treatment (Figure 8).
Figure 7. Comparison of expression changes of selected Arabidopsis genes detected with microarray and real-time RT-PCR after kinetin (KIN) or benzyladenine (BA) treatments. X-axes show the average log2 transcription activation or repression detected with microarray (up or downregulated in kinetin or benzyl adenine treatments leaves compared to water-treated control). Y-axes show the average log2 transcription activation or repression detected with real-time RT-PCR (up or downregulated in kinetin or benzyladenine treatments leaves compared to water-treated control).
Figure 8. Number of up and downregulated genes after benzyladenine or kinetin treatments in Arabidopsis leaves. The figure shows the results of the microarray experiments. Genes activated or
repressed signify a at least water-treated control was indicated.
= upregulated genes, = downregulated genes, =genes regulated by the treatments to opposite directions.
= upregulated genes,
Life 2021, 11, 1404 10 of 22
After data processing, the results showed that at a significance level of adj.P.Val <
0.05, only the BA treatment caused transcriptomic alterations compared to water-treated control. However, at a slightly lower significance level (adj.P.Val < 0.07), the kinetin treatment also showed many gene expression alterations. To confirm the reliability of the expression data at adj.P.Val < 0.07, we performed qPCR measurements with 24 representative genes. We choose three representative genes from the eight group of genes (BA repressed/kinetin activated, BA activated/kinetin repressed, both BA and kinetin activated, both BA and kinetin repressed, only BA activated, only BA repressed, only kinetin activated, only kinetin repressed). The results of the qPCR tests practically corresponded to the microarray data. As it can be seen from Supplementary Table S2 and Figure 7, the qPCR results showed the same tendency and similar values as the microarray experiments (Pearson correlation coefficient value of R is: 0.9523). Since the gene expression data were reliable at adj.P.Val < 0.07, the results were further analysed at this significance level. BA treatments upregulated 1011 genes and downregulated 1011 genes, which were not changed after kinetin treatment (Figure 8).
Figure 7. Comparison of expression changes of selected Arabidopsis genes detected with microarray and real-time RT-PCR after kinetin (KIN) or benzyladenine (BA) treatments. X-axes show the average log2 transcription activation or repression detected with microarray (up or downregulated in kinetin or benzyl adenine treatments leaves compared to water-treated control). Y-axes show the average log2 transcription activation or repression detected with real-time RT-PCR (up or downregulated in kinetin or benzyladenine treatments leaves compared to water-treated control).
Figure 8. Number of up and downregulated genes after benzyladenine or kinetin treatments in Arabidopsis leaves. The figure shows the results of the microarray experiments. Genes activated or
repressed signify a at least water-treated control was indicated.
= upregulated genes, = downregulated genes, =genes regulated by the treatments to opposite directions.
= downregulated genes,
Life 2021, 11, 1404 10 of 22
After data processing, the results showed that at a significance level of adj.P.Val <
0.05, only the BA treatment caused transcriptomic alterations compared to water-treated control. However, at a slightly lower significance level (adj.P.Val < 0.07), the kinetin treatment also showed many gene expression alterations. To confirm the reliability of the expression data at adj.P.Val < 0.07, we performed qPCR measurements with 24 representative genes. We choose three representative genes from the eight group of genes (BA repressed/kinetin activated, BA activated/kinetin repressed, both BA and kinetin activated, both BA and kinetin repressed, only BA activated, only BA repressed, only kinetin activated, only kinetin repressed). The results of the qPCR tests practically corresponded to the microarray data. As it can be seen from Supplementary Table S2 and Figure 7, the qPCR results showed the same tendency and similar values as the microarray experiments (Pearson correlation coefficient value of R is: 0.9523). Since the gene expression data were reliable at adj.P.Val < 0.07, the results were further analysed at this significance level. BA treatments upregulated 1011 genes and downregulated 1011 genes, which were not changed after kinetin treatment (Figure 8).
Figure 7. Comparison of expression changes of selected Arabidopsis genes detected with microarray and real-time RT-PCR after kinetin (KIN) or benzyladenine (BA) treatments. X-axes show the average log2 transcription activation or repression detected with microarray (up or downregulated in kinetin or benzyl adenine treatments leaves compared to water-treated control). Y-axes show the average log2 transcription activation or repression detected with real-time RT-PCR (up or downregulated in kinetin or benzyladenine treatments leaves compared to water-treated control).
Figure 8. Number of up and downregulated genes after benzyladenine or kinetin treatments in Arabidopsis leaves. The figure shows the results of the microarray experiments. Genes activated or
repressed signify a at least water-treated control was indicated.
= upregulated genes, = downregulated genes, =genes regulated by the treatments to opposite directions.
= genes regulated by the treatments to opposite directions.
In addition, not only the number of affected genes but the magnitude of the changes was much larger after BA than kinetin treatments (Supplementary Table S1). While the highest activation changes were about 100×induction among the BA-specific genes and the average induction was about 3.9×, the highest activation after kinetin treatment was only 7.3×and the average induction was about 2.4×. However, in spite of the much stronger effect of BA, we found 133 up and 132 downregulated genes whose activity was specifically modified by kinetin treatment and was not changed by BA (Figure8). It is noteworthy that BA and kinetin treatment changed gene expressions into the same direction only in relatively few cases (73 upregulated and 70 downregulated genes); however, most interestingly, there were 28 genes where BA and kinetin treatments caused changes of gene expressions into the opposite directions (Figure8, Table1). The whole list of differentially regulated genes can be found in Supplementary Table S1.
Table 1.Arabidopsisgenes regulated by kinetin (Kin) or benzyladenine (BA) in opposite directions.
Array IDa Arabidopsis TAIR Codeb
Fold-Changec
Kin BA Similarity, Function
A_84_P13657 AT3G29590 2.0 −1.8 malonyl-CoA:anthocyanidin
5-O-glucoside-6’-O-malonyltransferased
A_84_P18522 AT4G09820 2.0 −1.0 transcription factor TT8
A_84_P808177 AT5G59320 1.7 −4.3 non-specific lipid-transfer protein 3
A_84_P12100 AT5G25980 1.5 −1.0 myrosinase 2 (thioglucoside glucohydrolase)
A_84_P842527 AT5G42800 1.5 −2.5 DFR (dihydrokaempferol 4-reductase)
A_84_P20780 AT1G03495 1.4 −1.8 HXXXD-type acyl-transferase family protein
A_84_P13548 AT1G07430 1.3 −1.2 protein phosphatase 2C 3
A_84_P253555 AT4G14090 1.2 −2.2 anthocyanin 5-O-glucosyltransferase
A_84_P813812 AT3G08770 1.2 −1.8 lipid-transfer protein 6
A_84_P12885 AT4G22880 1.1 −1.7 leucoanthocyanidin dioxygenase
A_84_P12954 AT4G39210 1.1 −1.0 glucose-1-phosphate adenylyltransferase large
subunit 3
A_84_P804836 AT1G68530 1.0 −1.3 3-ketoacyl-CoA synthase 6
A_84_P750651 AT1G59930 −1.0 1.3 maternally expressed imprinted protein
A_84_P22866 AT1G20070 −1.0 1.5 uncharacterized protein
A_84_P860885 AT2G05540 −1.1 1.1 glycine-rich protein
A_84_P14446 AT2G19190 −1.1 3.6 FLG22-induced receptor-like kinase 1
A_84_P18423 AT3G47480 −1.2 1.8 putative calcium-binding protein CML47
A_84_P814710 AT1G14870 −1.3 1.9 cadmium resistance protein 2
A_84_P51580 AT1G72060 −1.4 1.0 serine-type endopeptidase inhibitor mRNA
A_84_P544532 AT1G58225 −1.5 1.4 uncharacterized protein
A_84_P14903 AT5G11920 −1.6 1.3 beta-fructofuranosidase
A_84_P10728 AT2G29110 −1.7 1.4 glutamate receptor 2.8
A_84_P511702 AT1G53625 −1.7 1.5 uncharacterized protein
A_84_P17225 AT2G47190 −2.0 1.2 R2R3 MYB DNA binding domain transcription factor
A_84_P827683 AT1G65510 −2.2 1.0 uncharacterized protein
A_84_P586318 AT1G65845 −2.2 1.2 uncharacterized protein
A_84_P737368 AT1G36622 −2.3 2.1 uncharacterized protein
aAgilent Arabidopsis (V4) Gene Expression Microarray, 4×44K identifiers. bArabidopsis TAIR gene identifiers. cgene expression in log2transformed form compared to water-infiltrated control (average of three repeats), red and green backgrounds show up- and down-regulated genes, respectively.dgenes involve in anthocyanin synthesis were highlighted by grey background.
Among the genes specifically activated by BA, the most upregulated (about 100 times) was a bifunctional inhibitor/lipid-transfer protein/seed storage 2S albumin superfamily protein gene, while the most downregulated (more than 45 times) was a jasmonate-zim- domain protein gene. Furthermore, in addition to the other three bifunctional inhibitor/
lipid-transfer protein/seed storage 2S albumin superfamilies, the most strongly upregu- lated genes by BA were a pathogenesis-related protein 1 (PR1) and defensin-like protein, LRR-receptor-like protein kinase, beta 1,3-glucanase, and a putative chitinase genes. It is also noteworthy that a cytokinin dehydrogenase 3 and three two-component response regulator ARR genes (negative regulators of cytokinin signals) were strongly upregulated by BA (Supplementary Table S1). Among the most downregulated genes by BA were three cytochrome P450 (family 94), lipoxygenase 3 and 4, two cold-regulated proteins, a pathogenesis-related thaumatin family protein gene, and two bifunctional inhibitor/lipid- transfer protein/seed storage 2S albumin superfamily protein genes.
The most upregulated genes by both BA and kinetin were a gibberellin 20 oxidase 1 mRNA, three SAUR-like auxin-responsive protein mRNA, a gibberellin-regulated protein mRNA, three expansin (A8, A10, and an A11), a putative pectate lyase, as well as a dehydration-responsive element-binding protein 1A genes. The most downregulated genes by both BA and kinetin were two ethylene-responsive transcription factors, a heat stress transcription factor, an abscisic acid receptor, three chaperone DNaJ-domain containing proteins, a calcium-binding protein, and calmodulin-like protein genes.
The most induced genes by kinetin and not BA treatments were Li-tolerant lipase 1, two GDSL esterase/lipase, CBL-interacting protein kinase 5, a glucose-methanol-choline
Life2021,11, 1404 12 of 21
(GMC) oxidoreductase-like protein, a PATATIN-like 9 (phospholipase), two putative cin- namyl alcohol dehydrogenase 9, and dehydration-responsive element-binding protein 3 genes. The most suppressed genes by only kinetin treatments were wall-associated receptor kinase-like 10, proline dehydrogenase 2, heat shock protein 70, as well as class V 15.4, defence-like protein, and abscisic acid receptor PYL6 genes (Supplementary Table S1).
To find common and specific gene responses and plant processes induced by kinetin or BA treatments, the gene expression data were also compared by GO enrichment [36]
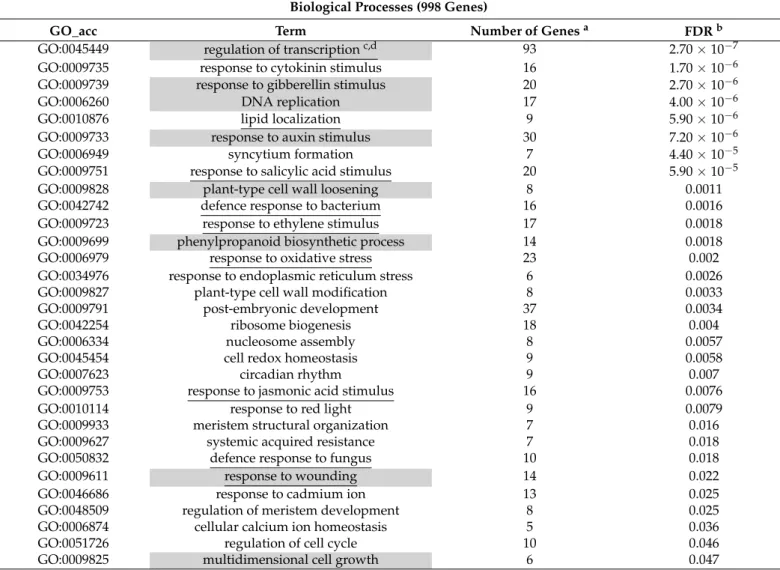
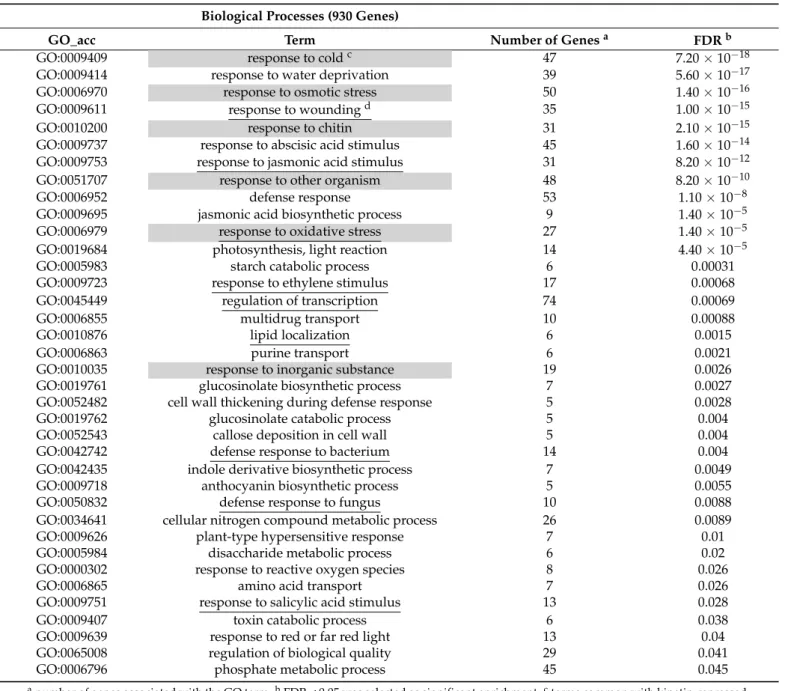
and by MapMan analysis [37]. The difference of kinetin and BA-specific responses were supported by these comparisons and besides showed some common features of these treatments as well. The results pointed out that both treatments induced remarkable transcriptional reprogramming of the plant cells, but the BA had a stronger effect on transcription. The genes connected to the regulation of transcription were one of the most significantly enriched terms among BA-activated genes and among the BA-repressed genes, this term was also significantly enriched (Tables2and3).
Table 2.Enrichment results of genes activated by benzyladenine.
Biological Processes (998 Genes)
GO_acc Term Number of Genesa FDRb
GO:0045449 regulation of transcriptionc,d 93 2.70×10⁻⁷
GO:0009735 response to cytokinin stimulus 16 1.70×10⁻⁶
GO:0009739 response to gibberellin stimulus 20 2.70×10⁻⁶
GO:0006260 DNA replication 17 4.00×10⁻⁶
GO:0010876 lipid localization 9 5.90×10⁻⁶
GO:0009733 response to auxin stimulus 30 7.20×10⁻⁶
GO:0006949 syncytium formation 7 4.40×10⁻⁵
GO:0009751 response to salicylic acid stimulus 20 5.90×10⁻⁵
GO:0009828 plant-type cell wall loosening 8 0.0011
GO:0042742 defence response to bacterium 16 0.0016
GO:0009723 response to ethylene stimulus 17 0.0018
GO:0009699 phenylpropanoid biosynthetic process 14 0.0018
GO:0006979 response to oxidative stress 23 0.002
GO:0034976 response to endoplasmic reticulum stress 6 0.0026
GO:0009827 plant-type cell wall modification 8 0.0033
GO:0009791 post-embryonic development 37 0.0034
GO:0042254 ribosome biogenesis 18 0.004
GO:0006334 nucleosome assembly 8 0.0057
GO:0045454 cell redox homeostasis 9 0.0058
GO:0007623 circadian rhythm 9 0.007
GO:0009753 response to jasmonic acid stimulus 16 0.0076
GO:0010114 response to red light 9 0.0079
GO:0009933 meristem structural organization 7 0.016
GO:0009627 systemic acquired resistance 7 0.018
GO:0050832 defence response to fungus 10 0.018
GO:0009611 response to wounding 14 0.022
GO:0046686 response to cadmium ion 13 0.025
GO:0048509 regulation of meristem development 8 0.025
GO:0006874 cellular calcium ion homeostasis 5 0.036
GO:0051726 regulation of cell cycle 10 0.046
GO:0009825 multidimensional cell growth 6 0.047
anumber of genes associated with the GO term.bFDR < 0.05 was selected as significant enrichment.cterms common with kinetin-activated terms were highlighted by gray background.dterms common with BA-repressed terms were underlined.
Table 3.Enrichment results of genes repressed by benzyladenine.
Biological Processes (930 Genes)
GO_acc Term Number of Genesa FDRb
GO:0009409 response to coldc 47 7.20×10⁻¹⁸
GO:0009414 response to water deprivation 39 5.60×10⁻¹⁷
GO:0006970 response to osmotic stress 50 1.40×10⁻¹⁶
GO:0009611 response to woundingd 35 1.00×10⁻¹⁵
GO:0010200 response to chitin 31 2.10×10⁻¹⁵
GO:0009737 response to abscisic acid stimulus 45 1.60×10⁻¹⁴
GO:0009753 response to jasmonic acid stimulus 31 8.20×10⁻¹²
GO:0051707 response to other organism 48 8.20×10⁻¹⁰
GO:0006952 defense response 53 1.10×10⁻⁸
GO:0009695 jasmonic acid biosynthetic process 9 1.40×10⁻⁵
GO:0006979 response to oxidative stress 27 1.40×10⁻⁵
GO:0019684 photosynthesis, light reaction 14 4.40×10⁻⁵
GO:0005983 starch catabolic process 6 0.00031
GO:0009723 response to ethylene stimulus 17 0.00068
GO:0045449 regulation of transcription 74 0.00069
GO:0006855 multidrug transport 10 0.00088
GO:0010876 lipid localization 6 0.0015
GO:0006863 purine transport 6 0.0021
GO:0010035 response to inorganic substance 19 0.0026
GO:0019761 glucosinolate biosynthetic process 7 0.0027
GO:0052482 cell wall thickening during defense response 5 0.0028
GO:0019762 glucosinolate catabolic process 5 0.004
GO:0052543 callose deposition in cell wall 5 0.004
GO:0042742 defense response to bacterium 14 0.004
GO:0042435 indole derivative biosynthetic process 7 0.0049
GO:0009718 anthocyanin biosynthetic process 5 0.0055
GO:0050832 defense response to fungus 10 0.0088
GO:0034641 cellular nitrogen compound metabolic process 26 0.0089
GO:0009626 plant-type hypersensitive response 7 0.01
GO:0005984 disaccharide metabolic process 6 0.02
GO:0000302 response to reactive oxygen species 8 0.026
GO:0006865 amino acid transport 7 0.026
GO:0009751 response to salicylic acid stimulus 13 0.028
GO:0009407 toxin catabolic process 6 0.038
GO:0009639 response to red or far red light 13 0.04
GO:0065008 regulation of biological quality 29 0.041
GO:0006796 phosphate metabolic process 45 0.045
anumber of genes associated with the GO term.bFDR < 0.05 was selected as significant enrichment.cterms common with kinetin-repressed terms were highlighted by gray background.dterms common with BA-activated terms were underlined.
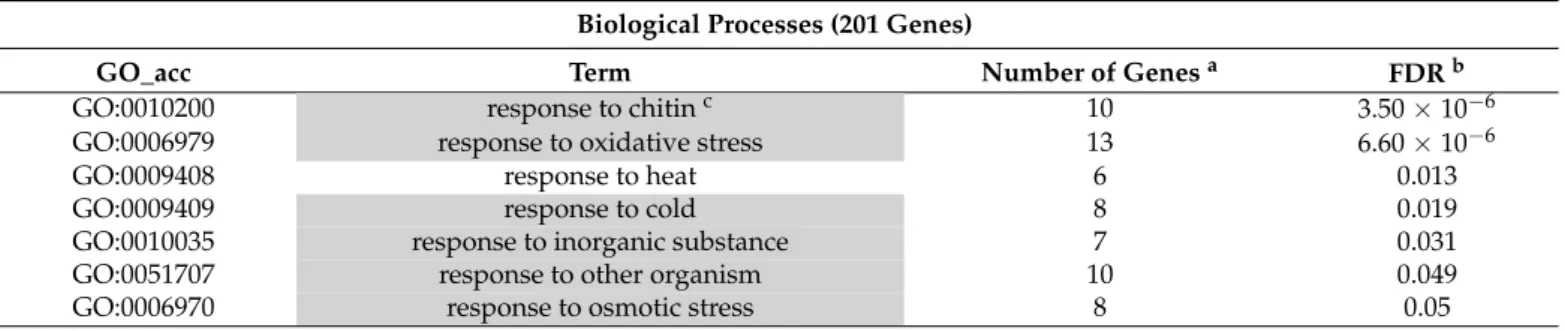
The kinetin treatments also induced significant enrichment among upregulated genes related to gene regulation but not among downregulated ones (Tables4and5). According to enrichment analysis, high numbers of up or downregulated transcription factors were showed by MapMan results (data not shown). Other typical common features of kinetin and BA on gene expression were that both treatments influenced the different hormone- related responses. Interestingly, only BA-activated genes had a significant impact on cytokinin-induced processes (Table2), but both treatments had a significant effect on auxin and gibberellin-related stimulus (Tables2and4). In addition, BA influenced some well-known defence-related hormone response such as salicylic acid, jasmonic acid, and ethylene responses in both activated and repressed genes (Tables2and3). It is remarkable that BA repressed several consecutive steps of JA synthesis, but in the case of kinetin treatments, this was not discernible (Supplementary Figure S1).