TRANSCRIPTIONAL AND GENOME-WIDE EPIGENETIC CHANGES UPON
ENVIRONMENTAL STRESS
PhD thesis
Borbála Vető
Molecular Medicine Doctoral School Semmelweis University
Supervisor: Tamás Arányi, MD, Ph.D
Official reviewers: Zsófia Nemoda, MD, Ph.D Máté Varga, Ph.D
Head of the Final Examination Committee: János M. Réthelyi, MD, Ph.D
Members of the Final Examination Committee: Krisztina Takács, Ph.D Attila Patócs, MD, Ph.D Budapest
2018
2
TABLE OF CONTENTS
1. LIST OF ABBREVIATIONS ... 5
2. INTRODUCTION ... 10
2.1. TRANSCRIPTIONAL REGULATION OF GENE EXPRESSION ... 10
2.1.1. Introduction to transcriptional regulation ... 10
2.1.2. Homeobox-containing transcription factors ... 12
2.1.3. Hepatocyte nuclear factor 4α... 13
2.2. GENOME-WIDE EPIGENETIC CHANGES ... 16
2.2.1. Epigenetics, a definition ... 16
2.2.2. Histone Modifications ... 17
2.2.3. DNA methylation ... 18
2.2.4. DNA hydroxymethylation ... 20
2.2.5. The function and action of TET enzymes ... 20
2.2.6. Cancer and epigenetics ... 21
2.2.7. Investigation of DNA methylation ... 22
2.2.8. LC-MS/MS (Liquid Chromatography coupled with Mass Spectrometry) ... 22
2.3. EPIGENETIC IMPLICATIONS OF METABOLISM ... 23
2.3.1. Epigenetics in intermediary metabolism ... 23
2.3.2. Introduction to nutritional challenges ... 24
2.3.3. Previous studies of nutritional stress ... 25
2.3.3.1. Studies on chronic nutritional stress ... 25
2.3.3.2. Studies on acute nutritional stress ... 26
2.3.4. Glucose homeostasis under physiological and stress conditions ... 27
2.3.4.1. Glucose metabolism under physiological conditions ... 27
2.3.4.2. Glucose metabolism in fasting ... 28
2.3.5. Transcription factors regulating glucose homeostasis in fasting ... 29
2.3.5.1. HNF4α in fasting ... 29
2.3.5.2. Interaction between HNF4α and PGC-1α ... 31
2.3.6. Cholesterol homeostasis ... 32
2.3.6.1. Cholesterol 7α-hydroxylase (CYP7A1) ... 32
2.3.7. Temporal organization of transcriptional regulation ... 33
2.3.8. Refeeding: hormonal and transcriptional responses ... 34
3. OBJECTIVES ... 35
4. METHODS ... 36
4.1. CLONING OF HOMEOBOX GENES ... 36
4.2. IMMUNOFLUORESCENCE ... 36
4.3. CELL CULTURE ... 36
4.4. HNF4Α MUTATIONS ... 37
4.5. TRANSFECTION AND LUCIFERASE EXPERIMENTS... 37
4.6. CHIP(CHROMATIN IMMUNOPRECIPITATION) ASSAY ... 37
4.7. QUANTITATIVE PCR ... 38
4.8. CELL CULTURE ... 39
4.9. DRUG TREATMENTS ... 39
4.10. STATISTICAL ANALYSES ... 40
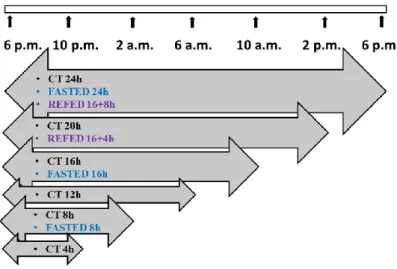
4.11. MOUSE NUTRITIONAL STRESS TIMELINE ... 40
3
4.12. MOUSE EXPERIMENTS ... 41
4.13. THE REDUCED REPRESENTATION BISULFITE SEQUENCING (RRBS) METHOD ... 41
4.14. RT-PCR ... 43
4.15. CONFOCAL MICROSCOPY ... 44
4.16. FIBROBLAST RNA-SEQ AND DATA ANALYSIS... 44
4.17. IN VITRO PHOSPHORYLATION ASSAY ... 44
4.18. PHOSPHOMAPPING ... 44
4.19. CHIP-SEQ DATA ANALYSIS ... 45
4.20. WESTERN BLOT ... 45
4.21. RRBS DATA ANALYSIS ... 46
4.22. LC-MS/MS ... 46
4.23. CALIBRATION ... 47
5. RESULTS ... 48
5.1. TRANSCRIPTIONAL REGULATION BY HOMEOBOX-CONTAINING TFS ... 48
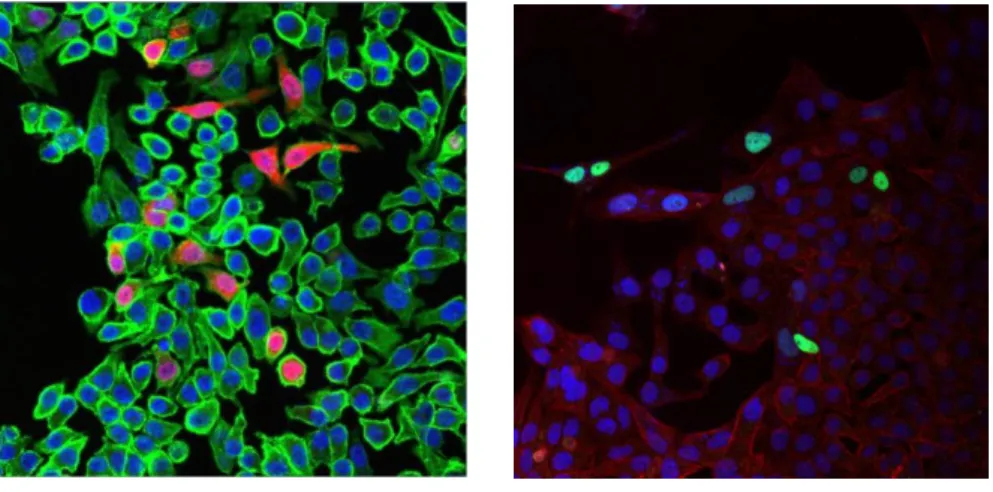
5.1.1. Subcellular localisation of the group of proteins from the human homeobox genes Argfx, Dprx, Leutx and Tprx ... 48
5.2. TRANSCRIPTIONAL REGULATION BY HNF4Α... 51
5.2.1. Transfection efficiency and nuclear localisation of the HNF4α protein and its mutant form 51 5.2.2. HNF4α phosphorylation by ERK1 in vitro ... 52
5.2.3. Specific phosphorylation sites of HNF4α phosphorylated by ERK1 ... 52
5.2.4. Phosphorylation site(s) with inhibitory effect on target gene transcription ... 54
5.2.5. Overlap between HNF4α and the active enhancer histone mark H3K27ac at genomic levels 55 5.2.6. Effect of extracellular activation of the ERK pathway on the binding of HNF4α to specific genomic regions ... 57
5.3. EFFECTS OF SHORT-TERM NUTRITIONAL STRESS ... 59
5.3.1. Weight and blood glucose comparison of groups ... 60
5.3.1.1. Weight comparison among groups ... 60
5.3.1.2. Blood glucose comparison among groups... 61
5.3.2. Protein level changes... 63
5.3.2.1. HNF4α protein levels ... 63
5.3.2.2. CEBPα protein levels ... 64
5.3.2.3. PCK1 protein levels ... 64
5.3.3. Analysis of sequencing data ... 65
5.3.3.1. Sequencing statistics: read number and coverage ... 66
5.3.3.2. Histogram of % CpG methylation and CpG coverage ... 66
5.3.4. Analysis of methylation % distributions ... 67
5.3.5. Analysis of differential methylation with the stringent analysis ... 68
5.3.5.1. Number of differentially methylated sites (DMSs) ... 69
5.3.5.2. Methylation differences and q values of CpGs ... 70
5.3.5.3. CpG distribution around CpG islands ... 70
5.3.5.4. CpG distributions around genes ... 71
5.3.5.5. CpG distributions and proximal and distal promoters ... 72
5.3.5.6. CpG distributions of annotated DMSs ... 74
5.3.6. Analysis of differential methylation with the more relaxed analysis ... 75
5.3.6.1. ‘Reversed’ CpGs ... 75
5.3.6.2. Analysis of differentially methylated regions (DMR) ... 77
5.3.6.3. Expression analysis of metabolic genes... 78
5.3.7. Genome-wide methylation measured by LC-MS/MS ... 79
5.4. GENOME-WIDE EPIGENETIC CHANGES ... 80
4
5.4.1. Variability of our newly developed LC/MS-MS method ... 80
5.4.2. Genomic 5mC and 5hmC levels of different tissues, primary cells and cell lines ... 81
5.4.3. Effect of DNA methylation inhibition on genomic 5mC and 5hmC levels in cell lines 83 5.4.4. 5hmC changes specific to some cell lines ... 83
5.4.5. Ascorbate-mediated TET function modulation in cell lines ... 85
6. DISCUSSION ... 87
6.1. TRANSCRIPTIONAL REGULATION BY HOMEOBOX TFS ... 87
6.2. TRANSCRIPTIONAL REGULATION BY HNF4Α... 88
6.3. EFFECTS OF SHORT-TERM NUTRITIONAL STRESS ... 91
6.4. GENOME-WIDE EPIGENETIC CHANGES ... 96
7. CONCLUSIONS ... 99
8. SUMMARY ... 101
9. ÖSSZEFOGLALÁS ... 102
10. BIBLIOGRAPHY ... 103
11. BIBLIOGRAPHY OF THE CANDIDATE’S PUBLICATIONS ... 123
11.1. PUBLICATIONS RELATED TO THE THESIS ... 123
11.2. PUBLICATIONS NOT DIRECTLY RELATED TO THE THESIS ... 123
12. ACKNOWLEDGEMENTS ... 124
5
1. LIST OF ABBREVIATIONS
2-HG: 2-hydroxyglutarate 5azadC: 5-aza-2’-deoxycytidine 5caC: 5-carboxylcytosine 5fC: 5-formylcytosine
5hmC: 5-hydroxymethyl-cytosine 5mC: 5-methyl-cytosine
AACS: Acetoacetyl-CoA synthetase
ABCC6: ATP-binding cassette sub-family C member 6 ACOT: Acyl-CoA thioesterase
ACOX1: Acyl-CoA oxidase 1 Akt: PKB (Protein kinase B) AML: Acute myeloid leukemia AMP: Adenosine monophosphate AMPK: AMP activated kinase APOA1: Apolipoprotein A1 ARGFX: Arginine-fifty homeobox
ARNTL: Aryl hydrocarbon receptor nuclear translocator-like protein 1 ATCC:American type culture collection
ATP: Adenosine triphosphate BARE: Bile acid response element
BDH1: 3-Hydroxybutyrate Dehydrogenase 1 BER: Base excision repair
bHLH: Basic helix-loop-helix BLVRA, B: Biliverdin A, B bp: base pair
bZip: Basic leucine zipper
cAMP: Cyclic adenosine monophosphate CBP: CREB-binding protein
CEBPα, β: CCAAT/Enhancer binding protein alpha, beta CGI: CpG islands
6 ChIP: Chromatin immunoprecipitation
ChREBP: carbohydrate response element binding protein CpG:Cytosine-phosphate-guanine
CPT1: Carnitine O-palmitoyltransferase 1
CREB: cAMP responsive element binding proteins CRX: Cone-rod homeobox
CT: control
CTCF: CCCTC binding factor
CYP7A1: Cholesterol 7α-hydroxylase DBD: DNA-binding domain
DMEM: Dulbecco's Modified Eagle's Medium DMR: Differentially methylated region
DMS: Differentially methylated site DMSO: Dimethyl sulfoxide
DNA: Deoxyribonucleic acid DNMT: DNA methyl-transferase
DPRX: Divergent paired-related homeobox EDTA: Ethylenediaminetetraacetic acid EGR-1: Early growth response gene-1
ERK1/2: Extracellular signal-regulated protein kinases 1 and 2 FAS: Fatty acid synthase
FBP1: Fructose-1,6-bisphosphatase 1 FBPase: Fructose 1-6-bisphosphotase FBS:Fetal bovine serum
FDA:Food and Drug Administration FOXO1: Forkhead box protein O1
FPKM: Fragments per kilobase per million reads FXR: Farnesoid X receptor
G6Pase: Glucose-6-phosphatase G6PC3: Glucose-6-phosphatase 3 GK: Glucokinase
GLUI: Glutamine synthetase
7 GLUT2: Glucose transporter 2
GR: Glucocorticoid receptor GS: Glycogen synthase
GST:Glutathione S-transferases GTF: General transcription factor HAT: Histone acetyl-transferase HBE: HNF4α-binding element HDAC: Histone deacetylase HDM:Histone Demethylase
hESCs: Human embryonic stem cells HFD: High fat diet
hMeDIP: Hydroxymethylated DNA immunoprecipitation HMGCS2: 3-Hydroxy-3-Methylglutaryl-CoA Synthase 2 hMSC: Human mesenchymal stem cell
HMT:Histone Methyltransferase
HNF4α: Hepatocyte nuclear factor 4 alpha HOX: Homeobox
HPD: 4-hydroxyphenylpyruvate dioxygenase HTH: Helix-turn-helix
IDH: Isocitrate dehydrogenase IGV:Integrative genomics viewer INSIG2: Insulin-induced gene 2 protein iPSC: Induced pluripotent stem cells Jmj: Jumonji domain
kb: kilobase
KDM: Histone lysine demethylase
KEGG: Kyoto encyclopedia of genes and genomes LBD: ligand binding domain
LC-MS/MS: Liquid chromatography coupled with mass spectrometry LEUTX: Leucine-twenty homeobox
LPK: Liver-type pyruvate kinase LXR: Liver X receptor
8 MeDIP: Methylated DNA immunoprecipitation NAD: Nicotinamide adenine dinucleotide
NADP: Nicotinamide adenine dinucleotide phosphate NPC: Neuronal progenitor cell
NR: Nuclear receptor OTX: Orthodenticle
PACAP: Pituitary adenylate cyclase-activating polypeptide PAX: Paired box
PBS: Phosphate buffered saline PC: Pyruvate carboxylase PCR: Polymerase chain reaction
PEPCK/PCK: Phosphoenolpyruvate carboxykinase PGC: Primordial germ cell
PGC-1α: Peroxisome proliferator-activated receptor gamma co-activator 1 alpha PIC: Preinitiation complex
PITX: Paired Like Homeodomain PKA: Protein kinase A
PKC: protein kinase C
PKLR: Pyruvate kinase, liver and red blood cell PMSF: Phenylmethylsulphonyl fluoride
PPARα: Peroxisome proliferator activated receptor alpha PRD: Paired
PTSD: Post-traumatic stress disorder qPCR: quantitative PCR
RNA: Ribonucleic acid
RPKM: Reads per kilobase per million mapped reads RPMI: Roswell park memorial institute medium RRBS: Reduced representation bisulfite sequencing RXR: Retinoic acid receptor
SAH: S-adenosyl-homocysteine SAM: S-adenosyl-methionine SD: Standard deviation
9 SDS:Sodium dodecyl sulfate
SDS-PAGE: Sodium dodecyl sulfate polyacrylamide gel electrophoresis SMILE: Small heterodimer partner-interacting leucine zipper protein SNP: Single nucleotide polymorphism
SNV: Single nucleotide variant
SREBP-1c: Sterol regulatory element binding protein 1c TDG: Thymine DNA glycosylase
TET: Ten-eleven translocation TF: Transcription factor
TFBS: Transcription factor binding site THF: Tetrahydrofolate
TPRX:Tetrapeptide repeat homeobox TSH: Thyroid stimulating hormone TSS: Transcription start site
UHRF1: Ubiquitin-like, containing PHD and RING finger domains 1 WT: Wild type
10
2. INTRODUCTION
2.1. Transcriptional regulation of gene expression
2.1.1. Introduction to transcriptional regulation
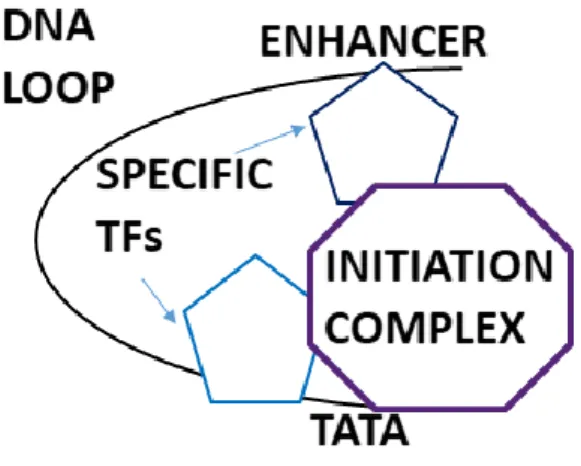
Eukaryotic gene expression is regulated by transcription. This step is controlled by proteins binding specific gene-regulatory sequences that modify the activity of the RNA polymerase. The tight regulation of gene expression is achieved by the intricate and complex network of these regulatory proteins. General or basal transcription factors (GTFs) bind to specific DNA sequences in order to control transcription rate. They form a large transcription preinitiation complex (PIC) and help to position RNA polymerase II to the promoter. In contrast, specific TFs control the expression of specific genes. They are responsible for the tissue-specific expression of their target genes. Mammalian gene expression is controlled by specific sequences: promoters and enhancers located near or far away from the transcription start site, respectively. The latter includes specific, conserved consensus sequences upstream from the TATA box, such as CCAAT sequences, which bind the CCAAT/Enhancer binding protein (C/EBP). C/EBPs can further bind other factors to open the chromatin structure and recruit GTFs causing transcription activation. A multitude of TFs can bind to cis-acting promoters and enhancers and they can interact with the RNA polymerase and the proteins of the transcriptional machinery by DNA looping (Figure 1). By the combination of the seemingly redundant activity of individual regulatory sequencing, a higher and synergistically acting unit is set up. Proteins regulating gene expressions may be transcriptional activators, which stimulate transcription via interacting with GTFs. In contrast, transcriptional repressors have inhibitory effect since they inhibit the interaction between RNA polymerase and GTFs or they block the binding of transcriptional activators. Moreover, the activators and repressors also cause changes in chromatin structure, making it accessible or inaccessible. Together, they are responsible for tissue- specific gene expression in complex multicellular organisms (summarized in [1]).
11
Figure 1. DNA looping. Transcription factors bound at enhancers interact with the general transcription factors at the promoter via DNA loops.
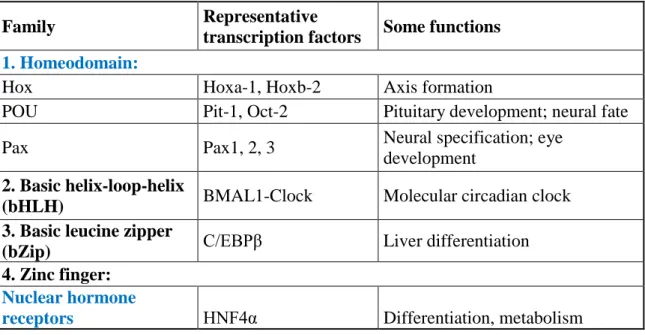
The basic function of TFs is binding DNA. It is carried out by the DNA-binding domain (DBD). In addition, TFs can be categorized based on their DBD (Table 1) [2]. Firstly, the family of homeobox proteins contain helix-turn-helix (HTH) motif. Vertebrate homeobox genes are highly conserved in structure and function, moreover, they play fundamental roles in animal development and differentiation. Homeobox (HOX) genes are essential in early axis formation, whereas Paired box (Pax) genes play important roles in neural growth, e.g. eye development [3]. Secondly, the typically dimeric Basic helix- loop-helix (bHLH) TFs contain two α-helices connected by a loop. Aryl hydrocarbon receptor nuclear translocator-like protein 1 (ARNTL/BMAL)-Circadian Locomotor Output Cycles Kaput (CLOCK) are prominent members playing a pivotal role in regulating molecular circadian clock [3]. Thirdly, basic leucine zipper (bZip) TFs possess a leucine zipper that dimerizes two DNA binding regions. The bZip family member CEBPβ takes part in the regulation of target hepatic gene expression in interaction with Hepatocyte nuclear factor 4α (HNF4α) [4]. Lastly, TFs families that contain zinc finger domain are nuclear receptors (NRs), which will be introduced in Section 1.2. In summary, the role of TFs is multi-faceted ranging from cell cycle control to pathogenesis, including the above mentioned functions.
12
Table 1. Families and subfamilies of transcription factors based on their DNA- binding domains. (modified from [2])
Family Representative
transcription factors Some functions 1. Homeodomain:
Hox Hoxa-1, Hoxb-2 Axis formation
POU Pit-1, Oct-2 Pituitary development; neural fate
Pax Pax1, 2, 3 Neural specification; eye
development 2. Basic helix-loop-helix
(bHLH) BMAL1-Clock Molecular circadian clock
3. Basic leucine zipper
(bZip) C/EBPβ Liver differentiation
4. Zinc finger:
Nuclear hormone
receptors HNF4α Differentiation, metabolism
First of all, some fundamentally important members of the homeobox-containing transcription factors will be discussed.
2.1.2. Homeobox-containing transcription factors
One major and evolutionary highly conserved family of transcription factors is encoded by various homeobox genes. Homeobox genes are found in almost all eukaryotes. They contain a distinctive homeodomain. These transcription factors are responsible for determining cell fates and the formation of many body structures during early embryonic development. Homeobox genes include approximately 100 gene families in which the members underwent extensive gene duplication and divergence during evolution. The most elaborated families further expanded via genome duplications in vertebrates (reviewed in [5]).
Hox genes play major roles in the formation of main body parts during early embryonic development. They are responsible for producing individual organs, as well. For example, limb development in mouse are regulated by HoxD and HoxA. Mutations in human Hox genes cause limb defects, for instance polydactyly [6].
13
The PRD class is the second largest of the homeobox gene classes, the name of which is originating from the Drosophila Paired (Prd) gene. It includes - for instance - Pax genes, Orthodenticle (Otx) and Paired Like Homeodomain (Pitx) genes, which are extremely important in the development of the mesoderm, the nervous system and the gut [5]. A
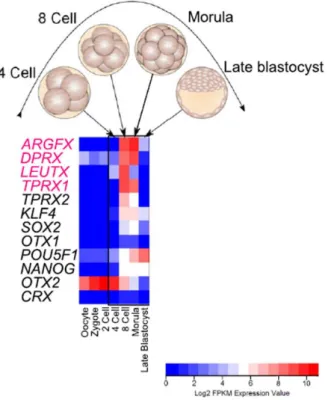
‘new’ group of PRD class homeodomains – Arginine-fifty homeobox (Argfx), Divergent paired-related homeobox (Dprx), Leutx (Leucine-twenty homeobox) and Tetrapeptide repeat homeobox (Tprx) – arose from tandem duplication from the Crx (Cone-rod homeobox) gene in a diversity of placental mammals. This parental gene is a member of the Otx gene family, and it is mainly expressed in photoreceptors of mammalian eyes. These daughter genes were formed by tandem duplications from the Crx gene, and they further diverged. Furthermore, some were transposed along (Dprx and Leutx) or to another chromosome (Argfx) throughout asymmetric evolution [7]. The human and mouse genomes have different numbers of homeobox genes due to both gene gain and gene loss events. Argfx, Dprx, Leutx and Tprx were lost in rodent but not in primate evolution [8]. In contrast to the retinal-expressed parental gene, the putative daughter genes are not expressed in photoreceptors, but in testes and human embryonic stem cells (hESCs). By far, the highest expression is found in human embryos at the 4- cell and 8-cell morula stages prior to cell fate restrictions. Morula cells are totipotent, thus they are equivalently capable of developing any cell type. However, it has never been proved that these proteins are actual transcription factors localized in the nucleus and they were never endowed with regulatory roles in totipotent embryonic cells. Therefore, determining their subcellular localisation and analysing their transcription profiles would shed light on their roles activating and repressing developmentally important genes leading to fine-tuning of cell fate decisions. In general, the link of genomic change to phenotypic evolution needs be established.
Secondly, the TF family of nuclear receptors (NRs) will be discussed.
2.1.3. Hepatocyte nuclear factor 4α
Members of the NR superfamily regulate transcription in response to binding their lipophilic ligands, which can be hormones (steroid, thyroid hormones), vitamin D, retinoic acid and also fatty acids and phospholipids. They are particularly important
14
because they turn the chemical signals into changes in tissue-specific gene expression programs. NRs comprise a ligand-binding and a DNA-binding domain (LBD and DBD, respectively). The ligands bind in the LBD of the receptors with great selectivity based on their special conformations. They can further recruit transcriptional coregulators;
repressors and activators. NRs also play an important role in responding to various environmental stimuli, thereby controlling development, homeostasis and metabolism, as well (reviewed in [9]). The major role of these receptors is to maintain the nuclear homeostasis of their ligands. For example, peroxisome proliferator activated receptors (PPARs) regulate fatty acid metabolism by binding fatty acids and Liver X receptor (LXR) controls cholesterol metabolism by binding cholesterol metabolites, respectively.
The ligands are synthesized and degraded when required for the adequate hormonal response. Retinoic acid receptor (RXR) regulates multiple metabolic pathways. It can form heterodimers with other NRs, for instance PPAR [10] regulating fatty acid metabolism. LXR, PPAR and also RXR are considered as the main players in whole-body lipid homeostasis and hepatic lipid metabolism. These TFs are highly cooperative, moreover LXR and PPARα demonstrate extensive crosstalk [11]. NRs are pharmacological targets, as well. For instance, PPARα is a major target for therapy in metabolic diseases, including insulin sensitivity, type 2 diabetes and cancer [12].
HNF4α is a member of the nuclear receptor superfamily. The TF is required for liver development and liver cell differentiation, and the HNF4α knockout mouse model is embryonic lethal [13]. HNF4α is expressed in the liver, pancreas, the kidney and the intestines [14] and it is the master regulator in hepatocytes [15]. HNF4α regulates genes involved in lipid and glucose metabolism [16] and other transcription factors [17, 18]. As a characteristic of several nuclear hormone receptors, they are able to react to environmental stresses, such as fasting or feeding and altered hormone levels. Point mutations of HNF4α can cause Maturity Onset Diabetes in the Young (MODY), a rare subtype of diabetes with autosomal-dominant inheritance [19].
HNF4α has long been considered as an orphan receptor, but its ligands are fatty acyl Co- enzyme A thioesters [20] according to crystallization studies [21] (Figure 2). Although HNF4α seems to be constitutively active [22] by its constitutive activator ligand, the transcription factor is not constitutively activating its target genes. Therefore, its post- translational modifications and interacting partners became an area of interest [23, 24].
15
Firstly, the interaction of HNF4α with different transcription factors (e.g. farnesoid X receptor FXR) [25], co-activators and co-repressors was discovered [25, 26]. In addition, mass spectrometry analyses of post-translational modifications revealed that HNF4α can be phosphorylated at several sites in the hepatocellular carcinoma HepG2 cell line [23].
The HNF4α protein was shown to be phosphorylated by different kinase cascades at specific residues. Serine 78 (which is S87 in human) is the most significant site targeted by protein kinase C (PKC) phosphorylation having an inhibitory effect [27]. Protein kinase A (PKA) [28] and p38 [29] were also reported to phosphorylate the protein.
(However, these results appeared to be controversial.) Furthermore, AMP activated kinase (AMPK) can phosphorylate the protein at serine 313 [30], which leads to decreased activity of the transcription factor, however, lesser than PKC [27].
Figure 2. Crystallized structure of HNF4α as a homodimer. (Mutations coloured with the help of Tamás Hegedűs). (modified from [31])
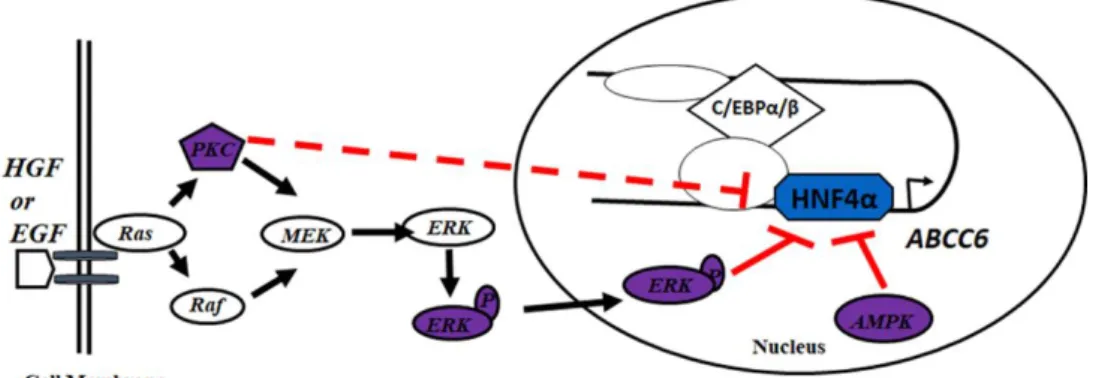
Our group has previously identified various cis-regulatory elements at the promoter and a primate-specific sequence at the first intron of one of its target genes, ABCC6 [4]. We have found that these cis-regulatory elements are occupied by HNF4α, CEBPα and β forming a regulatory network (Figure 3) [32], where HNF4α orchestrates tissue- and cell- type specific gene expression [4, 33]. Furthermore, we have previously observed that the activation of several kinase cascades (PKC, AMPK and ERK1/2) inhibits the expression of ABCC6 via HNF4α in human cell lines [33], where HNF4α was transfected in a
16
plasmid and gene expression was insensitive to ERK1/2. Therefore, we aim to discover whether HNF4α is a direct target of ERK1/2 phosphorylation and if yes, which phosphorylation site is responsible for the inhibitory effect.
Figure 3. Transcription regulation of the ABCC6 gene by various signalling pathways and a network of transcription factors including HNF4α. (modified from [32])
As we have seen above, TFs profoundly influence gene expression. However, the structure of DNA (e.g. DNA loops) and its surrounding genomic and chromatin environment in the nuclei of cells are also fundamental. Gene expression is regulated at two interconnected levels: transcriptional and epigenetic. It is now well known that cells can alter their gene expression in response to various environmental stimuli. The underlying processes are epigenetic.
2.2. Genome-wide epigenetic changes
2.2.1. Epigenetics, a definition
Epigenetics is the science of the hereditary information located in the nucleus but not encoded in the genome. Epigenetics involves various modifications of the chromatin structure in the nuclei of cells. Chromatin, a macromolecular complex includes DNA and nuclear proteins, which forms the nucleosome. It contains the four core histones (H3, H4,
17
H2A and H2B) twice in an octamer wrapped around by DNA. The N-terminal tails of the histones often undergo different modifications (e.g. acetylation and methylation).
Moreover, DNA itself can be methylated (Figure 4). These covalent, epigenetic modifications affect changes in both chromatin structure and gene transcription. These changes can even be carried on by cell divisions through generations (‘epigenetic inheritance’) [34].
Figure 4. Overview of common covalent epigenetic modifications. Lysine 27 of histone 3 can be acetylated and methylated, as well. H3K27ac is an activating epigenetic mark, whereas H3K27me3 is an inhibitory one. In addition, lysine 4 can also be methylated, which is an activating epigenetic mark. HMT: Histone Methyltransferase;
HDM: Histone Demethylase; HAT: Histone acetyl-transferase; HDAC: Histone deacetylase. (modified from [35])
DNA methylation has long been considered to be a stable epigenetic modification.
However, cells were shown to actively adapt to the changing environmental conditions.
It has recently been reported that DNA methylation can globally change upon various stress factors both in cell lines and in human hematopoietic stem cells [36, 37]. Therefore, these dynamic epigenetic modifications are the interface between the genome and the environment.
In the following, firstly histone modifications, then DNA methylation will be discussed.
2.2.2. Histone Modifications
18
Nucleosomes are built up from highly conserved histones having N-terminal tails, which can undergo post-translational modifications [38]: acetylation, methylation and phosphorylation. Histones play important roles in different nuclear processes, for instance replication, DNA repair and transcription [39, 40].
Acetylation targets the lysine residues of H3 and H4 histone tails performed by histone acetyl-transferases (HAT) and histone deacetylases (HDAC) [41, 42]. Some TF co- activator complexes can have HAT activity (e.g. p300 and CBP - CREB-binding protein), which recruit other transcription factors and RNA polymerase II [43]. Mutation in the transcriptional co-activator can cause the Rubinstein-Taybi syndrome [44], which is due to reduced histone acetylation and aberrant chromatin regulation. The disease is characterized by facial abnormalities and mental retardation. Histone acetylation characterizes transcriptionally active gene regulatory regions (euchromatin).
Histone methylation can target both arginines and lysines. In addition, arginines can acquire mono- or dimethylation, while lysines can acquire mono-, di- or tri-methylation [40, 45, 46]. A great number of enzymes are responsible for the establishment and removal of these epigenetic modifications. The executing enzymes are capable of selectively implementing one or two specific reactions (such as mono- and di-methylation of a specific lysine).
2.2.3. DNA methylation
DNA methylation is the covalent modification of cytosines by the addition of a methyl group. Methylation occurs at CpG dinucleotides in mammalian cells [47]. CpG dinucleotides are distributed in the genome to GC-poor regions [48], which tend to be methylated in all cell types. Short CpG-rich sequences (CpG islands – CGI) are mostly found in gene regulatory regions, while CpG-poor regions are a feature of the non-coding DNA [49]. Generally, CGIs exhibit tissue-specific methylation patterns [50].
DNA methylation influences gene expression. Methylation of a regulatory region implies gene silencing. TFs function based on the methylation status of their target sequence.
Some do not bind methylated sequences (e.g. CTCF [51]), whereas others bind if the DNA is methylated (e.g. Methyl-CpG-binding protein 2 MeCP2 [52]). MeCP2 mediates transcriptional repression together with the Sin3 histone deacetylase [53]. MeCP2
19
mutations cause Rett syndrome, a progressive neurodevelopmental disease with mental retardation and motor impairment [54]. DNA methylation plays an important role in cell differentiation, X chromosome inactivation and other nuclear processes. DNA methylation is a reversible modification, thus methylation patterns can be established de novo and modified genome-wide or at specific loci, reflecting environmental conditions.
DNA methylation is implemented by DNA methyl-transferase (DNMT) enzymes, which can establish or maintain the required methylation pattern. The maintenance DNA methyl-transferase DNMT1 preserves methylation patterns and preferentially binds hemi- methylated DNA. Ubiquitin-like, containing PHD and RING finger domains 1 (UHRF1) is a protein which recruits DNMT1 to the hemi-methylated DNA during replication.
Therefore, methylation marks are protected during cell division. In contrast, the de novo DNA methyl-transferases DNMT3A and DNMT3B create ‘new’ methylation patterns (Figure 5).
Figure 5. DNA methylation and demethylation performed by DNMT and TET enzymes. DNMT: DNA methyltransferase. TET: Ten eleven translocation.
DNA can be methylated genome-wide or locally in response to environmental stimuli, for example hormonal and metabolic stress. However, these changes are reversible.
Embryogenesis is strictly regulated at the level of epigenetic modifications. During mammalian development, vast DNA methylation changes – erasure and re-establishment - occur in the zygote after fertilization and then in primordial germ cells (PGCs) [55]. An
20
example of de novo methylation is ESC differentiation into the three germ layers, which is accompanied by an elevation of methylated promoter regions, which has a critical role in the repression of germ cell-specific genes [56]). For instance, lentiviral transductions and infections can cause genome-wide methylation changes [37, 57]. Furthermore, DNA methylation can also be modulated upon stress or neuronal activity in the adult mouse brain, which is a proof of neuronal DNA methylome plasticity [58]. Post-traumatic stress disorder (PTSD) can also be connected to methylation changes in the Pituitary adenylate cyclase-activating polypeptide (PACAP)-encoding gene detected in peripheral blood [59].Moreover, the behaviour of rat mothers (licking and grooming) can alter the DNA methylation patterns in the promoter of the glucocorticoid receptor (GR) in the hippocampus of the offspring affecting anxiety and stress response [60]. Epigenetic changes due to metabolic alterations and ‘transgenerational inheritance’ will be discussed in Sections 3.1-3.3.
2.2.4. DNA hydroxymethylation
5-hydroxymethyl-cytosine is an epigenetic modification of cytosines formed by Ten- eleven translocation (TET) (Figure 5), thereby taking part in demethylation. 5mC levels are unchanging in various tissues because of CpG methylation (3-7% of all genomic cytosines), whereas 5hmC levels are variable with the highest level measured in brain (approximately 1%) and 10-100 times less (0.01-1% of all cytosines) in other cell types.
It has been reported that 5hmC does not have an obvious inhibitory effect on transcription [61, 62].
2.2.5. The function and action of TET enzymes
TET enzymes convert 5mC into 5hmC both in vitro and in vivo [63] via oxidation. In addition, they can further oxidize 5hmC to 5-formylcytosine (5fC) and 5- carboxylcytosine (5caC) [64]. Passive DNA demethylation refers to the inability of the cells to maintain DNA methylation patterns during cell divisions. In contrast, active DNA demethylation is performed by a thymine-DNA-glycosylase (TDG)-base excision repair (BER)-dependent pathway mediated by TET. TETs have a catalytic core region,
21
moreover, TET1 and TET3 contain a CXXC zinc finger domain that can bind DNA [65].
Mouse embryonic stem cells (ESCs) have high 5hmC levels. Tet1 was shown to have a role in maintaining pluripotency in ESCs [66]. Knocking out Tet3 in ESCs lead to impaired neuronal differentiation [67] and Tet1/2/3 triple knockout ESCs are incapable of forming embryonic bodies [66].
Furthermore, TET1 mutation and associated low 5hmC levels were first demonstrated in acute myeloid leukemia (AML) [68]. TET2 mutations also resulted in impaired 5hmC production in haematological cancers [69]. Moreover, aberrant DNA methylation and TET-mediated loss of 5hmC can be seen as a hallmark of several human cancers. TETs are 2-oxoglutarate, oxygen- and iron- dependent demethylases, so α-ketoglutarate, a key player of the citric acid cycle can have epigenetic effect on genome activity and therefore influence health and disease. Studying some tumours have revealed mutations in the isocitrate dehydrogenase (IDH) genes disrupt the catalytic activity of TET proteins [70].
Moreover, IDH1/2 mutations were observed to be mutually exclusive with TET2 mutations in the case of AML patients [71]. Furthermore, ascorbate was also shown to take part in the oxidative demethylation of DNA via reducing Fe3+ to Fe2+. It is required for the full TET catalytic activity [72, 73].
2.2.6. Cancer and epigenetics
Traditionally, cancer was considered driven by accumulated genetic mutations. However, it has recently been found that epigenetic regulatory mechanisms have a fundamental role, as well [74]. Before and during tumour progression, the epigenome is highly changed, for instance via genome-wide hypomethylation and increased promoter methylation at CpG islands of tumour suppressor genes. Promoter hypermethylation of tumour suppressor genes, for instance BRCA1/2 cell cycle and DNA repair gene, are widespread in several cancer types. Some other genes undergo loss-of-function because of promoter hypermethylation (reviewed in [75]). Cytosine methylation in the germline results in T:G mismatches created by the deamination of 5mC to T, which are not repaired by the DNA repair system. It can lead to mutations, single nucleotide polymorphisms and variants (SNPs and SNVs) at CpG sites. The most well-known example is the tumour suppressor p53 gene, where 50% of point mutations occur at these sites [76].
22
DNA methylation can be affected via mutations in the methylation machinery. DNMT1 mutations were observed in colorectal cancer [77] and DNMT3A mutations were noted in AML [78]. In addition, they can be overexpressed in various cancer types, which can cause hypermethylation elsewhere in the genome [79]. Moreover, the DNA demethylating enzyme TET2 can be mutated. For further modifications, see Table 1 in [75]. Mutations in histone modifier enzymes (e.g. HDACs) are also known to contribute to tumorigenesis (reviewed in [75]). Several anti-cancer drugs have been developed;
HDAC inhibitors [80] or DNMT inhibitors, for instance Decitabine [81]. Therefore, these epigenetic changes, including defects in DNA methylation and histone modifications, can lead to genomic instability and gene expression changes, which might predispose to cancer. Since a cancer is characterized by several genetic and epigenetic aberrations, effective therapies aim at combining “standard” and epigenetic strategies.
2
2.2.7. Investigation of DNA methylation
DNA modifications can be detected by various methods (reviewed in[82]). Bisulfite conversion is the ‘gold standard’ for detecting 5mC nucleotides [83]. Nevertheless, this chemical conversion is unable to discriminate 5mC and 5hmC [84]. Sequencing of genomic DNA immunoprecipited with anti-5mC and anti-5hmC antibodies (MeDIP and hMeDIP) is used for this purpose. 5mC and 5hmC can also be distinguished at site- specific level by glucosylation of 5hmC followed by MspI digestion, where the glucosylated DNA is resistant to digestion [85]. However, these methods are not adequate for exact quantitative analysis [86].
2.2.8. LC-MS/MS (Liquid Chromatography coupled with Mass Spectrometry)
Global DNA methylation can be accurately quantified by the highly reliable and simple LC-MS/MS. This method is capable of simultaneously measuring global 5mC and 5hmC levels in genomic DNA [87, 88]. The advantage of this method is the ability to distinguish between 5mC and 5hmC. Moreover, global DNA methylation is measured sensitively and accurately and the method is highly quantitative and reproducible. The limit of detection
23
is very low (below 1 fmol) [88]. Genomic DNA is liberated into nucleobases by formic acid instead of digestion by a multienzyme cocktail. In addition, calibration is performed by using chemical standards (dCTP, 5mdCTP, 5hmdCTP) [89]. Using this method, we have previously shown that DNA methylation is highly dynamic [36].
2.3. Epigenetic implications of metabolism
2.3.1. Epigenetics in intermediary metabolism
The specific transcriptional networks are established and maintained in every cell by precise molecular programs under different nutritional conditions. These cell-specific programs are regulated by epigenetic mechanisms. These activities are further regulated by the actual nutritional state of the cell. The activity of chromatin modifications are influenced by key metabolites and cofactors originating from intermediary metabolism, for instance acetyl-CoA, NAD+, S-adenosyl-methionine (SAM) and α-ketoglutarate (α- KG) [90]. Here, only the link between metabolic sensors and DNA methylation will be discussed (Figure 6). Firstly, DNA methylation requires a methyl donor, which originates from the SAM- S-adenosylhomocysteine (SAH) and the folate cycle. The changing levels of SAM have a direct effect on H3K4 trimethylation and gene expression [91].
Furthermore, H3K4me3 levels are maintained at decreased SAM levels by negatively regulating KDM5B/JARID1B histone demethylase activity [91]. SAH, produced from SAM, is an inhibitor of DNA methyltransferases, thus the SAM/SAH ratio serves as a biosensor of actual metabolic status and nutrient availability.
Secondly, α-KG is generated from isocitrate in the mitochondrial citric-acid cycle by IDH2, which contributes to DNA demethylation (reviewed in [35]). α-KG is also formed in the cytoplasm via IDH1 and from amino acids, for example arginine and glutamate.
Mutations in the IDH enzymes lead to the production of the oncometabolite 2- hydroxyglutarate (2-HG), an inhibitor of α-KG [92], which will disrupt α-ketoglutarate dependent TeT enzyme activity, causing tumours and DNA hypermethylation [71].
Furthermore, the activity of both TET enzymes and Jumonji domain containing histone demethylases (Jmj-KDMs) can be impeded by subsequent metabolites of the citric acid
24
cycle, for instance fumarate and succinate [93]. Thus, metabolic rate, DNA methylation and chromatin dynamics are tightly connected.
Figure 6. The relationship between DNA (de)methylation and intermediary metabolism. DNA can acquire methylation by DNMT enzymes via a methyl group originating from the SAM-SAH and folate cycle. DNA can be demethylation by TeT enzymes via α-ketoglutarate. NAD: Nicotinamide adenine dinucleotide; THF:
Tetrahydrofolate; SAM: S-adenosyl-methionine; SAH: S-adenosyl-homocysteine.
(modified from [35])
2.3.2. Introduction to nutritional challenges
Nutritional challenges accompanied mankind throughout history. During most of the time, lack of sufficient food caused and causes problems. More recently, eating habit alterations (diets, irregular calorie intake, eating junk food) are more and more frequent.
Exaggerated calorie intake - or so-called ‘Western diet’ rich in macronutrients, fat, carbohydrates and protein - leads to obesity, which is nowadays becoming epidemic. It is a well-known risk factor for a lot of diseases, for instance diabetes, cardiovascular diseases (hypertonia, stroke, etc.) and different types of cancer [94, 95].
Nutritional stress can be divided into 2 groups: chronic and acute. By chronic nutritional stress or obesity, almost 2 billion people are affected worldwide
25
[http://www.who.int/en/96Access date: 06/02/2018]. Moreover, cardiovascular diseases are among the leading causes of death nowadays. Interestingly, both human and rodent studies strongly suggest the role of epigenetic mechanisms in the development of this disease., obesity can affect the following generations, which is much less investigated in human [97] than in rodents [98, 99].
On the other hand, a frequent form of acute nutritional stress is fasting. Since stable blood sugar level is required for glucose homeostasis and metabolic equilibrium, several biochemical pathways have evolved to maintain its concentration above a certain limit.
Although these mechanisms are well-known, regulation of the implicated genes is still only partially understood.
2.3.3. Previous studies of nutritional stress
2.3.3.1. Studies on chronic nutritional stress
In vivo studies demonstrating the dynamic changes of chromatin modifications upon environmental challenges are getting more and more frequent. In rodents, the common models investigate different setups of nutritional challenge. Thousands of studies were published on the effect of diets in rodents. It became clear that high-fat, high carbohydrate, calorie restricted, folate and protein-deficient diets disrupt the metabolic balance of the offspring.
Diets have been proved to affect the following generations, as well. Adequate nutrition including macronutrients and micronutrients during pregnancy is important for the normal growth of the embryo and foetus. Perturbations (e.g. not sufficient maternal nutrition) can lead to oxidative stress and DNA damage and mortality [100, 101]. In addition, this may result in cardiovascular diseases, insulin resistance, and increased body fat in adulthood. In rats, for example, HFD lead to early reproductive maturation and later obesity in the offspring [102]. Furthermore, in utero exposure to maternal diabetes results in insulin intolerance and high blood pressure in the offspring [103].
Deficiency in an essential nutrient, folate is a known risk factor for liver injury. Maternal methyl donor (folate) supply during pregnancy has long-term effects on the metabolism of the offspring. Folate protects hepatocytes of hyperhomocysteinemia mice from
26
apoptosis [104]. Low selenium and folate in maternal diet during gestation and lactation has more effects on gene expression in offspring post-weaning in the mouse liver [105].
These experiments point out the importance of the maternal diet (e.g. folate and other methyl donors) during pregnancy on DNA methylation patterns and the metabolism of the offspring. Epigenetics seems to be the link between early life nutrition with later health [106]. We have seen from the above investigations, that nutritional challenges are often accompanied by general disturbances of covalent chromatin modifications.
2.3.3.2. Studies on acute nutritional stress
The changes in transcription factors and enzymes related to metabolism are quite well- studied upon fasting for different, but short durations. However, there are only a very few number of studies investigating epigenetic alterations triggered by metabolic alterations.
Namely, differential methylation at the promoter of the Pepck (Phosphoenolpyruvate carboxykinase) gluconeogenic gene was observed in the post- weaning rats with folic-acid supplemented diet [107]. Furthermore, fasting induced gluconeogenesis, glycogenolysis, β-oxidation and ketogenesis. 12-hour fasting dramatically decreased serum glucose levels in mice and 16-hour fasting increased serum β-OH butyrate concentration [108]. Hepatic glucose production relies on Glucose-6- phosphatase and PEPCK expression, which were also elevated upon 16-hour fasting.
Ketogenesis increased, shown by accumulation of liver triacylglycerol. Enhanced ketogenesis was also characterized by increased Carnitine O-palmitoyltransferase 1 (Cpt1), 3-Hydroxybutyrate Dehydrogenase 1 (Bdh1) and 3-Hydroxy-3-Methylglutaryl- CoA Synthase 2 (Hmgcs2) mRNA levels. Refeeding for 1-2 hours after fasting leads to decreased G6Pase and PEPCK mRNA expression. In addition, Cpt1, Bdh1 and Hmgcs2 were no longer elevated. Therefore, refeeding immediately blocked hepatic ketogenesis.
The pancreatic hormones regulate the response of the liver to metabolic stress. The insulin/glucagon ratio is decreased upon fasting and restored upon refeeding. Glucagon elevated cAMP concentrations, which directly regulates the transcription of the above mentioned genes. In addition, FoxO1 was dephosphorylated and gluconeogenesis was upregulated [108].
Another study reported decreased hepatic Fatty acid synthase (Fas) and Srebp1c mRNA
27
level upon 24 hours’ fasting, which was restored upon refeeding. Srebp1c is a TF regulating lipogenesis, and it regulates the expression of Fas, which is a key enzyme involved in fatty acid synthesis. Increased insulin levels during refeeding enhanced the activity of Srebp1c. At the same time, elevated RXRβ, γ and Liver X receptor α and β (LXRα and β) mRNA levels were reported [109]. LXR promoted the transcriptional activation of Srebp1c [110]. Furthermore, the mRNA level of Insig2 - encoding a protein, which inhibits the activation of Srebp – was increased when mice were fasted and decreased when refed [111]. Insulin-mediated decrease of Insig2 allows fatty acid synthesis.
Despite the detailed investigations of TFs and enzymes playing a role in metabolic adaptation to nutritional stress, these challenges are less studied in regard to chromatin changes and especially to DNA methylation alterations. In addition, the role of chromatin structure changes and epigenetic factors in these processes need detailed investigations.
The switches between periods of scarcity and excess of nutrients require fast adaptive regulation, which includes hormonal responses, gene expression and chromatin changes.
By investigating the molecular mechanisms of fasting and refeeding, understanding the fundamental process of physiology has important clinical relevance. Furthermore, the epigenetic component of acute fasting and refeeding is still only poorly understood.
2.3.4. Glucose homeostasis under physiological and stress conditions
For the metabolic balance of mammalian hepatocytes, the role of glucose is unquestionable. The process of maintaining blood glucose at a steady-state level is called glucose homeostasis. For instance, diabetes mellitus - characterized by the inability to maintain glucose homeostasis - is the clinical manifestations of a long-term metabolic abnormality. The result of impaired glucose homeostasis is hyperglycemia. In order to avoid hyperglycemia and fasting hypoglycemia, the body can adjust glucose levels by various cellular mechanisms.
2.3.4.1. Glucose metabolism under physiological conditions
Glucose is an essential energy-providing source for most mammalian tissues. Its
28
metabolism is tightly regulated, the rate of which is controlled by the consumption of carbohydrates and its absorption in the intestines. The equilibrium among the regulating hormones, namely glucagon, insulin and cortisol is well established in all the key metabolic tissues, such as the brain and the skeletal muscle, however, the critical organ is the liver (Figure 7). Glucose is taken up and can be converted to pyruvate by glycolysis (via the action of the tissue-specific liver-type pyruvate kinase LPK). Excess of glucose is transported by Glut2 and stored as glycogen via glycogenesis and the activation of glycogen synthase (GS). Several other metabolic pathways, for instance lipogenesis, fatty acid biosynthesis and triglyceride synthesis play a role in storage, and at the end, white adipose tissue serves as the depo. Several transcription factors take part in the regulation of these pathways, such as sterol regulatory element binding protein 1c (SREBP-1c) and carbohydrate response element binding protein (ChREBP) (reviewed in [112].
Figure 7. Glucose metabolism and the insulin cycle. (modified from [113])
2.3.4.2. Glucose metabolism in fasting
Upon fasting, glycogenolysis and gluconeogenesis are activated in order to maintain glucose levels via its production and release. In fasting conditions, glucagon levels are
29
elevated, while insulin levels are decreased. Glycogen is broken down via glycogenolysis.
Long-term fasting results in de novo glucose synthesis via gluconeogenesis. The enzymes participating in this pathway are: glucose-6-phosphatase (G6Pase), fructose 1-6- bisphosphotase (Fbpase), pyruvate carboxylase (PC) and phosphoenolpyruvate carboxykinase (PEPCK). Hormone signals are also important in generating the desired outcome. The major catabolic hormone glucagon and the stress hormone cortisol activate several transcription factors.
2.3.5. Transcription factors regulating glucose homeostasis in fasting
Fasting, a significant perturbation of mammalian metabolism is very well described at the level of hormones, molecules and enzymes, but until now, only little is known about the underlying complex transcription factor network. Indeed, fasting is highly regulated at the transcriptional level leading to dynamic adaptation to metabolic needs. Upon fasting, transcription factor binding occurs to specific target sequences.
The fasting-related TF families are reported in the literature, which are the following:
nuclear receptors (e.g. hepatocyte nuclear factor 4 alpha - HNF4α, glucocorticoid receptor - GR, peroxisome proliferator activated receptor alpha - PPARα, retinoic acid receptor - RXR), cAMP responsive element binding proteins (e.g. CREB1), forkhead box proteins (e.g. FoxO1) and CCAAT enhancer binding proteins (e.g. CEBPα, β). Essential co- activators of gluconeogenesis are the CREB binding protein (CBP)/p300 and the peroxisome proliferator-activated receptor gamma co-activator 1 alpha (PGC-1α) [114].
2.3.5.1. HNF4α in fasting
The maintenance of glucose homeostasis upon fasting and feeding (or hormone) is tightly regulated, already at the transcriptional level, for instance through the action of HNF4α.
Glucokinase (GK) and glucose-6-phosphatase (G6Pase) are the key enzymes of glycolysis and gluconeogenesis, respectively. During fasting, GK transcription is inhibited, while feeding or insulin activates it [115] (Figure 8). It has been reported that HNF4α and FoxO1 play important roles in these processes, moreover, they directly interact with each other [116]. Upon fasting, FoxO1 represses HNF4α-potentiated GK
30
transcription, whereas it activates G6Pase gene activation synergizing with HNF4α [117].
Under this condition, FoxO1 localizes in the nucleus and it represses GK promoter activity. At the same time, FoxO1 and HNF4α synergistically activate the G6Pase promoter. There are HNF4α-binding elements (HBEs) on both the GK and the G6Pase promoter. The former contributes to the activation of GK upon insulin stimulation, whereas the latter to the repression of G6Pase upon insulin. During feeding (or insulin treatment), FoxO1 is phosphorylated by Akt and released from HNF4α [116], which can activate the GK promoter via the HBE shifting the balance to glycolysis. Thus, FoxO1 can have both positive and negative influence on target gene activity. HNF4α reciprocally regulates GK and G6Pase in that FoxO1 translates the insulin signal. These two processes together shift the metabolic balance towards gluconeogenesis [117] (Figure 8). It is the combination of TF binding to a promoter that determines the actual transcriptional outcome. In addition, the promoter region of L-PK (liver-type pyruvate kinase), an important enzyme having a regulatory role in glycolysis can also have FoxO1-regulated, HNF4α-potentiated transcriptional activity [118].
Figure 8. Regulation of glucose homeostasis by FoxO1 and HNF4α [117]. Upon
31
fasting, FoxO1 binding to HNF4α synergistically activate the gluconeogenic G6Pase and Glucokinase is inhibited. On the contrary, upon feeding, FoxO1 is phosphorylated and HNF4α is free to activate the glycolytic Glucokinase. HNF4α: Hepatocyte nuclear factor 4 alpha; Fox1: Forkhead box protein O1; G6Pase: Glucose-6-phosphatase. Permission to reuse is obtained from the journal.
2.3.5.2. Interaction between HNF4α and PGC-1α
PGC-1α also interacts with HNF4α. In mouse primary hepatocytes lacking HNF4α, PGC- 1α cannot activate gluconeogenic genes. PGC-1α also activates the genes of β-oxidation and ketogenesis, however, it was found to be independent of HNF4α activity [119].
A total knockout of HNF4α is embryonic-lethal, but liver-specific knockout mice are viable, however, they have defective lipid homeostasis. HNF4α is required for PGC-1α action (Figure 9). To prove that, PGC-1α was expressed in primary hepatocytes lacking HNF4α, which eliminated PEPCK and G6Pase mRNA levels. PGC-1α interacts with HNF4α on the response element of PEPCK promoter. Furthermore, HNF4α itself is not capable of activating the G6Pase promoter, only in the presence of PGC-1α. Finally, not every HNF4α binding site is targeted by PGC-1α co-activation. For instance, PGC-1α can induce β-oxidation even in the absence of HNF4α [119].
32
Figure 9. Regulation of hepatic gluconeogenesis by HNF4α and PGC-1α [120].
Fasting induces glucagon/PKA, which activates PGC-1α. In complex with HNF4α, hepatic gluconeogenic genes PEPCK and G6Pase are activated. Feeding has the opposite effect through the action of insulin/PKB and SMILE. PKA: Protein kinase A; PGC-1α:
Peroxisome proliferator-activated receptor gamma co-activator 1 alpha; HNF4α:
Hepatocyte nuclear factor 4 alpha; PEPCK: Phosphoenolpyruvate carboxykinase;
G6Pase: Glucose-6-phosphatase; SMILE: Small heterodimer partner-interacting leucine zipper protein. Permission to reuse is obtained from the journal.
2.3.6. Cholesterol homeostasis
2.3.6.1. Cholesterol 7α-hydroxylase (CYP7A1)
Cholesterol homeostasis depends on the conversion of cholesterol to bile acids in the
33
liver. This mechanism eliminates excess of cholesterol. CYP7A1 is the enzyme catalyzing the first step of the pathway. It regulates bile acid synthesis and lipid homeostasis. CYP7A1 expression is controlled by various factors, for instance bile acids, nutrients and hormones. A binding site for HNF4α has been identified in the human CYP7A1 promoter, which regulates its transcription [121]. It binds to the bile acid response element (BARE). It has been shown recently that bile acids block HNF4α recruitment of the PGC-1α co-activator to both CYP7A1 and PEPCK genes therefore inhibiting their transcription. The fasting-feeding cycle regulates bile acid production, and fasting induces CYP7A1 expression together with the activation of the gluconeogenic PEPCK via PGC-1α [122]. Reduction of bile acid synthesis (by fasting) leads to increased cholesterol levels in the liver. Nutritional status affects CYP7A1 through the regulation of insulin and glucagon hormones. Fasting represses CYP7A1 expression in rats [123].
In addition, it has been reported that glucagon and cAMP inhibit CYP7A1 mRNA expression [124]. Furthermore, cAMP can reduce CYP7A1 gene expression in human primary hepatocytes via the action of PKA, which phosphorylates HNF4α. It was shown that the glucagon/cAMP/PKA signalling is responsible for the reduced binding and trans- activational capacity of HNF4α on CYP7A1. However, there is contradiction in the literature as bile acids were reported to inhibit PEPCK [122] and that fasting and cAMP induce both CYP7A1 and PEPCK expression [125].
2.3.7. Temporal organization of transcriptional regulation
On the whole, transcriptional regulatory events are temporally organized during fasting [126]. Firstly, glucagon is secreted shortly upon blood glucose level decrease, which leads to CREB1 activation. TFs regulating fuel production are strictly organized in two major modules: the gluconeogenic and ketogenic module. As the first stage of fasting response, corticosterone is secreted, and GR-activated CREB1 results in the activation of gluconeogenesis. Gluconeogenesis begins approximately 4-6 hours after the beginning of fasting. It is activated to maintain blood glucose levels. At this stage, GR binds to new regulatory sites and increases accessibility to CREB1 binding sites [126]. Therefore, hepatic glucose production is vastly elevated.
Additionally, GR-induced PPARα leads to the activation of ketogenesis. Accordingly, the
34
delayed ketogenic gene expression results in the production if ketone bodies from fatty- acid oxidation, and it will be the dominant fuel-producing pathway. Prolonged fasting activates fatty acid activation in order to provide ATP for the liver [126]. The formation and export of ketone bodies provide alternative source of glucose for the brain.
Hyperglycemia is the major cause of type II diabetes.
2.3.8. Refeeding: hormonal and transcriptional responses
During refeeding, insulin represses glucagon secretion in the pancreas and its action in the liver. Insulin activates the Akt kinase cascade, which activates several pathways including hepatic glucose uptake of hepatocytes. LXR, a nuclear receptor also activates lipogenic genes and activates another transcription factor Srebp1c [127]. Srebp1c was reported to be diminished in fasted mice, whereas increased upon refeeding [128].
Altogether, glycogenolysis, gluconeogenesis and fatty acid oxidation are inhibited, whereas glucose degradation, citric acid cycle, fatty acid and triglyceride synthetic pathways are activated. As mentioned earlier, the DNA methylation changes, their role and the mechanism of their appearance have not been studied yet in detail during the fasting-refeeding cycle.
35
3. OBJECTIVES
I intended to answer the following questions during my PhD:
I. What is the subcellular localisation and the role during human embryonic development of the group of human PRD-class proteins (Argfx, Dprx, Leutx and Tprx)?
II. Does ERK1 phosphorylate HNF4α? If yes, what is the result of ERK1/2- phosphorylated HNF4α on target gene transcription and target gene DNA-binding?
III. What are the macroscopic, protein level and methylation changes occurring upon short-term fasting and refeeding in vivo?
IV. How does treatment with DNA methylation inhibitor or ascorbate affect genomic 5mC and 5hmC levels in cell lines?
36
4. METHODS
Firstly, those methods and techniques will be described which I performed by myself.
The only exception is the “Mouse nutritional stress timeline”, which was designed and accomplished together with Tamás Arányi and Flóra Szeri.
4.1. Cloning of homeobox genes
Human Argfx coding sequence was synthesized by GenScript. Dprx and Leutx were cloned by ligating PCR products. 5’ Tprx region was ligated to Tprx1-specific 3’ region amplified from human DNA. The coding sequences were cloned in-frame with a C- terminal V5 tag in pSF-CMV-COOH-V5 vectors (Oxford Genetics). I transfected the vectors into HeLa cells.
4.2. Immunofluorescence
Immunofluorescence was performed after 48h culture. Cells were fixed with 4%
paraformaldehyde. Cells were then permeabilized and BSA blocked (1%, 30 min). Cells were stained with anti-Argfx, anti-Dprx (Abcam) or anti-V5 (ThermoFisher) specific antibodies for 1 h and stained with secondary antibody (Alexa Fluor 488 or 594, ThermoFisher). Cells were co-stained with phalloidin and DAPI (ThermoFisher).
4.3. Cell culture
HepG2 human hepatoma cell line was purchased from ATCC (ATCC HB-8065) and kept in Advanced MEM (ThermoFisher) supplemented with 10% FBS, 2mM L-glutamine, 100 U/ml penicillin and 100 mg/ml streptomycin. HeLa cells were obtained from ATCC and cultured according to the manufacturer’s instructions (DMEM supplemented with 10% FBS, 2mM L-glutamine, 100 U/ml penicillin and 100 mg/ml streptomycin).
Treatment was performed in serum-free medium for 30 minutes or 24 hours with human recombinant epidermal growth factor (Sigma–Aldrich) at 100 ng/ml final concentration.

![Figure 7. Glucose metabolism and the insulin cycle. (modified from [113])](https://thumb-eu.123doks.com/thumbv2/9dokorg/1383679.114308/28.892.301.586.538.898/figure-glucose-metabolism-insulin-cycle-modified.webp)
![Figure 8. Regulation of glucose homeostasis by FoxO1 and HNF4α [117]. Upon](https://thumb-eu.123doks.com/thumbv2/9dokorg/1383679.114308/30.892.133.770.626.1037/figure-regulation-glucose-homeostasis-foxo-hnf-α.webp)
![Figure 9. Regulation of hepatic gluconeogenesis by HNF4α and PGC-1α [120].](https://thumb-eu.123doks.com/thumbv2/9dokorg/1383679.114308/32.892.157.740.128.661/figure-regulation-hepatic-gluconeogenesis-hnf-α-pgc-α.webp)