Neurocognitive Signatures of Parkinson’s and Alzheimer’s Disease
Thesis
Dr. Nikoletta Bódi
Semmelweis University Mental Health Sciences
Supervisor: Prof. Szabolcs Kéri, M.D., Ph.D., D.Sc.
Reviewers: Prof. Csaba Pléh, M.D., Ph.D., D.Sc.
Dr. Tibor Kovács, M.D., Ph.D.
Chairman of final examination committee: Prof. Mária Kopp, M.D., Ph.D., D.Sc.
Members of final examination committee: Prof. István Czigler, Ph.D., D.Sc.
Dr. György Purebl, M.D., Ph.D.
Budapest
2012
2
Introduction
The proper clinical diagnosis of neurodegenerative diseases is often difficult given the large overlap in signs and symptoms. In the clinical practice, physicians focus on signs and symptoms and their progression; the classification systems of diseases is based on expert consensus bearing the sign of subjectivity, and we have to face with the fact that definitive biomarkers are still missing from the everyday practice. One possible solution is the standardized application of neuropsychological tests measuring the functional integrity of neuronal circuits, possibly with markers from peripheral blood and brain imaging. In this, thesis we describe a series of experiments, which were designed to achieve this general aim.
From a neuroanatomical point of view, we investigated three disorders: (1) Parkinson’s disease (PD) with a marked impairment of frontostriatal circuits mediating motor control, cognition, and emotions; (2) early Alzheimer’s disease (AD) associated with medial temporal lobe pathology; (3) frontotemporal dementia (FTD) with behavioural symptoms and executive dysfunctions.
Our specific aims were as follows:
1. We investigated young, never-medicated patients with PD and a matched sample of PD patients who were on dopamine agonist therapy. We followed-up the never-medicated sample after the initiation of dopamine agonists pramipexole or ropinirole (longitudinal, within-subject part of the study). We used a feedback-based probabilistic classification learning task that enabled us to investigate stimulus-response learning guided by positive and negative feedback (winning and losing virtual money). Results from this feedback-based task were compared with personality traits as measured by the Temperament and Character Inventory (TCI). Specifically, we were interested in novelty seeking and harm avoidance in unmedicated and medicated PD patients and their relationship with reward and punishment learning.
2. We investigated feedback-guided stimulus-response learning in early AD and tested the generalization and flexibility of these associations. The data analysis was focused on acquired equivalence and on the retrieval of associations in a free task context (non-directed card pairing) instead of instrumental responding.
3. The third specific aim was to test the discriminative power of the clock-drawing test (CDT) regarding AD vs. FTD. The aim of our study was to examine both overall and specific error differences. We only examined the command condition of the CDT, because it is a more
3
sensitive and cognitively demanding measure compared to the copy condition. The data analysis was focused on errors related to visuospatial difficulties and conceptual problems, as visuospatial skill can be relatively preserved in FTD patients, and AD patients are expected to display more conceptual errors.
Methods
Participants
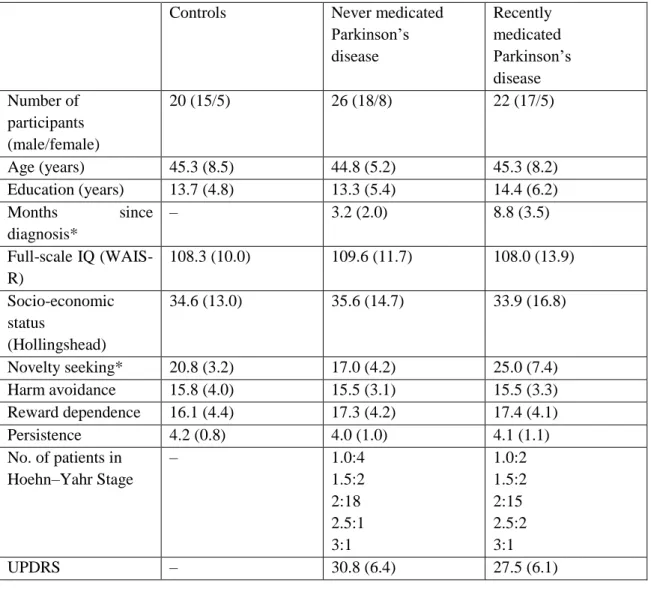
1. The clinical and demographic data of PD patients are shown in Table 1. The mean dose of pramipexole (n=12) was 4.5 mg/day (range: 2.5-6.0 mg/day), the mean dose of ropinirole (n=10) was 5.5 mg/day (range: 2.0-7.0 mg/day). After baseline testing, never- medicated PD patients started dopamine agonist therapy and were followed-up for 12 weeks (pramipexole: n=14, mean dose at follow-up: 4.0 mg/day, range 2.0-6.0 mg/day; ropinirole:
n=12, mean dose at follow-up: 5.5 mg/day, range: 2.0-7.5 mg/day). After this period, participants were re-evaluated.
Table 1. Clinical and demographic characteristics of the participants
Controls Never medicated
Parkinson’s disease
Recently medicated Parkinson’s disease Number of
participants (male/female)
20 (15/5) 26 (18/8) 22 (17/5)
Age (years) 45.3 (8.5) 44.8 (5.2) 45.3 (8.2)
Education (years) 13.7 (4.8) 13.3 (5.4) 14.4 (6.2)
Months since diagnosis*
– 3.2 (2.0) 8.8 (3.5)
Full-scale IQ (WAIS- R)
108.3 (10.0) 109.6 (11.7) 108.0 (13.9)
Socio-economic status
(Hollingshead)
34.6 (13.0) 35.6 (14.7) 33.9 (16.8)
Novelty seeking* 20.8 (3.2) 17.0 (4.2) 25.0 (7.4)
Harm avoidance 15.8 (4.0) 15.5 (3.1) 15.5 (3.3)
Reward dependence 16.1 (4.4) 17.3 (4.2) 17.4 (4.1)
Persistence 4.2 (0.8) 4.0 (1.0) 4.1 (1.1)
No. of patients in Hoehn–Yahr Stage
– 1.0:4
1.5:2 2:18 2.5:1 3:1
1.0:2 1.5:2 2:15 2.5:2 3:1
UPDRS – 30.8 (6.4) 27.5 (6.1)
4
HAM-D – 4.2 (1.4) 4.6 (2.0)
HAM-A – 3.1 (1.8) 3.3 (1.5)
Data are mean (standard deviation). *Significant difference across group, P<0.05. UPDRS Unified Parkinson’s Disease Rating Scale. HAM-D Hamilton Depression Rating Scale. HAM-A Hamilton Anxiety Rating Scale.
WAIS-R Wechsler Adult Intelligence Scale.
2. The clinical and demographical data of AD patients are shown in Table 2.
The diagnosis of probable AD was made according to the National Institute of Neurological and Communicative Disorders and Stroke and the Alzheimer’s Disease and Related Disorders Association (NINCDS-ADRDA) criteria. Exclusion criteria consisted of vascular lesions on MRI scans and prior neurological and psychiatric disorders.
Table 2. Clinical and demographical characteristics of the participants
Controls (n=20) Alzheimer’s patients (n=22)
Age (years) 70.1 (4.8) 69.8 (6.9)
Male/female 12/8 15/7
Education (years) 13.7 (3.2) 13.6 (3.8)
MMSE 29.4 (0.7) 24.0 (1.3)
GDS - 3.7 (0.5)
There were no significant differences between controls and Alzheimer’s patients with the exception of the Mini- Mental State Examination (MMSE) scores (p<0.0001). GDS Global Deterioration Scale.
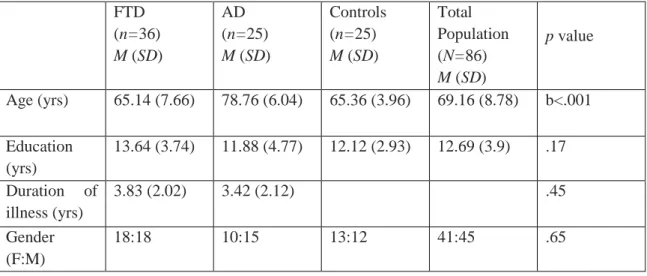
3. Table 3 represents the characteristics FTD and AD patients. The FTD group was composed of frontotemporal dementia behavioral variant (FTD-bv) (n=18), primer non-fluent aphasia (PNFA) (n=13), and semantic dementia (SD) (n=5) patients. The AD patients all met the criteria for probable Alzheimer’s disease according to the NINCDS-ADRDA criteria. The FTD sample fulfilled the Neary and McKhann criteria. The PNFA group included patients who were anomic, logopenic, and nonfluent. The SD group was diagnosed by the presence of a prominent comprehension deficit, naming difficulty, and asking the meaning of nouns and objects.
Table 3. Demographic characteristics, cognitive test results, and overall CDT scores of participants FTD
(n=36) M (SD)
AD (n=25) M (SD)
Controls (n=25) M (SD)
Total Population (N=86) M (SD)
p value
Age (yrs) 65.14 (7.66) 78.76 (6.04) 65.36 (3.96) 69.16 (8.78) b<.001
Education (yrs)
13.64 (3.74) 11.88 (4.77) 12.12 (2.93) 12.69 (3.9) .17
Duration of illness (yrs)
3.83 (2.02) 3.42 (2.12) .45
Gender (F:M)
18:18 10:15 13:12 41:45 .65
5 MMSE
(maximum 30)
24.22 (3.98) 22.12 (1.92) 28.84 (1.07) 24.95 (3.86) c<.001
DRS-2 (maximum 144)
113.21 (20.23)
113.25 (11.55)
139.44 (3.59) 121.63 (18.94)
a<.001
CDT (maximum 10)
7.74 (1.99) 5.48 (2.36) 9.54 (.58) 7.6 (2.4) c<.001
Note. AD Alzheimer’s disease, FTD Frontotemporal dementia. MMSE Mini-Mental State Examination. DRS-2 Dementia Rating Scale. a controls versus FTD, controls versus AD; b AD versus controls, AD versus FTD; c FTD versus controls, FTD versus AD, controls versus AD.
Neuropsychological Tasks
1. In the reinforcement learning experiment, participants were administered a computer-based probabilistic classification task. On each trial, participants viewed one of four images, and were asked to guess whether it belonged to category A or category B. For each participant, the four images were randomly assigned to be stimuli S1, S2, S3, and S4. A second set of similar images (S5-S8) were used for repeated testing. On any given trial, stimuli S1 and S3 belonged to category A with 80% probability and to category B with 20%
probability, while stimuli S2 and S4 belonged to category B with 80% probability and to category A with 20% probability. Stimuli S1 and S2 were used in the reward-learning task.
Thus, if the participant correctly guessed category membership on a trial with either of these stimuli, a reward of +25 points was received; if the participant guessed incorrectly, no feedback appeared. Stimuli S3 and S4 were used in the punishment-learning task. Thus, if the participant guessed incorrectly on a trial with either of these stimuli, a punishment of –25 was received; correct guesses received no feedback. The task contained 160 trials. On each trial, the computer recorded whether the participant made the optimal response (i.e. category A for S1 and S3, and category B for S2 and S4) regardless of actual outcome.
Following the probabilistic classification task, all participants were administered the Hungarian version of the Temperament and Character Inventory (TCI) questionnaire, which has a good test-retest reliability. In this study, we focused on the temperament traits of novelty seeking, harm avoidance, and reward dependence, and persistence. Thus, in addition to the main focus on novelty seeking and harm avoidance, data also were collected on reward dependence and persistence in order to test the specificity of possible alterations in personality traits.
2. In the associative learning task (Figure 1) the antecedent stimuli were four drawings of faces (man, woman, girl, boy). The consequents were drawings of fish colored
6
red, orange, purple, and pink. For each participant, stimuli were randomly assigned as antecedent and consequent stimuli. On each trial, a face and two fish drawings were displayed on the computer screen along with the prompt: “Which fish does this person have? Use the Left or Right key to choose”. The participant responded with pressing one of two separate keys labeled as “LEFT” and “RIGHT” to indicate whether the fish on the left or the fish on the right was associated with the face. The selected fish drawing was circled and corrective feedback was given. In the case of an incorrect response, an alert beep sounded. There were three stages in the acquisition phase. Stages 1 and 2 terminated after 8 consecutive correct responses, whereas stage 3 terminated after 12 consecutive correct responses. The participant was not informed on the beginning of a new stage. After the termination of the acquisition phase, a new instruction appeared on the screen, informing the participant that the task would remain the same but feedback would no longer be provided. The participant was not informed of the presence of new associations. The transfer phase consisted of 48 trials of which 12 trials were new associations for the testing of learned equivalence and 36 trials were old associations trained during the acquisition phase. The dependent measures were the mean number of errors in the acquisition phase and the proportion of incorrect responses in the transfer phase.
Figure 4. Example screen events during one trial. (A) Stimuli appear. (B) Participant responds and corrective feedback is given.
Which fish does this person have?
Use "Left" or "Right" key to choose.
Which fish does this person have?
Use "Left" or "Right" key to choose.
Correct!
Which fish does this person have?
Use "Left" or "Right" key to choose.
Which fish does this person have?
Use "Left" or "Right" key to choose.
A
B
Correct!
7
3. In the visuospatial assessment, after receiving a pencil and a blank sheet of paper, participants were told to draw a clock, put in all the numbers, and set the hands for 10 after 11. The drawings were analyzed by two judges who were blinded to the diagnosis and identity of each individual in our study.
The judges followed the quantitative (overall) scoring system, set out by Rouleau et al, with a maximum of 10 points. It was designed to examine the clock face (maximum, 2 points), layout of numbers (maximum, 4 points), and the position of the hands (maximum, 4 points). The average score of the raters was used in the analysis. Qualitative error scoring was done according to six error types also employed by Rouleau et al.: (1) clock sizes that are either large (greater than 12.7 cm) or small (less than 3.81 cm); (2) graphic difficulties such as distortions in the clock face, hands or a general clumsy performance; (3) stimulus-bound responses that are either pure (also known as the “frontal pull” response), where the hands are set to 10 to 11 instead of 10 after 11; or other types of stimulus bound responses that are also rated as conceptual errors, such as the time written on the clock, absent hands or hands pointed to 10 or 11; (4) conceptual deficits that include misrepresentation of the time, such as the hands are absent or inadequately displayed; or misrepresentation of the clock face, such as a clock without numbers or the inappropriate use of numbers; (5) spatial or planning deficits that include neglect of the left half of the clock, gaps between numbers, numbers outside the clock, and counterclockwise layout of numbers; and (6) perseveration of hands or numbers. A qualitative error was considered present only if both judges agreed on its presence.
Data analysis
The STATISTICA 7.0 software was used for data analysis. Kolmogorov-Smirnov tests were used to check the normality of data distribution. Data were then analyzed with mixed-model,
8
repeated measures analyses of variance (ANOVAs), followed by post hoc tests (Tukey’s HSD test or Scheffé’s test). Pearson’s or Spearman’s correlation coefficients were calculated among variables. The level of statistical significance was p<0.05 (Bonferroni corrected where appropriate).
Results
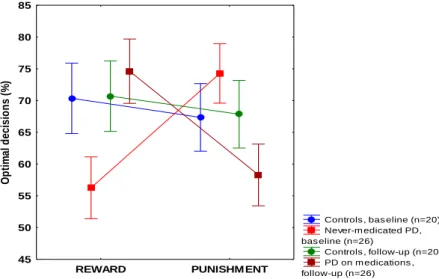
1. Reward and punishment learning in PD (in a cross-sectional design comparing medicated and unmedicated patients- and in a longitudinal design -comparing patients before and after medication). The never-medicated PD patients displayed significantly impaired performance on reward learning as compared with the controls, whereas the opposite effect was found for punishment learning: the patients outperformed the controls. When the recently-medicated PD patients were compared with the controls, there was no significant difference for reward learning, but the patients displayed significantly impaired performance on punishment learning. Finally, when the recently-medicated and the never-medicated PD patients were compared, we found that the recently-medicated group outperformed the never- medicated group in the reward condition, whereas the opposite was found in the punishment condition (Figure 2).
Figure 2. Results from the feedback-based probabilistic classification task at baseline and at follow-up when Parkinson’s patients (PD) received pramipexole and ropinirole. In reward learning, performance in the unmedicated baseline condition was significantly worse than in the medicated follow-up condition, whereas in punishment learning, performance in the unmedicated condition was significantly better than in the medicated condition (p<0.001). Data are mean, error bars indicate standard errors.
Controls , bas eline (n=20) Never-m edicated PD, bas eline (n=26)
Controls , follow-up (n=20) PD on m edications , follow-up (n=26)
REWARD PUNISHM ENT
45 50 55 60 65 70 75 80 85
Optimal decisions (%)
9
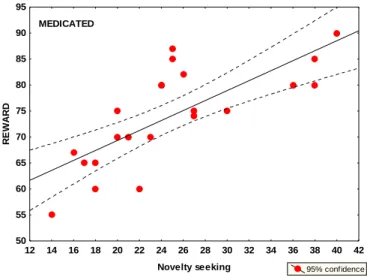
2. Personality traits in PD. The never-medicated PD patients exhibited significantly lower novelty seeking scores compared with controls and with recently-medicated patients. In addition, the recently-medicated patients exhibited significantly higher novelty seeking scores compared with the controls. In the healthy control group, there was a significant positive relationship between the percent of optimal choices on the feedback-based task for positive feedback (reward) and novelty seeking scores. A similar tendency was observed in never- medicated PD patients, but this did not reach the level of statistical significance. We observed the strongest positive correlation in recently-medicated PD patients (Figure 3). In the healthy control group, we also observed a significant positive correlation between the percent of optimal choices on the feedback-based task for negative feedback (punishment) and harm avoidance scores, which also was present in never-medicated PD patients but not in recently- medicated patients. When the correlation analysis was corrected for multiple comparisons (Bonferroni, alpha adjusted to 0.002), only the correlation between novelty seeking and reward learning in the recently-medicated PD group, and the correlation between harm avoidance and punishment learning in the controls reached the level of significance.
Dopaminergic medications significantly increased novelty seeking, whereas harm avoidance and reward dependence did not change significantly. This was not accompanied by clinical changes in mood and anxiety, because HAM-D and HAM-A scores were similar at the baseline and at the follow-up assessment.
Figure 3. Correlations between novelty seeking and reward learning in recently-medicated patients (red)
3. Flexibility and generalization of stimulus-response associations in AD. Patients with AD committed more errors compared with controls. Tukey HSD tests revealed that patients with AD were severely impaired in the case of new associations (acquired equivalence) but not in the case of old associations of the transfer phase which means that
12 14 16 18 20 22 24 26 28 30 32 34 36 38 40 42 Novelty seeking
50 55 60 65 70 75 80 85 90 95
REWARD
95% confidence MEDICATED
10
patients with early AD were able to learn stimulus-response associations using trial-by-trial feedback following decisions but generalization of these associations, as measured by acquired equivalence, was impaired (Figure 4). The card pairing test revealed that the patients with AD showed lower performance than controls in the case of old and new associations, which means when stimulus-response associations must be used in a situation requiring flexible declarative knowledge, AD patients were impaired, too.
Figure 4. Performance in the transfer phase of the task (immediate and delayed testing). Old associations refer to fish-face pairs exposed in the training phase. New associations refer to never trained pairs learned during acquired equivalence. Error bars indicate 95% confidence intervals.
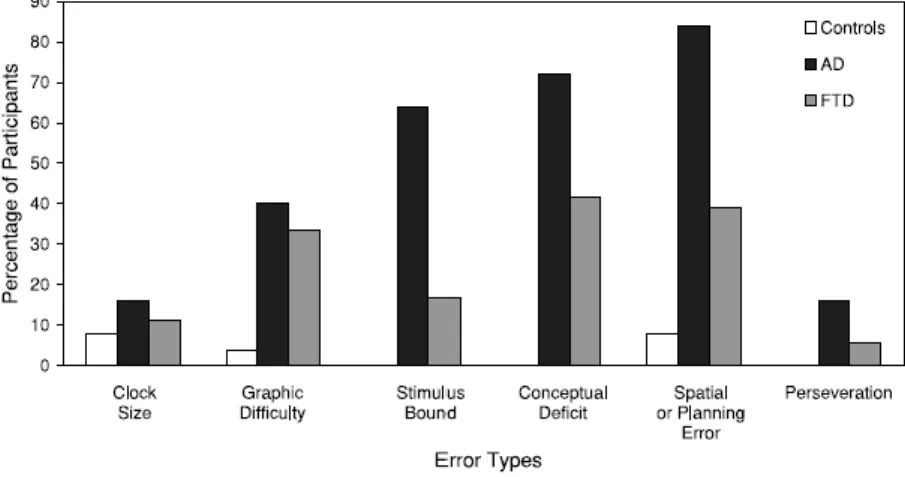
4. Visuospatial abilities in AD and FTD. Results in the visuospatial assessement revealed that on quantitative analysis of CDT control group had significantly higher scores than the FTD and AD groups (the adjusted means for the control, FTD, and AD groups were 9.6 (SE=5.38), 7.62 (SE=5.33), and 5.53 (SE= 5 .48), respectively). The FTD group had significantly higher scores than the AD group. On qualitative error analysis the groups differed significantly in graphic, stimulus bound, conceptual, and spatial or planning errors (Figure 5). Comparisons between the dementia groups showed significantly fewer errors in stimulus bound responses, conceptual deficits, and spatial or planning errors, in FTD patients compared to the AD group. Subanalysis of stimulus-bound responses showed significantly fewer errors in the FTD group compared to the AD group in “frontal pull” and stimulus bound responses that are also rated as conceptual errors. Subanalysis of conceptual errors showed significantly fewer errors in misrepresentation of time, in FTD patients compared to the AD group. No difference in misrepresentation of clock face was found between the groups.
Subanalysis of spatial or planning errors showed significantly more errors in the spatial layout
Controls (n=20) Alzheimer's (n=22) Immediate testing
Old associations
New associations 0
10 20 30 40 50 60 70
Mean % errors
5-min delay Old associations
New associations
11
of numbers and numbers outside the clock, in AD patients compared to the FTD group. There was no difference between the groups in neglect of the left hemisphere, gaps before 12, 3, 6, and 9, and numbers arranged counter-clockwise. The control group made significantly less errors in graphic difficulty, fewer stimulus-bound responses, conceptual deficits, and spatial or planning errors compared to both FTD and AD patients. The AD group also made more perseverative errors compared to the control group. Overall, both quantitative and qualitative analyses of CDT differentiated between AD and FTD at the group level.
Figure 5. Percentage of control individuals (n=25) and FTD (n=36) and AD (n=25) patients making different kinds of qualitative errors.
Conclusions
One of the most important questions in clinical neuroscience and neuropsychology is whether it is possible to selectively assess certain cognitive function and whether these functions can be disrupted in a circumscribed manner in neuropsychiatric diseases. This is the issue of domain specificity vs. non-specificity and selective vs. generalized cognitive deficits.
In the first part of our experiments, we investigated feedback-guided learning of stimulus-response associations in PD and AD emphasizing three putatively specific functions:
(i) effect of positive vs. negative feedback, (ii) generalization of associations (acquired equivalence), and (iii) flexibility of stimulus-response association. In the second part of the experiments, we investigated how CDT, a widely used classic neuropsychological test, is able to separate different cognitive domains (visuospatial functions, verbal comprehension, and executive functions) and how it can be used for the differentiation of AD and FTD.
Regarding positive vs. negative feedback (reward vs. punishment) we found a convincing dissociation: PD patients showed reward learning deficit and intact punishment learning, which was reversed by pharmacological manipulation. Stimulus-response learning
12
and generalization were also dissociated; moreover, in patients with AD the retrieval of successfully learned stimulus-response associations was impaired in a context requiring cognitive flexibility. However, in the case of CDT domain specificity was not clear: this test includes many overlapping cognitive functions that can be separated only partly by scoring different types of errors.
The main conclusion is that novel neuropsychological tools must be more carefully designed, taking into consideration recent advances in cognitive neuroscience. The stimulus- response learning paradigms introduced in this thesis might represent good examples for such developments. We propose that by the application of these novel methods in clinical practice, domain-specific alterations can be detected in early phases of neuropsychiatric disorders, which may facilitate timely and objective diagnosis and help avoid delays in treatment administration.
List of own publications related to the thesis
1. Bódi N, Kéri S, Nagy H, Moustafa A, Myers CE, Daw N, Dibó G, Takáts A, Bereczki D, Gluck MA. Reward-learning and the novelty-seeking personality: a between- and within- subjects study of the effects of dopamine agonists on young Parkinson's patients. Brain. 2009 Sep;132(Pt 9):2385-95.
2. Bódi N, Csibri E, Myers CE, Gluck MA, Kéri S. Associative learning, acquired equivalence, and flexible generalization of knowledge in mild Alzheimer disease. Cogn Behav Neurol. 2009 Jun;22(2):89-94.
3. Blair M, Kertesz A, McMonagle P, Davidson W, Bodi N. Quantitative and qualitative analyses of clock drawing in frontotemporal dementia and Alzheimer's disease. J Int Neuropsychol Soc. 2006 Mar;12(2):159-65.
List of own publications independent of the thesis
1: Seres I, Unoka Z, Bódi N, Aspán N, Kéri S. The neuropsychology of borderline personality disorder: relationship with clinical dimensions and comparison with other personality disorders. J Pers Disord. 2009 Dec;23(6):555-62.
2: Unoka Z, Seres I, Aspán N, Bódi N, Kéri S. Trust game reveals restricted interpersonal transactions in patients with borderline personality disorder. J Pers Disord. 2009 Aug;23(4):399-409.
13
3: Vincze G, Almos P, Boda K, Döme P, Bódi N, Szlávik G, Maglóczki E, Pákáski M, Janka Z, Kálmán J. Risk factors of cognitive decline in residential care in Hungary. Int J Geriatr Psychiatry. 2007 Dec;22(12):1208-16.
4: Must A, Szabó Z, Bódi N, Szász A, Janka Z, Kéri S. Neuropsychological assessment of the prefrontal cortex in major depressive disorder. Psychiatr Hung. 2005;20(6):412-6. Hungarian.
5: Must A, Szabó Z, Bódi N, Szász A, Janka Z, Kéri S. Sensitivity to reward and punishment and the prefrontal cortex in major depression. J Affect Disord. 2006 Feb;90(2-3):209-15.
Epub 2006 Jan 10.
6: Juhász A, Rimanóczy A, Boda K, Vincze G, Szlávik G, Zana M, Bjelik A, Pákáski M, Bódi N, Palotás A, Janka Z, Kálmán J. CYP46 T/C polymorphism is not associated with Alzheimer's dementia in a population from Hungary. Neurochem Res. 2005 Aug;30(8):943-8.
7: Galariotis V, Bódi N, Janka Z, Kálmán J. Frontotemporal dementia--part III. Clinical diagnosis and treatment. Ideggyogy Sz. 2005 Sep 20;58(9-10):292-7. Review.
8: Juhász A, Palotás A, Janka Z, Rimanóczy A, Palotás M, Bódi N, Boda K, Zana M, Vincze G, Kálmán J. ApoE -491A/T promoter polymorphism is not an independent risk factor, but associated with the epsilon4 allele in Hungarian Alzheimer's dementia population.
Neurochem Res. 2005 May;30(5):591-6.
9: Galariotis V, Bódi N, Janka Z, Kálmán J. Frontotemporal dementia--Part II. Differential diagnosis, genetics, molecular pathomechanism and pathology. Ideggyogy Sz. 2005 Jul 20;58(7-8):220-4. Review.
10: Galariotis V, Bódi N, Janka Z, Kálmán J. Frontotemporal dementia--Part I. History, prevalence, clinical forms. Ideggyogy Sz. 2005 May 20;58(5-6):164-71. Review.
11: Fehér LZ, Kálmán J, Puskás LG, Gyülvészi G, Kitajka K, Penke B, Palotás M,Samarova EI, Molnár J, Zvara A, Matin K, Bódi N, Hugyecz M, Pákáski M, Bjelik A, Juhász A, Bogáts G, Janka Z, Palotás A. Impact of haloperidol and risperidone on gene expression profile in the rat cortex. Neurochem Int. 2005 Sep;47(4):271-80.
12: Kálmán J, Palotás A, Bódi N, Kincses TZ, Benedek G, Janka Z, Antal A. Lactate infusion fails to improve semantic categorization in Alzheimer's disease. Brain Res Bull. 2005 May 30;65(6):533-9.
13: Bódi N, Hegedűs Z, Rudas L, Zöllei É, Csanády M, Csanádi Z: “Twiddler’s- szindróma”
implantábilis cardioverter defibrillator beültetés után. Card Hung 2004; 34:201-204.