(PGs) and non-problem gamblers (N-PGs). This quasi-experiment investigated the occurrence in both groups of a widespread cognitive distortion, the gambler’s fallacy (GF), using afictitious roulette game. Moreover, it investigated whether the GF increased the bet amount and whether impulsivity and sensation seeking were associated with the GF.
Methods:Two indices of the GF were used: a cognitive index, the probability estimate of each outcome (black/red) after manipulating thefinal run length (the same outcome occurring four times/once), and a behavioral index, the choice of the outcome on which to bet. A total of 320 (160 PGs and 160 N-PGs) unpaid male volunteers, aged between 18 and 68, participated in this study.Hypotheses:Erroneous probability estimates should mediate the effect of longer runs on the alternation choice (i.e., the choice of an outcome different from the previous one) to support the occurrence of GF. The GF should increase betting. PGs should be more prone than N-PGs to GF.Results:The choice of the outcome depended on both cognitive (erroneous probability estimates) and affective (preference for red) factors. PGs bet more than N-PGs but they were not more prone than N-PGs to incurring GF. Although impulsivity and sensation seeking were more intense in PGs than in N-PGs, they scarcely affected GF. Discussion and conclusions:Overall, our results corroborate the tested model of the GF that links mistaken probability estimates, choice of the outcome on which to bet, and bet amount. However, they are similar to PGs and N-PGs and fail to corroborate the hypothesis that the GF is more evident in PGs.
Keywords:gambler’s fallacy, problem gamblers/non-problem gamblers, bet amount, impulsivity, sensation seeking
INTRODUCTION
The cognitive approach to problem or pathological gam- bling [Even if the name Pathological Gambling used in DSM-IV (1994) has been changed to Gambling Disorder in DSM-5 (2013), we think that the large category of“problem gambling”we have used in the text is compatible with the DSM-5 definition of Gambling Disorder as“Persistent and recurrent problematic gambling behavior leading to clini- cally significant impairment or distress [....]”] posits a strong association between the development and mainte- nance of this behavior and gambling-related cognitive dis- tortions, such as an incorrect perception of randomness and erroneous probability estimates (Clark, 2010; Goodie
& Fortune, 2013; Goodie, Fortune, & Shotwell, 2019;
Ladouceur & Walker, 1996). Although the literature about judgment and decision-making has demonstrated that human beings are generally prone to cognitive distortions when making decisions (Kahneman & Tversky, 1972;
Tversky & Kahneman, 1974), several studies have found that, compared to non-problem gamblers (N-PGs), problem gamblers (PGs) are more likely to incur cognitive biases (Barrault & Varescon, 2013;Ciccarelli, Griffiths, Nigro, &
Cosenza, 2017; Cosenza & Nigro, 2015; Cunningham, Hodgins, & Toneatto, 2014; Fortune & Goodie, 2012;
Joukhador, MacCallum, & Blaszczynski, 2003; Lambos
& Delfabbro, 2007; Mathieu, Barrault, Brunault, &
Varescon, 2018; Navas, Verdejo-Garcia, Lopez-Gomez, Maldonado, & Perales, 2016;Romo et al., 2016;Toneatto, Blitz-Miller, Calderwood, Dragonetti, & Tsanos, 1997;
Toneatto & Millar, 2004; Wohl, Young, & Hart, 2007).
Actually, such a conclusion stems from studies using mostly self-report instruments, such as the Gambling Attitudes and Beliefs Survey (Breen & Zuckerman, 1999), the Gambling Belief Questionnaires 1 (Steenbergh, Meyers, May, &
Whelan, 2002) and 2 (Joukhador et al., 2003) or the Gambling-Related Cognitions Scale (GRCS; Raylu & Oei, 2004). Overall, the results showed that PGs tend to score higher than N-PGs, and/or that higher scores on these measures correlate with increasing PG severity (for a review, see Goodie & Fortune, 2013). However, a quite
* Corresponding author: Olimpia Matarazzo; Department of Psychology, University of Campania “Luigi Vanvitelli”, Viale Ellittico, 31 –81100 Caserta, Italy; Phone: +39 823 275 379;
Fax: +39 823 323 000; E-mail:olimpia.matarazzo@unicampania.it This is an open-access article distributed under the terms of theCreative Commons Attribution-NonCommercial 4.0 International License, which permits unrestricted use, distribution, and reproduction in any medium for non-commercial purposes, provided the original author and source are credited, a link to the CC License is provided, and changes–if any–are indicated.
recent review (Leonard, Williams, & Vokey, 2015; see also Goodie et al., 2019) highlighted that the comprehensive measure instruments are generally based on an overly exten- sive conception of cognitive distortions, such that they conjunctly assess behavioral, motivational, emotional, and cognitive gambling-related factors. In this way, content validity may be undermined. Moreover, behavioral or exper- imental studies comparing PGs and N-PGs are lacking or very few (e.g., Dixon, Wilson, & Habib, 2014;Gaissmaier et al., 2016;Marmurek, Switzer, & D’Alvise, 2015).
Similar considerations can also be made for the line of research investigating the relationship between personality factors–in particular, impulsivity and sensation seeking– cognitive distortions and PG. Several studies (e.g.,Chiu &
Storm, 2010;Ledgerwood, Alessi, Phoenix, & Petry, 2009) have found higher levels of impulsivity in PGs compared with N-PGs, whereas the results about sensation seeking are heterogeneous (e.g.,Bonnaire, Bungener, & Varescon, 2017;
Gupta, Derevensky, & Ellenbogen, 2006;Parke, Griffiths, &
Irwing, 2004; for a review, see MacLaren, Fugelsang, Harrigan, & Dixon, 2011). However, an increasing number of authors (e.g.,Cyders & Smith, 2008;Megías et al., 2018;
Sharma, Markon, & Clark, 2014) tend to consider impul- sivity as a multidimensional construct encompassing sensation seeking and associated with several problematic behaviors, including compulsive gambling (see the meta- analysis of Sharma et al., 2014). Finally, other studies (Gaissmaier et al., 2016; Michalczuk, Bowden-Jones, Verdejo-Garcia, & Clark, 2011) have found an association between impulsivity and gambling distortions in PGs and have shown that both constructs are significant predictors of gambling severity. In this study, we have considered impulsivity and sensation seeking as two similar but separate constructs and thus have used two different measures to assess them.
This study investigates the putative differences between PGs and N-PGs in their proneness to the gambler’s fallacy (GF), one of the most robust and well-known gambling- related cognitive distortions (seeLaplace, 1814for itsfirst description). Specifically, the GF is the mistaken belief that a random binary sequence (e.g., heads or tails in a“flip of a coin”) exhibiting the same outcome consecutively will be interrupted by the opposite outcome (negative recency), without considering the mutual independence of random events. The classical explication of this phenomenon refers to the law of small numbers (Tversky & Kahneman, 1971) and the representativeness heuristic (Kahneman & Tversky, 1972;Rabin, 2002). According to these assumptions, people tend to believe that a random sequence has the same features not only globally but also locally. Therefore, a short random sequence should be analogous to (i.e., representative of) longer random sequences. Therefore, since a run of identical outcomes is not representative of naive conceptions of randomness (postulating quite a balanced alternation of opposite events;Wagenaar, 1972), people tend to conclude that an opposite outcome will occur in the future to balance the sequence.
Empirical evidence for the GF mainly comes from experimental or behavioral studies investigating its occurrence in N-PGs rather than in PGs (e.g., Ayton &
Fischer, 2004;Boynton, 2003;Braga, Ferreira, & Sherman,
2013; Burns & Corpus, 2004; Lyons, Weeks, & Elliott, 2013;Navarrete & Santamaria, 2012;Roney & Trick, 2003;
Studer, Limbrick-Oldfield, & Clark, 2015;Xue et al., 2012) or from field studies on casinos (Croson & Sundali, 2005;
Sundali & Croson, 2006), lotteries (Clotfelter & Cook, 1991; Suetens, Galbo-Jørgensen, & Tyran, 2016), horse races (Terrell, 1994), or population samples (Dohmen, Falk, Huffman, Marklein, & Sunde, 2009; Doidge, Feng,
& Hennessy, 2019), which did not distinguish between the two groups. Finally, a few studies (e.g., Clark, Studer, Bruss, Tranel, & Bechara, 2014) have investigated neural regions underlying gambling-related cognitive distortions, such as GF and near-miss, in both patients with focal brain lesions and healthy individuals.
Overall, these studies employed the “what’s next?” paradigm (Oskarsson, Boven, Mcclelland, & Hastie, 2009), in which participants predict (and/or bet on) the next outcome after a sequence of binary outcomes of different length, and sometimes indicate their confidence degree in their prediction or specify the bet amount. In such a paradigm, the probability overestimation of the predicted outcome is implicitly assumed. Only a few studies (Burns & Corpus, 2004;Caruso, Waytz, & Epley, 2010; Dohmen et al., 2009; Matarazzo, Carpentieri, Greco, & Pizzini, 2017;Navarrete & Santamaria, 2012) used a procedure where participants had to indicate, in addition to the outcome prediction, the explicit probabili- ty estimate of the next outcome.
Generally, these studies documented people’s proneness to GF, and those also investigating betting behavior found that GF was associated with a higher bet amount (e.g., Clotfelter & Cook, 1991; Croson & Sundali, 2005;
Roney & Trick, 2003; Studer et al., 2015; Suetens et al., 2016;Terrell, 1994).
Concerning the difference between PGs and N-PGs in their proneness to GF, we have already said that the occur- rence of this fallacy has been mainly assessed through correlational studies using self-report instruments aimed at examining a wide range of cognitive distortions. From the meta-analyses conducted by Goodie and Fortune (2013), it emerged that GF was“consistently”associated with a robust effect size with PG. A more recent study by Donati et al.
(2018) assessed the probability to fall into the GF by means of a specific task, and found that higher susceptibility to the GF and higher superstitious thinking fuel PG in male adolescents through the mediation of other cognitive dis- tortions. Opposite results emerged from the study of Marmurek et al. (2015), in which GF was experimentally tested in the frame of a larger investigation on the relation- ship between impulsivity and gambling cognitions in PG and N-PG undergraduates. A behavioral measure of GF was obtained through a game with a simulated two-color roulette wheel by computing the number of bets on the color opposite to the previous one in different-length series of consecutive identical outcomes. PGs and N-PGs scored differently on GRCS and on the Impulsivity scale (Cyders et al., 2007), but did not differ in terms of GF.
Previously, Lambos and Delfabbro (2007), in a study assessing irrational beliefs and numerical reasoning ability in occasional, regular, and pathological poker machine players, found that although pathological gamblers were
in line with a similarfinding that emerged in the study of Matarazzo et al. (2017) on N-PGs. In addition, we aimed at investigating whether GF increased the bet amount. If GF depends on an erroneous probability estimate and if this false belief fuels betting, then overestimating the probability of an alternative outcome, choosing to bet on it, and increasing the bet amount should be causally related. Note that such assumptions underline the hypoth- esis that a cognitive distortion like the GF is responsible for the genesis and the maintenance of PG. Consequently, according to this hypothesis, the aforementioned paths should be more prominent in PGs than in N-PGs. More- over, we should find a more pronounced association between impulsivity, sensation seeking, and GF in PGs than in N-PGs.
METHODS
Design
The study had a 2×2×2 design, with three between- subject variables. Two variables were manipulated in a fictitious American roulette game, with the wheel having only two colors (red and black):run length,indicating how many times the same color occurred in thefinal part of the run (4 times vs. 1 time) andfinal color, indicating the slot on which the ball landed in the last throw(s) (red vs. black). The third variable was gambling status (PGs vs. N-PGs). The dependent variables (DVs) were the probability estimates of both possible outcomes of the next ball throw (same-color slot and opposite-color slot), the choice of the color on which to bet, and the bet amount. The scores on impulsivity and sensation seeking were included in the design as covariates.
Participants
Three hundred twenty (160 PGs and 160 N-PGs) unpaid male volunteers (N=40 for each condition), living in Campania (Italy) and aged between 18 and 68 years (M=34; SD=10.451), participated in this study. PGs were recruited in different Gambling Addiction Services (GAS), i.e., psychiatric and psychological centers specifi- cally devoted to the diagnosis and treatment of gambling addiction, with the collaboration of the health personnel.
the aim of rejecting participants having high SOGS scores from the N-PG group. In accordance with the literature (Capitanucci & Carlevaro, 2004; Guerreschi & Gander, 2000, who report personal communication from H.
Lesieur), a cut-off of 2 was used. More precisely, of 160 N-PGs, 102 (63.8%) scored 0, 42 (26.3%) scored 1, and 16 (10%) scored 2. The main gambling activities performed more than once a week by PGs were sports betting (53%), slot machines and video lottery terminals (VLTs; 26%), cards games for money (11%), and lotteries (10%), whereas bingo (4%), casino (4%), and horse racing (3%) were less frequent activities. The gambling activities performed more than once a week by N-PGs were: sports betting (15.7%), and cards, slot machines, and VLTs, each of them with a percentage of 1.3%. However, the majority of N-PGs simply did not gamble. This information was acquired through the first item of the SOGS, as the GAS cannot provide it to respect client privacy. A financial incentive was deliberately excluded for ethical and theo- retical reasons. No GAS would give consent to use money with PGs. Moreover, although the use of a monetary incentive is widely diffused in the literature on decision- making, and more generally in the literature employing decision tasks (see, e.g., Ayton & Fischer, 2004;
Marmurek et al., 2015; Studer et al., 2015), some works in the field of cognitive economics or psychology (e.g., Kühberger, 2001; Read, 2005) point out that the presence of economic incentives is not necessary and may even be detrimental to evaluate how people behave in hypothetical contexts. Furthermore, some studies with PGs (e.g.,Linnet et al., 2012), although compensating partici- pants for their time, did not allow them to wager money.
Finally, other studies (e.g., Clark et al., 2014) do not mention any monetary payment.
All participants took part in two other studies in addition to the present one. The order of the studies was counter- balanced across subjects. All participants completed all three studies.
Determination of sample size
To estimate the sample size necessary to test the hypotheses of this study, we conducted an a prioripower analysis for ANCOVA to be performed on probability estimates of both possible roulette outcomes using G*Power 3 (Faul, Erdfelder, Lang, & Buchner, 2007). We chose to detect a medium effect
size (f=0.25) and to achieve a power (1−β) of 0.98 withα error probability of 0.01. On request of a reviewer, we specify that the choice of a medium effect size was based on the results of previous related research, i.e. the experimental or behavioral studies which had investigated the gambler’s fallacy in PGs and N-PGs (Dixon et al., 2014; Gaissmaier et al., 2016;Marmurek et al., 2015) and those investigating the GF in N-PGs and reporting the effect size values from which to compute Cohen’sf(e.g.,Boynton, 2003;Matarazzo et al., 2017;Studer et al., 2015). Since most of these studies had a large or medium effect size and only one study had a small effect size (f=0.16), we chose a medium effect size. In conformity with the selected parameters, we would have needed 347 total participants.
However, due to GAS availability and time restrictions, we were only able to collect data from 160 PGs. Conse- quently, to equalize the size of the two groups, we recruited the same number of N-PGs. Thus, our total sample was of 320 participants. Once we had collected the data, we performed somepost-hocpower analyses to check whether the real sample size was compatible with an adequate statistical power to reject a false null hypothesis (Faul et al., 2007). For the ANCOVA, using the sample size of 320 participants, the same effect size parameter (f=0.25) and the sameαlevel (f=0.01) as in thea priorianalysis, the statistical power was 0.969. For the moderated mediation analysis on bet, using the same sample size andαlevel, and an a priorimedium population effect size (f2=0.15), the statistical power was 0.994. Thus, this study had high statistical power (Cohen, 1988).
Given that the term“post hocpower analysis”is poten- tially misleading (e.g., Faul et al., 2007; O’Keefe, 2007) because it can be confused with “observed power” or
“retrospective power”analysis, with which it is often used interchangeably, is noteworthy to point out the following clarifications. The post-hoc power analyses (Cohen, 1988),
“like a priori analyses, require an H1effect size specifica- tion for the underlying population” (Faul et al., 2007, p. 176), i.e., an effect size estimated before conducting the study, whereas in the retrospective power analyses “the effect size is estimated from sample data and used to calculate the observed power, a sample estimate of the true power”(Ibid). For this reason, the use of the retrospective power analysis to estimate the statistical power of a study (i.e., the probability that the null hypothesis is rejected, given it is false) is largely criticized (e.g.,Faul et al., 2007;
Hoenig & Heisey, 2001;O’Keefe, 2007).
Measures
South Oaks Gambling Screen (SOGS–Lesieur & Blume, 1987; Italian version:Guerreschi & Gander, 2000).This is a self-report questionnaire comprising 20 questions, which allows one to detect possible gambling problems and to learn some aspects of gamblers’behavior, such as preferred games and their frequency, problematic behavior related to gambling (e.g., chasing, lies, and loss of control), practical consequences of gambling, etc. Scores of 3 or 4 indicate the presence of problem gambling, whereas scores of 5 or more suggest the presence of pathological gambling. Scores below 3 indicate non-problematic gambling.
Barratt Impulsiveness Scale 11 (BIS-11 – Patton, Stanford, & Barratt, 1995; Italian version: Fossati, Di Ceglie, Acquarini, & Barratt, 2001).This is a scale evalu- ating the tendency to impulsivity in three areas: motor impulsivity, impulsivity without planning, and cognitive impulsivity. It consists of 30 items rated on a 4-point Likert scale (ranging from 1=never/rarelyto 4=almost always/
always); the total scores range from 30 to 120.
Brief Sensation Seeking Scale (BSSS; Hoyle, Fejfar, &
Miller, 2000; Italian version: Primi, Narducci, Benedetti, Donati, & Chiesi, 2011). This scale was developed by selecting eight items from the original Sensation Seeking Scale Form V scale of Zuckerman, Kolin, Price, and Zoob (1964), who conceptualized sensation seeking as the search for intense, complex, new and varied experiences and sensations as well as the willingness to assume financial, legal, social, and physical risks for such experiences. The BSSS is a one-dimensional scale consisting of eight items rated on a 5-point Likert scale (ranging from 1=completely disagreeto 5=totally in agreement); the total scores range from 8 to 40.
Pilot study
Before conducting the present experiment, a pilot study with 20 PGs (recruited in betting centers and scoring 5 or more on the SOGS) and 20 N-PGs (recruited in pubs or bars and scoring up to 2 on the SOGS) was carried out to ascertain the effectiveness of the experimental procedure in inducing the GF. The results showed that the procedure was effective and that the participants believed they were playing a real computerized roulette game.
Materials and procedure
The study was implemented with the online survey tool Survey Monkey (which allowed to support a Graphics Interchange Format image of a rotating roulette wheel with a ball on the inside ball track), but was performed offline and individually, in appropriate rooms provided by the GAS for all participants. The general instructions informed partici- pants that they would observe some rounds in a computer- ized roulette game. The roulette wheel was created ad hoc with only two colors: red and black. For each round, the screen displayed a rotating roulette wheel, followed by the outcome: “The ball landed on a red (or black) slot.” Figure1shows an example of a round. Four experimental conditions were obtained by crossing the run length (once or the same outcome four times) with the color of the last displayed outcome (red or black). Two conditions were supposed to induce GF, whereas the other two worked as control conditions. The GF-inducing sequences displayed the same outcome for the last four rounds, with the ball landing on a red or black slot four consecutive times.
Control sequences ended with one red or black outcome, different with the color displayed in the previous round. All sequences were constructed in such a way to seem repre- sentative of randomly generated sequences. They are reported in Figure 2. Note that building two different sequences based on color aimed to disentangle a potential color preference from GF.
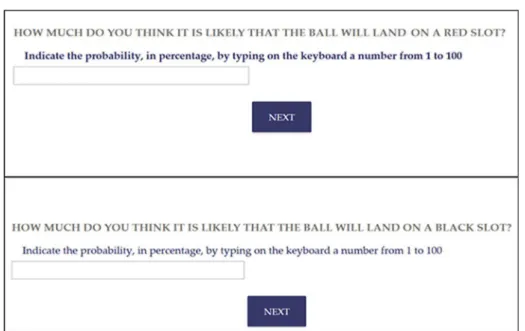
After 12 rounds, participants were informed that they had 20 tokens to bet on the next round. Before betting, they had to indicate the probability of the ball landing on a red slot and that of the ball landing on a black slot, on a scale from 1 to 100. The order of the two questions was counterbalanced across participants (Figure 3). Later, participants had to
choose the slot color on which to bet and indicate the bet amount, from 1 to 10 tokens.
It may be worth specifying that the procedure of asking all participants to estimate the outcomes’probability before the bet choice without counterbalancing the questions’order was justified by the results of a previous study (Matarazzo et al., 2017). In this article, we conducted two experiments, in the first of which choice preceded probability estimates, whereas in the second, the questions’order was inverted.
The results were analogous in both studies. Therefore, in this study, we decided to use only one procedure, i.e., the one in which the probability estimates preceded the choice, to avoid too many variables in the design.
It should also be noted that requiring the probability estimates of both outcomes was intended to prevent parti- cipants focusing only on one outcome and to examine whether they interpreted the two probabilities as indepen- dent or complementary. In the latter case, their sum would be 1, in the former, it would not.
Figure 1.Example of a round. This consisted of two screens: thefirst one displayed a graphics interchange format of a rotating roulette wheel;
the second one displayed one of the two possible outcomes of the throw
Figure 2.Sequences of the 12 outcomes as a function of study conditions (B: black; R: red)
Figure 3.Screens displaying the probability questions. Their order of appearance was counterbalanced
At the end of the experimental sessions (i.e., at the end of the three studies in which they took part), participants were administered the BIS-11 (Patton et al., 1995; Italian adapta- tion:Fossati et al., 2001) and the BSSS (Hoyle et al., 2000;
Italian adaptation:Primi et al., 2011) in a counterbalanced order. Afterward, they completed the SOGS. Finally, they were debriefed and thanked for their participation. The post- experimental questions confirmed that participants did not suspect that the roulette sequences had been manipulated.
Statistical analyses
All data analyses were conducted using SPSS 18.0 IBM software (Armonk, NY, USA). All variables were initially screened for missing data, distribution abnormalities, and outliers (Tabachnick & Fidell, 2013). To ascertain whether participants in the eight conditions differed in terms of age and education, two ANOVAs were performed. To examine whether participants differed on the two personality scales, the BSSS and BIS-11, a MANOVA was conducted.
To test the hypotheses underlying this study, we first performed a 2×2×2 between-subject ANCOVA to inves- tigate whether the independent variables (IVs), run length (4 times vs.1 time with the samefinal color),final color(red vs. black), and gambling status(N-PGs vs. PGs) affected, singularly or in interaction, theprobability estimateof each of the next two outcomes. The scores on BIS-11 and BSSS and their interaction withgambling statuswere included as covariates. Sinceprobability estimatewas a repeated mea- sure, we calculated a unique variable, delta (Δ)probability, by subtracting the red probability values from the black ones (Montoya & Hayes, 2017).
Then, two moderated mediation analyses were con- ducted. Note that such type of analysis (Hayes, 2018;
Muller, Judd, & Yzerbyt, 2005) examines whether the putative effect of the IV on the DV is exerted through intervening variable(s)–Mediator(s)–and whether such a mediated effect differs as a function of the values of other variable(s) included in the design –Moderator(s) –which are supposed to affect the relationship between IV, Media- tor(s), and DV.
Thefirst moderated mediation analysis examined whether the putative effect ofrun lengthon thechoiceof the outcome on which to bet was mediated byΔprobabilityand moder- ated by final colorandgambling status.The second exam- ined the same putative effects on bet amount, adding the interaction between probability estimate and choice as a second mediator. In both analyses, BSSS and BIS-11 scores and their interactions withgambling statuswere included in the models as covariates. To diminish multicollinearity with the interaction terms, the two continuous variables were centered by subtracting the mean value of each variable from each individual score (Aiken & West, 1991). Both moderated mediation analyses were conducted using the PROCESS macro for SPSS 3.1 (Hayes, 2018), which allows 92 different models of moderation, mediation, and moderated mediation analyses to be tested. To estimate conditional indirect effects – i.e., the effects of IV on DV through mediating variables at different values of moderators – the macro adopts the bootstrapping method: 5,000 bootstrap samples
were used to calculate bias-corrected confidence intervals (at a 95% confidence level).
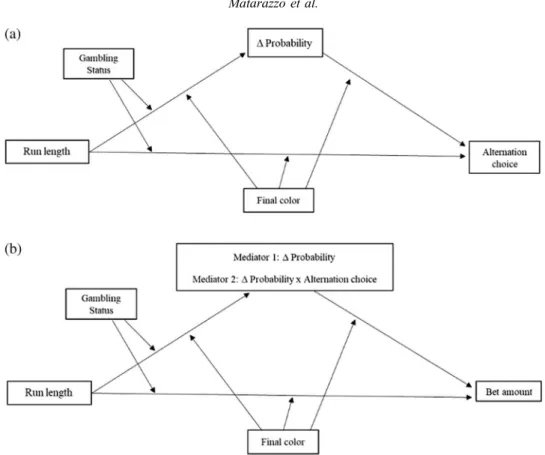
The moderated mediation analysis on the choiceof the outcome to bet on was performed using model 63 of the PROCESS macro (see Figure4a). The IV,run length,and the two moderators (Mods),final color and gambling status, were coded as dummy variables (run length: 1=4 times the samefinal color, 0=1 time;final color: 1=black, 0=red;
gambling status: 1=PGs, 0=N-PGs). Also the DV, choice of the color on which to bet,was coded as a dummy variable (1=opposite to the final color, henceforth alternation choice, 0=same as thefinal color).
In this model,run lengthwas supposed to affect, singu- larly or in interaction withgambling status,both the medi- ator (Δprobability)and the DV (alternation choice), while final color was supposed to moderate the relationships between IV and mediator, IV and DV, and mediator and DV. Concerning the latter, alternation choice should in- crease as a direct function ofΔprobability(black probabil- ities minus red probabilities) when final color was red, whereas the opposite effect should occur whenfinal color was black: in this case, the decrease ofΔprobabilityshould increase alternation choice.
The second moderated mediation analysis was performed on bet amount, again using model 63. The tested effects were the same as in the previous analysis, but the interaction betweenΔprobabilityandalternation choicewas added as a second mediator (Figure 4b).
Finally, to investigate whether participants interpreted black and red probabilities as complementary with or inde- pendent from each other, threeχ2tests were conducted on the following variables: (a) frequency of cases whose sum as a percentage was 100 (i.e., the two probabilities were per- ceived as complementary); (b) frequency of cases where each of the two probabilities was 50 (the correct probabilities, a sub-category of the previous group); and (c) frequency of cases whose sum went over or under 100 (the two probabili- ties were perceived as independent from each other).
To examine the “extent to which afinding is reliant on the presence of a covariate” (Simmons, Nelson, &
Simonsohn, 2011, p. 1363), all statistical analyses were conducted also without the covariates.
Ethics
The study procedures were carried out in accordance with the Declaration of Helsinki. The study was approved by the Ethical Committee of the Department of Psychology of the University of Campania“Luigi Vanvitelli.”All participants were informed about the study and all provided informed consent before and after the experimental session.
RESULTS
No missing data or outliers (detectedthrough the Mahala- nobis distance) were found in the data.
In Table1, the distributions of education, age, BSSS, and BIS-11 scores as a function of the study conditions are reported.
The two ANOVAs showed that participants did not differ in age and education (all psns).
The MANOVA showed that PGs scored higher than N-PGs in the BSSS, F1,312=28.62,p<.001, ηp2=0.084, and in the BIS-11,F1,312=90.26,p<.001, ηp
2=0.224.
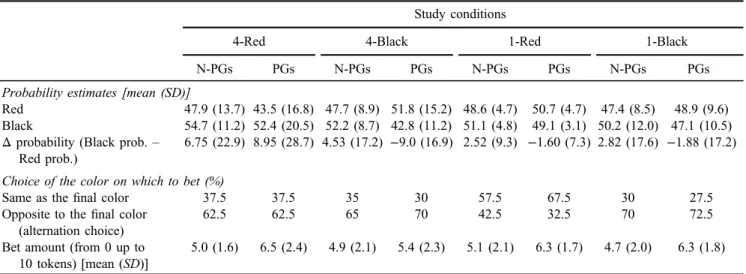
In Table 2, the means and standard deviations of the participants’responses to the DVs–theprobability estimate of each of the next two outcomes, thechoiceof the color on which to bet, and thebet amount–are shown as a function
of the IVs. Moreover, the Δprobabilityvariable,obtained by subtracting the red probability values from the black ones, is also reported: when the value of delta is positive, black probabilities are higher than red probabilities; when the value of delta is negative, red probabilities are higher than black probabilities.
The results of the ANCOVA performed onΔprobability (Table 3) revealed two main effects, final color andgam- bling status as well as three 2-way interaction effects: run Table 1.Descriptive statistics of age, educational level, as well as BSSS and BIS scores of participants as a function of the study conditions
Study conditions
4-Red 4-Black 1-Red 1-Black
N-PGs PGs N-PGs PGs N-PGs PGs N-PGs PGs
Age [mean (SD)] 33.4 (10.0) 34.5 (10.0) 32 (10.3) 33.8 (11.8) 35.8 (11.0) 35.6 (11.0) 34 (9.4) 33.8 (11.8) Educational level (%)–Years of study
Up to 8 46.2 53.8 54.5 45.5 62.5 37.5 50.0 50.0
Up to 13 49.2 50.8 47.5 52.5 49.3 50.7 49.2 50.8
Up to 18 62.5 37.5 62.5 37.5 0 100 57.1 42.9
Brief Sensation Seeking Scale [mean (SD)]
21.1 (5.7) 23.5 (6.1) 20.5 (5.3) 23.4 (5.5) 18.8 (6.0) 22.7 (5.1) 19.2 (5.0) 23.3 (5.4) Barrett Impulsiveness
Scale [mean (SD)]
52.3 (9.4) 61.2 (10.3) 50.9 (8.9) 65.4 (12.3) 49.9 (9.1) 57.1 (10.3) 49 (7.5) 58.1 (7.1)
Note.N-PGs: non-problem gamblers; PGs: problem gamblers; BSSS: Brief Sensation Seeking Scale; BIS: Barratt Impulsiveness Scale 11;
SD: standard deviation; 4-Red: run ending with 4 red slots; 4-Black: run ending with 4 black slots; 1-Red: run ending with 1 red slot; 1-Black:
run ending with 1 black slot.
Figure 4.Diagrams of the tested models using the Macro PROCESS 3.1: (a) Moderated mediation analysis (Model 63) performed on the alternation choice. Run length: independent variable (IV); Gambling status: Moderator (Mod); Final color: Moderator (Mod);Δprobability:
Mediator; Alternation choice: dependent variable. (b) Moderated mediation analysis (Model 63) performed on the bet amount. Run length:
independent variable (IV); Gambling status: Moderator (Mod); Final color: Moderator (Mod);Δprobability: Mediator 1;
Δprobability×alternation choice=Mediator 2; Bet amount=dependent variable
length×final color, final color×gambling status, and BSSS×gambling status.Δprobability(black probability− red probability) increased whenfinal colorwas red, and it was higher in N-PGs than in PGs. These effects were qualified by the run length×final color and gambling status×final color interactions, which were examined through a simple effect analysis. Concerning thefirst inter- action, pairwise comparisons with Bonferroni adjustment revealed that whenrun lengthwas 1 (i.e., thefinal color of the sequence occurred only 1 time), Δprobabilitydid not significantly differ as a function of thefinal color, whereas whenrun lengthwas 4 (i.e. thefinal color of the sequence occurred 4 times),Δprobabilitywas higher whenfinal color was red rather than black (see Figure 5, Graph 1a). With regard to the second interaction, in N-PGs, there was no significant difference inΔprobability as a function of the final color, because black probability was always higher than red probability (Δ probability always had a positive value); instead, in PGs, Δprobabilitydecreased (meaning that red probability was higher than the black one) when the
final color was black rather than red (see Figure5, Graph 1b). The BSSS × gambling status interaction, examined through parameter estimates, revealed that in PGs the increase in BSSS scores entailed an increase inΔprobabil- ity, whereas no significant change was produced in the N-PG group.
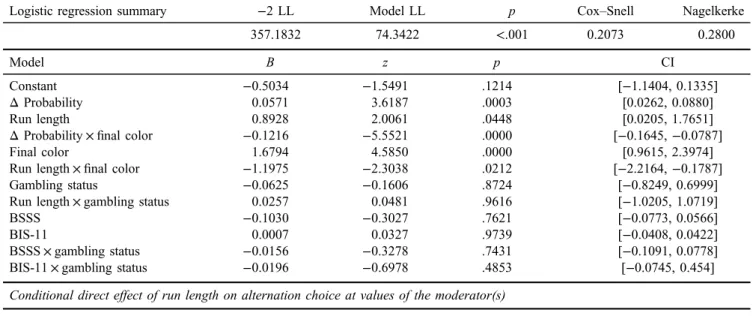
The moderated mediation analysis on choicefirst tested the effect of the IV variables and covariates on the mediator, Δprobability, whose results have been already described in reporting the ANCOVA’sfindings. WhenΔprobabilitywas added to previous variables in the logistic regression equa- tion to examine their effect onalternation choice, the results (Table4) showed thatalternation choicewas predicted by final color, run length, Δ probability, run length×final colorinteraction, andΔprobability×final colorinteraction.
With reference to the intercept, the probability ofalternation choicewas higher for black (coded as 1) than for red (coded as 0) as thefinal colorfor the one-ending sequences, coded as 0 in the dummy variable run length(final coloreffect).
Such a probability increased with four-ending sequences Table 2.Descriptive statistics of probability estimates, choice of the color on which to bet, and bet amount as a function of the
study conditions
Study conditions
4-Red 4-Black 1-Red 1-Black
N-PGs PGs N-PGs PGs N-PGs PGs N-PGs PGs
Probability estimates [mean (SD)]
Red 47.9 (13.7) 43.5 (16.8) 47.7 (8.9) 51.8 (15.2) 48.6 (4.7) 50.7 (4.7) 47.4 (8.5) 48.9 (9.6) Black 54.7 (11.2) 52.4 (20.5) 52.2 (8.7) 42.8 (11.2) 51.1 (4.8) 49.1 (3.1) 50.2 (12.0) 47.1 (10.5) Δprobability (Black prob.–
Red prob.)
6.75 (22.9) 8.95 (28.7) 4.53 (17.2) −9.0 (16.9) 2.52 (9.3) −1.60 (7.3) 2.82 (17.6) −1.88 (17.2) Choice of the color on which to bet (%)
Same as thefinal color 37.5 37.5 35 30 57.5 67.5 30 27.5
Opposite to thefinal color (alternation choice)
62.5 62.5 65 70 42.5 32.5 70 72.5
Bet amount (from 0 up to 10 tokens) [mean (SD)]
5.0 (1.6) 6.5 (2.4) 4.9 (2.1) 5.4 (2.3) 5.1 (2.1) 6.3 (1.7) 4.7 (2.0) 6.3 (1.8)
Note.N-PGs: non-problem gamblers; PGs: problem gamblers;SD: standard deviation; 4-Red: run ending with 4 red slots; 4-Black: run ending with 4 black slots; 1-Red: run ending with 1 red slot; 1-Black: run ending with 1 black slot.
Table 3.Results of the ANCOVA performed onΔprobability (Black prob.–Red prob.)
df F p Partialη2
Corrected model 11 3.581 .000 0.113
Intercept 1 0.223 .637 0.001
BIS 11 1 0.124 .725 0.000
BSSS 1 0.199 .656 0.001
Gambling status 1 10.073 .002 0.032
Final color 1 7.027 .008 0.022
Run length 1 0.618 .432 0.002
BIS 11×gambling status 1 0.405 .525 0.001
BSSS×gambling status 1 5.304 .022 0.017
Final color×gambling status 1 4.874 .028 0.016
Run length×gambling status 1 0.460 .498 0.001
Run length×final color 1 6.341 .012 0.020
Run length×final color×gambling status 1 3.511 .062 0.011
Error 308
Note.BSSS: Brief Sensation Seeking Scale; BIS: Barratt Impulsiveness Scale 11; ANCOVA: analysis of covariance.
compared to one-ending sequences when thefinal color was red (run lengtheffect), whereas it was high and only slightly decreased when thefinal color was black (negative effect of
run length×final colorinteraction; Figure5, Graph 2). An increase of Δ probability produced an increase of the probability of alternation choicewhen the final color was Figure 5.Interaction effects from statistical analyses. Graphs 1a and 1b–Interaction effects from ANCOVA onΔprobability:run length×final color(Graph 1a) andfinal color×gambling status(Graph 1b). Graph 2 and 3–Interaction effects from moderated mediation analysis on choice of the color on which to bet:run length×final color(Graph 2) andΔprobability×final color (Graph 3). Graph 4– Interaction effect from moderated mediation analysis on Bet amount:Δprobability×choice×final color. Means are estimated as a function
of the covariates
red (Δprobabilityeffect), whereas it produced a decrease when thefinal color was black (Δprobability×final color interaction effect; Figure 5, Graph 3).
The conditional direct effect ofrun lengthon the proba- bility ofalternation choice, which was moderated byfinal color, was the same for both PGs and N-PGs. Instead, the conditional indirect effect of run length through Δproba- bility was moderated not only by final color but also by gambling status: it was significant only for the red color and the N-PG group (Table4). Thus, in N-PGs, whenrun length ended with 4 red, Δ probability increased, and such an increase produced an increase in alternation choice.
The results of the moderated mediation analysis on bet amount (Table5) revealed that bet amount was predicted by gambling status,Δprobability,Δprobability×alterna- tion choice, andΔ probability×alternation choice×final color interactions. PGs bet more than N-PGs. When Δ probability increased, bet amount decreased with the choice of betting on the same color as the final one (Δ probability effect) and increased with alternation choice (Δ probability×alternation choice effect). This effect was further moderated by the final color: when it was red, the alternation choice produced an increase in the bet amount
as a function of the increase ofΔprobability, whereas the choice of betting on the same outcome produced the opposite effect; whenfinal color was black, both types of choice produced a decrease in the bet amount with an increase ofΔprobability (Figure5, Graph 4). Run length exerted conditional indirect effects on bet amount through both mediators:Δprobability andΔprobability×choice.
The first indirect effect was moderated byfinal color and gambling status, being significant only with N-PGs and whenfinal color was red. The second one was moderated only byfinal color and was significant in both groups when final color was red.
All analyses, performed without covariates, gave analo- gous results.
Finally, the threeχ2tests performed on the participants’ conception of the two probabilities, crossing the four manipulated conditions with gambling status, revealed no significant effects of the study conditions (allpsns). It is noteworthy that 263 of the 320 participants (82.18%) considered the two probabilities as complementary (and 173, i.e., 54%, evaluated them correctly), while the remaining 57 (17.81%) considered the two probabilities as reciprocally independent.
Table 4.Results of the moderated mediation analysis (Model 63–see Figure4a) testing the effects of run length (IV), Δprobability (mediator),final color and gambling status (moderators), BSSS, BIS-11, BSSS×gambling status, and BIS-11×gambling
status (covariates) on alternation choice
Logistic regression summary −2 LL Model LL p Cox–Snell Nagelkerke
357.1832 74.3422 <.001 0.2073 0.2800
Model B z p CI
Constant −0.5034 −1.5491 .1214 [−1.1404, 0.1335]
ΔProbability 0.0571 3.6187 .0003 [0.0262, 0.0880]
Run length 0.8928 2.0061 .0448 [0.0205, 1.7651]
ΔProbability×final color −0.1216 −5.5521 .0000 [−0.1645,−0.0787]
Final color 1.6794 4.5850 .0000 [0.9615, 2.3974]
Run length×final color −1.1975 −2.3038 .0212 [−2.2164,−0.1787]
Gambling status −0.0625 −0.1606 .8724 [−0.8249, 0.6999]
Run length×gambling status 0.0257 0.0481 .9616 [−1.0205, 1.0719]
BSSS −0.1030 −0.3027 .7621 [−0.0773, 0.0566]
BIS-11 0.0007 0.0327 .9739 [−0.0408, 0.0422]
BSSS×gambling status −0.0156 −0.3278 .7431 [−0.1091, 0.0778]
BIS-11×gambling status −0.0196 −0.6978 .4853 [−0.0745, 0.454]
Conditional direct effect of run length on alternation choice at values of the moderator(s)
Final color Gambling status Effect p CI
Red Non-problem gamblers .8928 .0457 [0.0205, 1.7651]
Red Problem gamblers .9185 .0391 [0.0496, 1.7875]
Black Non-problem gamblers −.3047 .5074 [−1.2056, 0.5962]
Black Problem gamblers −.2790 .5634 [−1.2255, 0.6674]
Conditional indirect effect(s) of run length throughΔprobability (mediator) on alternation choice at values of moderator(s)
Final color Gambling status Effect CI
Red Non-problem gamblers 0.4673 [0.0488, 1.3982]
Red Problem gamblers 0.3175 [−0.0674, 1.1556]
Black Non-problem gamblers 0.1270 [−0.3476, 0.6961]
Black Problem gamblers 0.2962 [−0.1681, 0.8525]
Note.BSSS: Brief Sensation Seeking Scale; BIS: Barratt Impulsiveness Scale 11; CI: confidence interval; LL: log likelihood.
DISCUSSION
This study investigated the GF in two groups of N-PGs and PGs by means of a computerized behavioral task mimick- ing a roulette game. Specifically, it was examined whether a run of four identical outcomes in the roulette wheel induced the choice of betting on the opposite outcome, and whether such a choice was based on an overestimation of its probability. In addition, we investigated whether the GF was associated with an increase in the bet amount.
Moreover, it was questioned whether PGs were more prone than N-PGs to incurring the GF. In this way, we tested the largely shared assumption that cognitive distortions under- lie the maintenance of PG by focusing on the GF, one of the most widespread distortions and most consistently associated with problem gambling (Goodie & Fortune, 2013). Finally, we examined the role of impulsivity and sensation seeking in proneness to GF.
Two indices of GF were used: a cognitive index, the probability estimate of each roulette spin’s possible out- comes, and a behavioral index, namely the choice of the outcome on which to bet. Such a procedure allowed us to distinguish whether choosing the outcome on which to bet
was based on an overestimation of its probability, according to the cognitive explanation of the GF, or was influenced by a preference for one outcome rather than another.
Our results partially support the tested hypotheses. Re- garding the cognitive index of the GF, even ifΔprobability tended to increase (meaning that black probability was higher than red probability) whenfinal colorwas red, the interaction between run length and final color went in the predicted direction. Indeed, four-ending sequences elicited an increase ofΔprobabilitywhenfinal colorwas red and a decrease until a negative value (meaning that red probability was higher than black probability) when final color was black, in conformity with the assumed overestimation of the opposite outcome probability in the GF. However, no three-way interaction between run length, final color, and gambling statuswas found. The difference between PGs and N-PGs did not concern the magnitude of the overestimation effect, but rather it concerned the groups’ bias toward thefinal color.
Indeed, while N-PGs tended to overestimate black probability irrespective of the color with which the sequences ended, P-Gs tended to overestimate black probability when thefinal color was red and underestimate it when thefinal color was black, irrespective of run length.
Gambling status 1.2011 3.4459 .0006 [0.5152, 1.8870]
Run length×gambling status −0.3454 −0.7325 .4644 [−1.2731, 0.5824]
BSSS −0.0032 −0.1033 .9178 [−0.0635, 0.0571]
BIS-11 0.0272 1.4156 .1579 [−0.0106, 0.0650]
BSSS×gambling status 0.0465 1.0714 .2848 [−0.0389, 0.1320]
BIS-11×gambling status −0.0382 −1.5006 .1345 [−0.0882, 0.0119]
Conditional indirect effect of run length on bet amount throughΔprobability andΔprobability×alternation choice (mediators) and at values of the moderator(s)
Mediator Final color Gambling status Effect CI
ΔProbability Red Non-problem gamblers −0.4360 [−1.0458,−0.0243]
ΔProbability Red Problem gamblers −0.2963 [−0.8120, 0.0699]
ΔProbability Black Non-problem gamblers 0.0239 [−0.0845, 0.2615]
ΔProbability Black Problem gamblers 0.0558 [−0.0930, 0.3189]
ΔProbability×alternation choice Red Non-problem gamblers 0.8421 [0.2492, 1.5980]
ΔProbability×alternation choice Red Problem gamblers 0.5578 [0.0211, 1.2823]
ΔProbability×alternation choice Black Non-problem gamblers 0.0015 [−0.1339, 0.1277]
ΔProbability×alternation choice Black Problem gamblers 0.0060 [−0.2709, 0.2499]
Note.For lack of space, the conditional direct effects of run length at values of the moderators are not reported because all were not significant. CI: confidence interval.
Regarding the behavioral index of the GF, i.e., the alternation choice, the results were again quite complex.
In both PG and N-PG groups, the probability of the alter- nation choice increased with four-ending sequences com- pared to one-ending sequences, but only when thefinal color was red. When it was black, such a probability was always high. The increase of the difference between black and red probability estimates (Δprobability) produced an increase in the probability of the alternation choice when the final color was red, and a decrease when thefinal color was black, in line with the GF. However, it was only for N-PGs thatΔ probability mediated the effect of run length on choice in interaction with the color red. For PGs, the effect of moderated mediation was not significant.
Thesefindings suggest that estimating the probability of next outcomes and choosing the outcome on which to bet are two intertwined, although non-consequential, processes.
Moreover, they somewhat differ between PGs and N-PGs.
Thefirst process was consistent with the supposed tendency to equalize unbalanced sequences of events, as postulated by the classical explanation of the GF (Kahneman & Tversky, 1972; Rabin, 2002; Wagenaar, 1972). Conversely, the choice of the color on which to bet was mainly driven by the preference for the color red rather than black, i.e., by an affective criterion (Zajonc, 1980). However, when a cogni- tive factor, i.e., the unbelievability of a long series with the same outcome interferes with and overcomes the affective criterion, the default choice is reversed. For the sequences ending with black slot(s), affective and cognitive criteria go in the same direction; thus, no evidence for the cognitive mediation of the probability estimate has been found. Such results mirror those of Matarazzo et al. (2017), in which participants (N-PGs) always preferred to bet on high cards rather than on low ones in a card-guessing game, although they reversed their choice, in line with the GF, when the series ended with four high cards [In our previous article (Matarazzo et al., 2017), we speculated that the preference for high cards could depend on the“high is better than low” heuristic. The preference for the red color found in this study could be due to the fact that in the Neapolitan (and more generally in the South Italian) tradition, red is often the color of good luck or apotropaic objects]. Concerning this study, it should be emphasized that the affective and cognitive criteria on which decision-making is based have been brought to light thanks to methodological choices to manip- ulate both run length and final color and to use both a cognitive and a behavioral index for GF. Such choices have also allowed us to show that, in decision-making, cognitive distortion prevailed over preference when the two criteria went in opposite directions. Indeed, the mediation effect of probability overestimation was significant only when the final color was red, i.e., only when cognition-based choice was in contrast with preference-based choice. Nevertheless, this moderated mediation effect emerged only in N-PGs.
Although both groups made analogous choices, PGs were less likely than N-PGs to base their decision on this cogni- tive bias. However, PGs were more influenced than N-PGs by thefinal color when estimating the probability of each of the next two possible outcomes.
With regard to the link between the GF and the bet amount, our results corroborate the model we have tested,
according to which the overestimation of the probability of an alternation outcome and the choice to bet on it increased the bet amount. As expected, we found that Δprobability mediated the effect of run length on the bet amount through the interaction with alternation choice andfinal color. This effect was analogous for both PGs and N-PGs. Unsurpris- ingly, PGs bet more than N-PGs. However, this result does not depend on a higher proneness of PGs to GF. Nor does it depend on the higher levels of impulsivity and sensation seeking that PGs have shown compared to N-PGs. Indeed, these variables scarcely affected the results. The only effect we found was the increase ofΔprobability as a function of the increase of sensation-seeking scores in the PG group. No effects were found either on choice or on the bet amount.
Note that the finding that PGs bet more than N-PGs seems to support the idea that one can avoid using real money to evaluate how people behave in hypothetical contexts (Kühberger, 2001;Read, 2005).
Finally, although the majority of the participants correctly estimated the probability of red and black outcomes, or at least viewed them as complementary, some of them (17.81%) considered the two probabilities as reciprocally independent, regardless of experimental conditions and gambling status.
Overall, our findings are in contrast with prior research (see “Introduction” section) showing that cognitive distor- tions, such as GF, impulsivity, and/or sensation seeking, are powerful predictors of PG. However, as stressed above, the large majority of these studies is correlational in nature and/or use comprehensive measures of cognitive distortions.
Our results are similar to those of the only study (Marmurek et al., 2015), which, to our knowledge, has experimentally investigated the occurrence of the GF in PGs and N-PGs, and which found no difference between the two groups.
They are also analogous to those of Lambos and Delfabbro (2007), showing that pathological poker machine players endorsed more irrational beliefs than regular and infrequent players, but did not differ from the other groups in understanding basic gambling odds.
Limitations and future direction
This study did not investigate other cognitive distortions and only focused on the GF; thus, our results are restrained to this specific fallacy. Moreover, it was based on a convenience sample of PGs and N-PGs. As we specified in the“Partici- pants”section, PGs were recruited from among those asking for assistance from devoted clinical services of Campania region (Southern Italy) and who have a gambling addiction diagnosis from psychiatrists or clinical psychologists. Thus, although our sample encompassed a large age range and all instructional levels and although main gambling activities were represented in it, the absence of probability sampling obliges us to be particularly cautious in generalizing the results of this study. However, our results extend those of the few previous studies going in a similar direction (Lambos
& Delfabbro, 2007;Marmurek et al., 2015).
Even if further research, based on probability sampling and both genders participants, is needed to corroborate these results, at present, they suggest that caution should be taken when assuming that a cognitive distortion such as the GF fuels problem gambling.
of the manuscript. CG prepared thefigures and tables. All authors have approved thefinal version of the manuscript.
Conflict of interest: All authors declare no conflict of interest.
REFERENCES
Aiken, L. S., & West, S. G. (1991).Multiple regression: Testing and interpreting interactions. Thousand Oaks, CA: Sage.
American Psychiatric Association. (1994).Diagnostic and statis- tical manual of mental disorders (4th ed.). Arlington, VA:
American Psychiatric Publishing, Inc.
American Psychiatric Association. (2013).Diagnostic and statis- tical manual of mental disorders (5th ed.). Arlington, VA:
American Psychiatric Publishing, Inc.
Ayton, P., & Fischer, I. (2004). The hot hand and the gambler’s fallacy: Two faces of subjective randomness? Memory &
Cognition, 32(8), 1369–1378. doi:10.3758/BF03206327 Barrault, S., & Varescon, I. (2013). Cognitive distortions, anxiety,
and depression among regular andpathological gambling online poker players.Cyberpsychology, Behavioral, and Social Network, 16(3), 183–188. doi:10.1089/cyber.2012.0150.
Bonnaire, C., Bungener, C., & Varescon, I. (2017). Sensation seeking in a community sample of French gamblers: Compari- son between strategic and non-strategic gamblers.Psychiatry Research, 250,1–9. doi:10.1016/j.psychres.2017.01.057 Boynton, D. M. (2003). Superstitious responding and frequency
matching in the positive bias and gambler’s fallacy effects.
Organizational Behavior and Human Decision Processes, 91(2), 119–127. doi:10.1016/S0749-5978(03)00064-5 Braga, J., Ferreira, M. B., & Sherman, S. J. (2013). Disentangling
availability from representativeness: Gambler’s fallacy under pressure. In C. Andrade, J. Garcia, S. Fernandes, T. Palma, V. H. Silva, & P. Castro (Eds.),Research directions in social and organizational psychology (pp. 109–124). Lisboa, Portugal: Edições Sílabo.
Breen, R. B., & Zuckerman, M. (1999). ‘Chasing’ in gambling behavior: Personality and cognitive determinants.Personality and Individual Differences, 27(6), 1097–1111. doi:10.1016/
S0191-8869(99)00052-5
Burns, B. D., & Corpus, B. (2004). Randomness and inductions from streaks: “Gambler’s fallacy” versus “hot hand”. Psychonomic Bulletin & Review, 11(1), 179–184. doi:10.3758/BF03206480
A comparison between pathological gamblers and healthy controls. Journal of Behavior Therapy and Experimental Psychiatry, 54,204–210. doi:10.1016/j.jbtep.2016.08.012 Clark, L. (2010). Decision-making during gambling: An integra-
tion of cognitive and psychobiological approaches.Philosoph- ical Transactions of the Royal Society B: Biological Sciences, 365(1538), 319–330. doi:10.1098/rstb.2009.0147
Clark, L., Studer, B., Bruss, J., Tranel, D., & Bechara, A. (2014).
Damage to insula abolishes cognitive distortions during simulated gambling. Proceedings of the National Academy of Sciences of the United States of America, 111(16), 6098–6103. doi:10.1073/pnas.1322295111
Clotfelter, C. T., & Cook, P. J. (1991).The gambler’s fallacy in lottery play(NBER Working Papers 3769). Cambridge, MA:
National Bureau of Economic Research, Inc.
Cohen, J. (1988). Statistical power analysis for the behavioral sciences(2nd ed.). Hillsdale, NJ: Lawrence Erlbaum Associates.
Cosenza, M., & Nigro, G. (2015). Wagering the future: Cognitive distortions, impulsivity, delay discounting, and time perspec- tive in adolescent gambling. Journal of Adolescence, 45, 56–66. doi:10.1016/j.adolescence.2015.08.015
Croson, R., & Sundali, J. (2005). The gambler’s fallacy and the hot hand: Empirical data from casinos. Journal of Risk and Uncertainty, 30(3), 195–209. doi:10.1007/s11166-005- 1153-2
Cunningham, J. A., Hodgins, D. C., & Toneatto, T. (2014).
Relating severity of gambling to cognitive distortions in a representative sample of problem gamblers.Journal of Gam- bling Issues, 29(29), 1–6. doi:10.4309/jgi.2014.29.2
Cyders, M. A., & Smith, G. T. (2008). Clarifying the role of personality dispositions in risk for increased gambling behav- ior. Personality and Individual Differences, 45(6), 503–508.
doi:10.1016/j.paid.2008.06.002.
Cyders, M. A., Smith, G. T., Spillane, N. S., Fischer, S., Annus, A. M., & Peterson, C. (2007). Integration of impulsivity and positive mood to predict risky behavior: Development and validation of a measure of positive urgency.Psychologi- cal Assessment, 19(1), 107–118. doi:10.1037/1040-3590.
19.1.107
Dixon, M. R., Wilson, A., & Habib, R. (2014). Neurological correlates of slot machine win size in pathological gamblers.
Behavioural Processes, 104, 108–113. doi:10.1016/j.beproc.
2014.02.007
Dohmen, T., Falk, A., Huffman, D., Marklein, F., & Sunde, U.
(2009). Biased probability judgment: Evidence of incidence and relationship to economic outcomes from a representative