Contributions of the Melanopsin-Expressing Ganglion Cells, Cones, and Rods to the Pupillary Light Response in Obstructive Sleep Apnea
Gloria L. Duque–Chica,
1,2Carolina P. B. Gracitelli,
3Ana L. A. Moura,
1,3Bal´ azs V. Nagy,
1,4Kallene S. Vidal,
1,5Geraldine de Melo,
3Augusto Paranhos Jr,
3Michel B. Cahali,
6and Dora F. Ventura
11Experimental Psychology Department, Institute of Psychology, University of Sao Paulo, Sao Paulo, Brazil
2Department of Psychology, University of Medellin, Medellin, Colombia
3Department of Ophthalmology and Visual Science, Federal University of Sao Paulo, Sao Paulo, Brazil
4Department of Mechatronics, Optics and Engineering Informatics, Budapest University of Technology and Economics, Budapest, Hungary
5Prevent Senior institute, Sao Paulo, Brazil
6Department of Otolaryngology, Hospital das Cl´ınicas, School of Medicine, University of Sao Paulo, Sao Paulo, Brazil
Correspondence: Gloria Liliana Du- que-Chica, Department of Psycholo- gy, University of Medellin, Carrera 87, No. 30–65, Bloque 15-105, Me- dellin 055420, Colombia;
gduquech@gmail.com.
Submitted: February 21, 2019 Accepted: June 14, 2019
Citation: Duque-Chica GL, Gracitelli CPB, Moura ALA, et al. Contributions of the melanopsin-expressing ganglion cells, cones, and rods to the pupillary light response in obstructive sleep apnea.Invest Ophthalmol Vis Sci.
2019;60:3002–3012. https://doi.org/
10.1167/iovs.19-26944
PURPOSE.To investigate the impact of obstructive sleep apnea (OSA) on the contribution of inner and outer retinal photoreceptors to the pupillary light response (PLR).
METHODS.Ninety-three eyes from 27 patients with OSA and 25 healthy controls were tested.
OSA severity was graded according to the apnea-hypopnea index. PLR was measured monocularly with an eye tracker in a Ganzfeld in response to 1-second blue (470 nm) and red (640 nm) flashes at3,2,1, 0, 1, 2, and 2.4 log cd/m2. Peak pupil constriction amplitude, peak latency, and the postillumination pupil response were measured. The Cambridge Colour Test, standard automatic perimetry, spectral domain optical coherence tomography, polysomnography, and the Pittsburgh Sleep Quality Index were used.
RESULTS.OSA patients have a significantly decreased peak pupil constriction amplitude for blue stimuli at3,2,1, 1 log cd/m2and at all red flash luminances (P<0.050), revealing reduction of outer retina contributions to PLR. OSA patients showed reduced peak latency for blue (2, 0, 2, 2.4 log cd/m2) and red stimuli (2, 0 log cd/m2;P<0.040). No significant difference was found in the melanopsin-mediated PLR.
CONCLUSIONS.This study is the first to evaluate the inner and outer retinal contributions to PLR in OSA patients. The results showed that the outer retinal photoreceptor contributions to PLR were affected in moderate and severe OSA patients. In contrast, the inner retina contributions to PLR are preserved.
Keywords: obstructive sleep apnea, pupillary light responses, classical photoreceptors, intrinsically photosensitive retinal ganglion cells, circadian rhythm, retinal nerve fiber layer thickness, visual field defect
O
bstructive sleep apnea (OSA) is a highly prevalent chronic sleep disorder. According to some epidemiologic studies, prevalence of moderate-to-severe OSA varies from 6% to 17% in the general adult population1,2 and reaches a maximum between the fifth and seventh decades.2OSA involves repeated episodes of partial or complete obstruction of the upper airway during sleep,3 associated with a decreased oxyhemoglobin saturation and a consequent arterial hypoxemia and hypercap- nia, repetitive arousals, intrathoracic pressure changes, hypox- ia, endothelial dysfunction, oxidative stress, and activation of systemic inflammation.4–7OSA patients present an autonomic nervous system (ANS) imbalance due to sleep fragmentation, which involves recurrent arousals that can precipitate post- apneic surges in blood pressure and heart rate, which may occur even during wakefulness.8,9 These pathophysiological changes have been associated with increased risk for several systemic and neurodegenerative diseases involving cardiovas- cular, metabolic, neurologic,5,10 Parkinson11 and Alzheimerdisease,12 as well as with some ophthalmic disorders, such glaucoma,13floppy eyelid syndrome,14,15nonarteritic ischemic optic neuropathy,16and retinal vein occlusion.17
The visual system requires large amounts of metabolic energy and the photoreceptor cells demand high oxygen consumption.18 The retina is particularly susceptible to oxidative stress. As a consequence, the deoxygenation and re- oxygenation phenomena associated with apnea may contribute to endothelial injury and compromise the optic nerve integrity and its function.7,19In fact, many studies have reported a strong link between OSA and optic nerve disorders, associated with a decrease of nerve fiber layer (RNFL) thickness.7,19–21 This thinning of the RNFL in OSA may lead to a dysfunction of the retinal ganglion cells (RGC). In fact, a disrupted circadian rhythm and abnormal melatonin secretion pattern in OSA patients have been reported,22–24and it is known that the RGC subpopulation of intrinsically photosensitive ganglion cells (ipRGCs) is involved in circadian photoentrainment and in the
Copyright 2019 The Authors
iovs.arvojournals.orgjISSN: 1552-5783 3002
regulation of melatonin secretion. These RGCs, also known as the third class of photoreceptor,25,26contain the melanopsin photopigment and are known to mediate nonimage-forming visual functions, which include a wide range of responses to light—circadian photoentrainment, sleep regulation, pupillary light response (PLR), and modulation of mood and learn- ing.27–31The possible effects of OSA upon the ipRGCs has not been investigated so far.
The PLR can be used as a noninvasive tool and as an alternative to electroretinography to evaluate retinal and optic nerve functions.32–40It is possible to assess the contribution of outer (rod and cone) and inner (ipRGC) retinal photoreceptors by the characteristics of the response to light stimuli of appropriate wavelengths and intensities for each photosensi- tive cell group.27,33,41–45
The outer retinal contributions to the PLR are responsible for the transient constriction, while the inner retinal contribution mediates the sustained constriction during the return to the baseline pupil amplitude.27–31
Therefore, the goal of this study was to evaluate the contribution of inner and outer retinal photoreceptors to the PLR in patients with moderate and severe OSA and to correlate these findings with parameters of visual function (visual field perimetry, color vision), retinal morphology (optical coher- ence tomography [OCT]) and polysomnography [PSG]).
M
ETHODSStudy Design
This cross-sectional study was designed to investigate the contributions of the inner and outer retina to the PLR in OSA patients. This study was approved by the Brazilian National System for Ethics in Research – SISNEP, Brazil (CAAE:
15172113.0.0000.5561) and conducted in strict adherence to the tenets of the Declaration of Helsinki. Informed written consent was obtained from all study participants.
Subjects
Ninety-three eyes from 27 patients with OSA aging from 37 to 73 years (mean ¼54.28 6 8.89 years, 13 females) and 25 healthy control participants aging from 38 to 74 years (mean¼ 52.60 6 9.13 years, 17 females) were recruited from Department of Otolaryngology of Medical School of the University of Sao Paulo in Brazil. Participants were all those who met the inclusion criteria and did not fit in the exclusion criteria described below. All subjects underwent a complete ophthalmologic evaluation, including a medical history review, best-corrected visual acuity measurement, gonioscopy, slit- lamp biomicroscopy, dilated funduscopic examination using a 78 diopter (D) lens, refraction, intraocular pressure (IOP) measurement, visual field (VF) test mean deviation (MD) by standard automated perimetry (SAP) using the Swedish interactive threshold algorithm (SITA Standard 24–2; Carl Zeiss Meditec, Inc., Dublin, CA, USA), and RNFL thickness evaluated by spectral-domain OCT. All tests were performed within 4- month intervals.
The inclusion criteria were age between 35 and 75 years, best-corrected visual acuity equal to or better than 0.3 logMAR in the study eye, spherical refraction within 6 5.00 D and cylinder refraction within63.00 D, transparent ocular media (lens opacity <1) based on the Lens Opacities Classification System III system,46 a normal VF (defined as a Glaucoma Hemifield Test [GHT] within normal limits and a MD ‡2.0 dB), and an IOP less than 21 mm Hg. On the other hand, the exclusion criteria were concomitant ocular disease, history of ophthalmic surgery, neurologic or psychiatric illness, diabetes,
smoking or alcohol abuse history, use of topical or systemic medication, which could potentially affect the pupillary response.
Only patients diagnosed with moderate or severe OSA were enrolled in the study. OSA severity was graded according to the apnea-hypopnea index (AHI) calculated as the number of events of desaturation and apnea or hypopnea (cessation or decrease in respiratory airflow, respectively) per hour of sleep.
Subjects with an AHI of 15 or more and less than 30 were regarded as having moderate OSA or severe OSA if the AHI 30 or more. AHI and the oxygen desaturation index (ODI), which is the number of times per hour of sleep that the blood’s oxygen level drops by a certain degree from baseline, were used for correlation.
Polysomnography (PSG)
The diagnosis of OSA was based on results of a full night assisted PSG diagnosis at the Sleep Laboratory of the Department of Otolaryngology of the University Hospital
‘‘Hospital das Cl´ınicas’’of Sao Paulo University. PSG assessment
was carried out using the polisomnograph Embla (Embla s4000; Embla Systems, Inc., Broomfield, CO, USA) and data were analyzed using Remlogic 1.3 software (Embla Systems, Inc.). PSG data recording followed the American Academy of Sleep Medicine recommendations4 and included electroen- cephalogram (F4/M1, C4/M1, O2/M1), submental electromyo- g r a m , t i b i a l i s a n t e r i o r m u s c l e e l e c t r o m y o g r a m , electrooculogram (E1/M2, E2/M2), electrocardiogram, airflow (nasal cannula and oronasal thermistor), respiratory effort with thoracic and abdominal inductance plethysmographic belts, pulse oximetry measurements, body position, and snoring intensity. All the sleep tests were manually scored by a certified sleep physician.
The Pittsburgh Sleep Quality Index
Subjective assessment of sleep quality was performed using the Pittsburgh Sleep Quality Index (PSQI).47 Participants were required to complete this questionnaire, which consists of seven subscales with 19 questions that represent the total sleep quality score ranging from 0 to 21, where higher scores indicate worse sleep quality. Patients with a global score equal to 5 or higher were considered poor sleepers.
Rod, Cone, and ipRGC Contributions to the PLR Stimuli consisted of a 1-second blue (470 nm) and red (640 nm) light flashes, generated in a Ganzfeld (Q450; Roland Consult, Brandenburg, Germany), controlled by the A-pattern simulation system (RETI–port; Roland Consult). We use photopic luminance values. The units are given as log cd/m2. Flashes were presented at the following luminances:3,2, 1, 0, 1, 2, 2.4 log cd/m2. Photopic and melanopic weighted
‘‘alpha-opic’’luminance calculated according to Lucas et al.48
are shown in Supplementary Table S1. The Ganzfeld was factory calibrated; we verified this with a Konica Minolta CS- 100A luminance and color meter for the luminance levels (0, 1, 2, 2.4 log cd/m2). For the red and blue flashes, we used specific light-emitting diodes (LEDs) of the Ganzfeld with peak wavelengths at 470 (blue) and 640 nm (red) and full width at half maximum of 26 and 17 nm, respectively. We chose stimulus duration, wavelengths, and luminance based on previous studies.33,35
To evaluate the activity of the ipRGCs, flashes at 470 nm were used with luminance from 1 to 2.4 log phot cd/m2, alternating with flashes at 640 nm (which falls away from the peak of the melanopsin light absorption spectrum). We used
flashes at 470 nm below 0 log cd/m2to isolate mainly the rod contributions to the PLR. The rods mediate the transient PLR phase, particularly at low luminance.25,26,32,33,49,50
However, rods have been recently revealed to respond at low and medium intensity red stimuli,45 and it seems that they contribute at very bright light intensities to circadian photo- entrainment as well.50,51 It is also known that cones have a contribution to the transient PLR phase, especially in response to long wavelength stimuli (640 nm), and high lumi- nance.43,44,52
Procedure
Measurements of the PLR were done with an infrared eye- tracking camera system (View Point, Arrington Research, Scottsdale, AZ, USA) at 60 Hz sample rate of real-time pupil recording. Subjects were dark adapted for 10 minutes. Both eyes were tested monocularly by covering one eye with an eye patch, in a random order. After dark adaption, for each luminance level a red flash was presented followed by a blue flash after the offset recording of the red flash. All flashes were 1 second in duration. Responses to flashes below 0 log cd/m2 were separated by at least 30 seconds of dark adaptation. For the photopic range of luminances 1, 2, 2.4 log cd/m2we used an interstimulus interval of 90 seconds of dark adaptation (Fig.
1). The protocol to evaluate the PLR was performed around either 10:30 AM or 3 PM. To determine if daytime affected the baseline or the ipRGC contributions to PLR53,54a pilot study involving 10 subjects was conducted and the statistical analysis did not show significant differences for the baseline, peak pupil constriction amplitude, and the sustained re- sponse33,41,43(also named the postillumination pupil response [PIPR])52,55,56at 0, 1, 2, and 2.4 log cd/m2 (P>0.050). The subjects were instructed to abstain from eating banana, chocolate, or drinking coffee the day of the test.57–60
PLR Analysis
Pupillometric recordings were analyzed using the average pupil diameter during 3 seconds before the flash onset as a baseline value. Noise and blinking artifacts were removed from recordings with median filtering using a 200-ms window and derivative filtering. Responses irreparably contaminated (eye blinks or slow drifts >200 ms) were excluded. The filtered response values were divided by the baseline pupil diameter to normalize the PLR parameters and compare the results among different subjects. Normalized peak pupil constriction ampli- tude was estimated as the maximum pupil constriction and expressed relative to the baseline value. The peak latency (PL) was defined as the time from stimulus onset to the peak pupil constriction amplitude (PA). The PIPR was expressed as the median pupil diameter between 6 and 8 seconds after the flash
offset, relative to the baseline. The percentage of rejected peak pupil constriction amplitude responses at all luminance was 3.16% and for the PIPR it was 1.65%.
Cambridge Colour Test (CCT)
Measurements of the color discrimination thresholds were done using the CCT v2.0 in its Tri-vector and Ellipses protocols with stimuli generated by a ViSaGe 2/5 graphics card (Cam- bridge Research Systems, Rochester, England, UK) and a gamma corrected Sony FD Trinitron color monitor (Model GDM-F500T9; Sony Corporation, Tokyo, Japan). The procedure of calibration was performed using the OptiCAL 200-E photometer and the standard calibration routine of the VSG Desktop library (version 8.0) provided by Cambridge Research Systems.
The design of the CCT is based on the same principle as the Ishihara pseudoisochromatic plates. The adoption of spatial noise and luminance noise in the stimuli is intended to eliminate the influence of spatial contour or luminance clues in the color discrimination response. In the CCT, a mosaic composed of small circles of several sizes and luminance constitutes both the target and the background. A subset of these circles presented at a different chromaticity from the background forms a Landolt‘‘C’’stimulus target. The diameter of the circles varied from 5.7 to 22.8 arcmin and their luminance ranged from 7 to 15 phot cd/m2. The background chromaticity was set at u’¼0.1977 and v’¼0.4689, in CIE 1976 Color Space. Subjects were tested in a darkened room and seated at 3 m from the monitor, the outer diameter of the Landolt’s‘‘C’’subtended 4.48visual angle, the inner diameter 2.38; and the gap subtended 0.88.
Monocular tests were performed in both eyes in a randomly selected order. The target was randomly presented with the gap at one of the following four positions: up, down, right, or left (4-alternative forced choice). Subjects were instructed to identify the position of the gap in the ‘‘C’’ using a remote response box control (CT6, CRS). The CCT was performed in its two testing procedures, the Trivector test used to measure thresholds along three confusion axes, protan, deutan, and tritan, and the Ellipses test used to estimate a MacAdam ellipse interpolated along the thresholds obtained at each of eight vectors.
Optical Coherence Tomography (OCT)
Analysis of the peripapillary RNFL thickness was performed using a Cirrus HD-OCT (software v. 5.2, model 4000; Carl Zeiss Meditec, Inc.), which uses a super-luminescent diode scan with a center wavelength of 840 nm and an acquisition rate of 27000 A-scans per second at an axial resolution of 5 lm.
Peripapillary RNFL measurements were obtained using a FIGURE1. Stimulus protocol for PLR. After 10 minutes of dark adaption for each luminance level a red flash (red rectangles) was presented followed by a blue flash (blue rectangles) after terminating the recording of the red flash. All flashes were 1 second in duration. Pupil size was recorded during 1 minute. Responses to flashes below 0 log phot cd/m2were separated by at least 30 seconds of dark adaptation. For the photopic range of luminances, 1, 2, 2.4 log photopic cd/m2we used an interstimulus interval of 90 seconds of dark adaptation.
circular sweep with a fixed diameter of 3.45 mm around the optic disc. All information was reviewed and confirmed for the absence of movement artifacts, good centering on the optic disc, and a signal strength above 7. Scans were also evaluated in terms of the adequacy of the algorithm for detecting the RNFL. Only scans without overt algorithm failure in detecting the retinal borders were included.
Data Analysis
The Shapiro-Wilk test was performed to assess the normal distribution and graphic inspection of the data. Data from both eyes for each participant were collected to increase potentially the power of the study. In order to compare data across groups, we used a general estimating equations (GEE) method to adjust within subject intereye correlations.61,62 Further- more, single-eye analyses were made using the Mann-Whitney U test, left eyes were chosen for this specific analysis (see Supplementary Table S2). For variables with parametric
distributions, a t-test was performed and for variables with nonparametric distributions, Mann-Whitney U test was used.
To analyze sex and age differences between groups,v2test was conducted for sex, and an ANOVA for age. ANOVA was performed with Brown Forsythe correction. Pearson and Spearman correlation coefficients were used to measure the degree of association between some variables that showed losses in the OSA group. For the linear regression analysis, we used only the variables that had a moderate or strong correlation. Whenever both eyes were eligible, the right eye was arbitrarily chosen for this specific analysis.
For all statistical tests, the level of significance was set ata¼ 0.05. We used SPSS (version 24.0, SPSS Statistics; IBM, Corp, Armonk, NY, USA) and Stata (version 12.0, StataCorp, College Station, TX, USA) as the software for conducting analyses.
The datasets supporting the conclusions of this manuscript are available on open science framework: https://osf.io/
7qwhn.
TABLE1. Demographic, Clinical, and Polysomnographic Data of all Participants
Control Group OSA Group, Moderate to Severe OSA
PValue
n Mean6SD Eyes 95% CI n Mean6SD Eyes 95% CI
Sex
Female 17 (68%) – 31 – 13 (48.1%) – 24 – –
Male 8 (32%) – 15 – 14 (51.9%) – 23 – –
Total 25 46 27 47 0.109*
Age, y 54.2868.89 50.61–57.95 52.6069.13 48.98–56.21 0.505†
Ophthalmologic characteristics
BCVA, logMAR 0.0560.07 0.03–0.07 0.1860.61 0.04 to 0.40 0.506‡
SE, D 1.2161.42 0.69–1.71 0.1561.35 0.36 to 0.66 0.005‡
IOP, mm Hg 13.6561.84 13.00–14.29 14.8562.18 14.08–15.62 0.008‡
Cup-to-disc ratio 0.4060.15 0.35–0.45 0.5360.58 0.28–0.78 0.584‡
MD SAP, dB 1.0862.02 1.79 to3.76 1.0861.47 1.60 to5.59 0.997§
PSD SAP 2.8661.92 2.19–3.53 2.3461.00 1.99–2.69 0.581‡
VFI SAP 97.2664.19 95.80–98.72 97.4861.69 96.78–98.18 0.071‡
OCT RNFL thickness,lm 96.5368.26 93.81–99.24 99.41613.94 94.55–104.28 0.297§
Superior 120.71617.10 115.09–126.33 120.38616.88 114.49–126.27 0.935§
Nasal 71.6169.65 68.43–74.78 75.38615.09 70.12–80.65 0.217§
Inferior 129.18614.72 124.35–134.02 131.03625.62 122.09–139.97 0.693‡
Temporal 63.42610.44 59.99–66.85 70.29615.09 65.03–75.56 0.033‡
Sleep characteristics PSG
AHI (events/h) 5.2564.38 2.91–7.59 40.87626.13 33.20–48.54 <0.001‡
ODI (events/h) 5.2667.20 1.42–9.09 19.39616.81 13.87–24.92 <0.001‡
Total sleep time (min) 391.19635.83 372.09–410.28 351.40660.58 333.62–369.19 0.010‡
Total arousal index (events/h) 12.8366.79 9.21–16.44 41.33625.17 33.77–48.90 <0.001‡
SaO2minimum % 88.2563.33 86.47–90.03 78.3067.52 76.09–80.51 <0.001‡
Wake after sleep onset (min) 57.46622.35 45.55–69.37 95.66649.84 81.03–110.29 0.006‡
REM sleep (%) 21.0363.91 18.94–23.11 17.83615.15 13.38–22.28 0.014‡
PSQI
Sleep efficiency 0.2460.57 0.07–0.41 0.8461.14 0.49–1.19 0.006‡
Sleep latency 1.1760.85 0.92–1.43 1.2361.03 0.91–1.54 0.952‡
Daytime dysfunction 0.6360.74 0.41–0.85 1.3961.06 1.06–1.71 <0.001‡
Sleep duration 0.6160.77 0.38–0.84 1.4368.46 1.17–1.69 <0.001‡
Sleep disturbance 1.4360.58 1.26–1.61 2.1167.84 1.88–2.35 <0.001‡
Sleep medication 0.2660.85 0.01–0.51 0.3960.89 0.11–0.66 0.150‡
Sleep quality 0.8960.71 0.68–1.10 1.9360.82 1.68–2.68 <0.001‡
PSQI global score 5.2463.18 4.29–6.18 9.3264.27 8.02–10.62 <0.001‡
BCVA, best-corrected visual acuity; PSD, pattern standard deviation; VFI, visual field index; REM, rapid eye movement; SaO2, oxyhemoglobin saturation; SE, spherical equivalent.
* Pearson’s X2test.
† Brown-Forsythe ANOVA.
‡ Mann-WhitneyUtest.
§t-test.
R
ESULTSThis study included 47 eyes from 27 patients with OSA aging from 37 to 72 years (mean 6 SD¼52.60 6 9.13 years, 13 females) and 46 eyes from 25 healthy control participants aging from 38 to 74 years (54.28 6 8.89 years, 17 females).
Eleven eyes (7 from OSA patients and 4 from controls) were excluded according to exclusion criteria. OSA severity was categorized based on the AHI, into moderate (22 eyes) and severe (25 eyes). For statistical analyses, moderate and severe OSA patients were combined into a single group. There was no statistically significant difference between each group in terms of age, sex, or visual acuity (P> 0.050). Spherical refractive error and IOP showed a difference between groups (P <
0.010) but all participants met the inclusion criteria (IOP<21 mm Hg and spherical refraction within65.00 D and cylinder refraction within63.00 D, to avoid that high refraction errors to interfere in retinal anatomy and consequently affect the PLR results). Neither the mean VF test by SAP nor the mean RNFL thickness measured with OCT for all quadrants differed significantly between groups (P > 0.050) with exception of the temporal quadrant (P¼0.033). Table 1 shows relevant data on demographic, ophthalmologic, and sleep parameters of the groups.
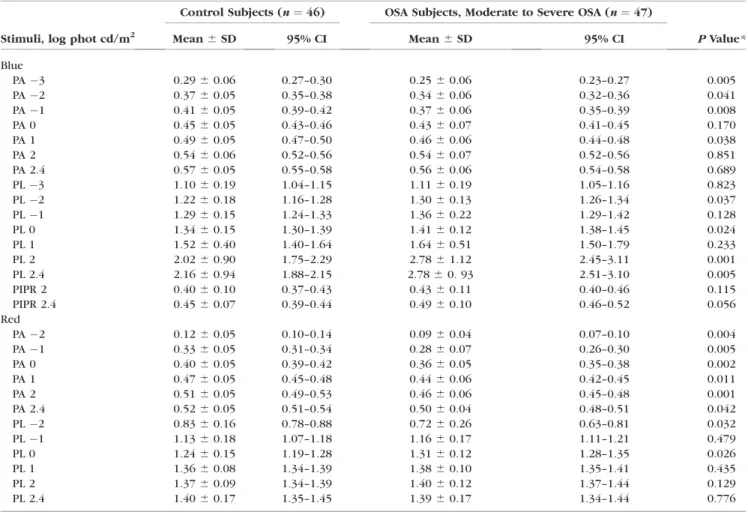
Rod, Cone, and ipRGC Contributions to the PLR Table 2 presents the mean PLR measurements for all participants. Figure 2 presents the normalized mean PLR to different flash luminances for control and OSA groups. The
normalized peak pupil constriction amplitude of the transient phase as a function of blue and red flash luminance for the groups is shown in Figure 3. Comparison between OSA and control groups for peak pupil constriction amplitude in response to blue stimuli showed significant differences at3 log cd/m2(P¼0.013),2 log cd/m2(P¼0.041),1 log cd/m2 (P¼0.008), and 1 log cd/m2(P¼0.038). Significant differences were found at all luminance conditions of the red flash (P<
0.050).
Figure 4 shows the PIPR amplitude of the PLR between 6 and 8 seconds after light offset for the blue stimuli. Statistical comparisons between groups showed no significant differenc- es in the contributions of ipRGCs to the PLR (P>0.050).
Figure 5 shows the average of the PL of the PLR to blue and red stimuli. PL comparisons between OSA and control groups for the blue and red stimuli showed significant differences (P<
0.050) at2, 0, 2, 2.4 log cd/m2, and at2 and 0 log cd/m2, respectively.
It is worth noting that the above PLR significant differences are based on the statistical analysis from both eyes for each participant. However, most of the significant differences remain with the analysis of one eye for each participant (see Supplementary Table S2).
Cambridge Colour Test (CCT)
Results of the Trivector and Ellipse protocols (Figs. 6, 7) did not show significant differences between OSA and control groups (P>0.050).
TABLE2. Mean6SD Pupillary Light Measurements in Control and OSA Subjects
Stimuli, log phot cd/m2
Control Subjects (n¼46) OSA Subjects, Moderate to Severe OSA (n¼47)
PValue*
Mean6SD 95% CI Mean6SD 95% CI
Blue
PA3 0.2960.06 0.27–0.30 0.2560.06 0.23–0.27 0.005
PA2 0.3760.05 0.35–0.38 0.3460.06 0.32–0.36 0.041
PA1 0.4160.05 0.39–0.42 0.3760.06 0.35–0.39 0.008
PA 0 0.4560.05 0.43–0.46 0.4360.07 0.41–0.45 0.170
PA 1 0.4960.05 0.47–0.50 0.4660.06 0.44–0.48 0.038
PA 2 0.5460.06 0.52–0.56 0.5460.07 0.52–0.56 0.851
PA 2.4 0.5760.05 0.55–0.58 0.5660.06 0.54–0.58 0.689
PL3 1.1060.19 1.04–1.15 1.1160.19 1.05–1.16 0.823
PL2 1.2260.18 1.16–1.28 1.3060.13 1.26–1.34 0.037
PL1 1.2960.15 1.24–1.33 1.3660.22 1.29–1.42 0.128
PL 0 1.3460.15 1.30–1.39 1.4160.12 1.38–1.45 0.024
PL 1 1.5260.40 1.40–1.64 1.6460.51 1.50–1.79 0.233
PL 2 2.0260.90 1.75–2.29 2.7861.12 2.45–3.11 0.001
PL 2.4 2.1660.94 1.88–2.15 2.7860. 93 2.51–3.10 0.005
PIPR 2 0.4060.10 0.37–0.43 0.4360.11 0.40–0.46 0.115
PIPR 2.4 0.4560.07 0.39–0.44 0.4960.10 0.46–0.52 0.056
Red
PA2 0.1260.05 0.10–0.14 0.0960.04 0.07–0.10 0.004
PA1 0.3360.05 0.31–0.34 0.2860.07 0.26–0.30 0.005
PA 0 0.4060.05 0.39–0.42 0.3660.05 0.35–0.38 0.002
PA 1 0.4760.05 0.45–0.48 0.4460.06 0.42–0.45 0.011
PA 2 0.5160.05 0.49–0.53 0.4660.06 0.45–0.48 0.001
PA 2.4 0.5260.05 0.51–0.54 0.5060.04 0.48–0.51 0.042
PL2 0.8360.16 0.78–0.88 0.7260.26 0.63–0.81 0.032
PL1 1.1360.18 1.07–1.18 1.1660.17 1.11–1.21 0.479
PL 0 1.2460.15 1.19–1.28 1.3160.12 1.28–1.35 0.026
PL 1 1.3660.08 1.34–1.39 1.3860.10 1.35–1.41 0.435
PL 2 1.3760.09 1.34–1.39 1.4060.12 1.37–1.44 0.129
PL 2.4 1.4060.17 1.35–1.45 1.3960.17 1.34–1.44 0.776
* Generalized estimating equation.
Sleep Parameters
OSA patients had significant differences in the PSG parameters and higher PSQI components (P<0.015) than controls as it is expected in OSA, except for sleep latency and sleep medication questions of the PSQI (P>0.150; Table 1).
Relations Between PLR and Clinical Measures in OSA
Analysis of the transient PLR amplitude indicated significant correlations among some visual functions, retinal, morphologic parameters, and sleep parameters. There was a negative correlation between ODI and the PLR peak pupil constriction amplitude for the blue flash luminance at1 log cd/m2 (R¼ 0.516 R2 ¼ 0.266; P ¼ 0.003; Supplementary Fig. S1). A significant positive correlation was observed between the mean OCT T with ODI (R ¼0.516 R2¼ 0.266; P¼0.008;
Supplementary Fig. S2). There was a positive correlation between the PLR peak pupil constriction amplitude for the blue flash luminance at2 log cd/m2and the total sleep time (TST;R¼0.490R2¼0.240;P¼0.003; Supplementary Fig. S3).
D
ISCUSSIONTo our knowledge, this is the first study to investigate the OSA impact on the rod/cone and ipRGC contributions to PLR. We assessed the PLR under conditions designed to preferentially elicit the contribution of the inner and outer retinal photoreceptors and we endeavored to ensure that our study included only patients diagnosed with OSA without co- morbidities that might have affected the visual system. Our data showed at low luminance levels (3,2, and1 log cd/
m2) for the blue flash and at all luminance levels for the red flash the OSA group had a significantly lower peak pupil constriction amplitude relative to the control group. Therefore, at low luminance levels, the contributions of the rods to the PLR were significantly lower in comparison to the control group. A decrease of the peak pupil constriction amplitude responses for long-wavelength stimuli at high-luminance points out to a reduced rod/cone contribution in moderate and severe OSA patients. Additionally, the OSA group exhibited longer constriction latency. It has been previously shown that pupil latency can be delayed in some diseases due to an afferent- based pathway dysfunction.63,64
FIGURE2. Normalized pupillary diameter for different flash luminance levels. PLR to blue flashes are shown in theupper panelsas the average of results from controls and patients with OSA. PLR results to red flashes are shown in thelower panelsas the average of the two groups.Redandblue barsrepresent the 1-second stimulus flashes.
In the avascular outer retina, rod photoreceptors are among the most metabolically active cells of the central nervous system and during darkness, the metabolic process requires the highest oxygen consumption of any tissue of the body.65 The oxygen consumption of rods and cones increases as light levels fall.65,66 OSA-induced hypoxia leads to inflammatory responses, vascular dysregulation, endothelial dysfunction, and oxidative damage, and it is thought to be one of the most critical pathogenesis factors for ischemic retinal diseases, such as proliferative diabetic retinopathy, retinal vessel occlusion, and oxygen-induced retinopathy.5,6,15 Here, correlations be- tween the PLR and sleep parameters indicated that a reduced peak pupil response to blue flash luminance at2 and1 log cd/m2 (rod condition) was associated with reduced TST and increased levels of the ODI, respectively. Thus, dysfunctional
contributions of the outer retina to PLR found in this study may be associated with OSA’s chronic and intermittent hypoxia.
Even though the RGCs are sensitive to hypoxic conditions, which may cause damage or loss of these cells, the ipRGCs seem to have an injury-resistant character compared with other retinal cells.67–71 Our findings agree with this observation as the ipRGC contributions to the PLR assessed by the amplitude of the PIPR between 6 and 8 seconds were preserved in OSA patients.
The ipRGC cells, especially the M1 ipRGC subtype, send their axons to the suprachiasmatic nucleus (SCN) of the hypothalamus to mediate circadian regulation and to other brain nuclei, including the olivary pretectal nucleus involved in the PLR.72,73 Melatonin secretion is driven by the master circadian clock SCN and it has been considered a stable biomarker, the gold standard of circadian phase entrain- ment.74,75 Some studies have reported that in OSA patients there is an alteration in circadian rhythms and melatonin FIGURE 3. Pupil constriction amplitude as a function of flash
luminance, forredandbluestimuli. OSA patients are represented by dashed lines. Controls are represented bysolid lines. Thevertical bars represent the standard error of the mean for each group. Significant comparisons are marked with * where P < 0.050. For the blue luminance significant differences were found between OSA and control groups at3,1, 0, and 1 log phot cd/m2. For the red luminance significant differences were found for all tested luminances.
FIGURE 4. The normalized constriction amplitude of the pupillary sustained response (or PIPR) measured between 6 and 8 seconds after blue flash offset for the control and OSA groups. Vertical bars represent the standard error of the mean.
FIGURE5. Pupil constriction latency as a function of flash luminance forredandbluestimuli. Dashed linesrepresent OSA patients.Solid linesrepresent controls. Thevertical barsrepresent the standard error of the mean for each group. Significant comparisons are marked with * for the blue luminance and.for the red luminance whereP<0.050.
FIGURE 6. Color discrimination thresholds (in u’v’ units3104) for protan, deutan, and tritan confusion axes measured with the CCT. The vertical barsrepresent the standard error of the mean for each group.
secretion,22–24,76 but our results did not find reduced melanopsin-driven responses in OSA patients. Moreover, in this study, the OSA group presented an enhanced but not statistically significant ipRGC response to PLR compared with controls (Fig. 4).
L´eon et al.77have reported a delayed pupillary re-dilation response after a bright blue light offset significantly greater in patients with outer retinal disease compared with controls.
They proposed that the loss of rod and cone contributions to the PLR might be pathologically altered in favor of the melanopsin pupillary response. Further, a previous work of Hannibal et al.78 reported a higher density in the temporal retina of M1 ipRGC cells, which project mainly to the olivary pretectal nucleus and SCN. Therefore, the enhanced PIPR of the OSA group may be associated to reduced outer retinal photoreceptor contributions to PLR in favor of melanopsin and/or to the only significant difference found in the temporal quadrant of the RNFL thickness, but it is important to note that the mean RNFL thickness values for both groups were within the normal range.79
Previous papers have reported a strong link between OSA and optic nerve disorders.7,19–21,80–84
Studies of electrophysi- ology and RNFL thickness have reported conflicting findings in OSA patients, some showed significant reduction of the RNFL thickness,9,19,21,71 pattern electroretinogram (PERG),82,84 and visual evoked potential (VEP),83,84 while others found no decrease85–87or alterations of ERG.83Our results did not show any reduction of RNFL thickness or VF in the OSA group, in agreement with previous studies by Salzgeber et al.,87 Ferrandez et al.,85,86 and Yu et al.,88 which did not find significant thinning of the RGC layer or macular thickness in OSA patients. Various authors have found affected values of MD and PSD in OSA patients,89–91and Ferrandez et al.85have reported an impairment in the VF evaluated by SAP, suggesting dysfunction but not the death of the RGC. Findings by Yu et al.88 suggest that the vascular changes might occur before changes in RNFL thickness and vascular impairment of the vessel densities, which are more prominent in the peripapillary area in moderate OSA.
The fact that several studies found no differences in the ophthalmologic variables measured in OSA patients compared with controls, may be due to the possibility that OSA duration, rather than its severity, could be a more determining factor in the association with retinal diseases.20,92,93 In this study, the
onset of the disease remains uncertain because it was based on the patients’ reports, which in most cases did not exceed 4 years. Therefore, OSA patients were evaluated in a baseline condition. These facts show a limitation in the design of this cross-sectional study; longitudinal studies with larger cohorts are needed to assess the progressive effect of OSA on the photoreceptors and its relation to a short- or long-term treatment.
In summary, this is a pioneer study that evaluated the impact of OSA on photoreceptor contributions to PLR. As noted above, we did not find color vision defects, reduction of RNFL thickness or VF in OSA patients, but we found significant differences only through the pupillometry protocol. The contributions of the outer retina photoreceptors, rod and cones, to the PLR were affected in moderate and severe OSA patients. In contrast, the contribution of the inner retina photoreceptors to the PLR was preserved. In this context, results indicate that pupillometry can be used as a sensitive noninvasive and promising method for early detection of retinal dysfunction even before major symptoms or ocular diseases appears.
Acknowledgments
Supported by grants from the Sao Paulo Research Foundation (FAPESP) Thematic Projects 2008/58731-2 and 2014/26818-2 (DFV), FAPESP (2013/03553-0), and the Coordination for the Improvement of Higher Education Personnel (CAPES) (PEC-PG 6160107) doctoral fellowships (GLDC), CAPES 12309-13-3 (CPBG), FAPESP (2009/54292-7), and the National Council for Scientific and Technological Development (CNPq 162576/2013-7) post-doctoral fellowship (BVN). BVN was supported by the J´anos B´olyai scholarship of the Hungarian Academy of Sciences. DFV is the recipient of a 1A CNPq Productivity Grant. The sponsoring or funding organizations played no roles in the design or conduct of this research.
Disclosure: G.L. Duque-Chica, None; C.P.B. Gracitelli, None;
A.L.A. Moura, None;B.V. Nagy, None;K.S. Vidal, None;G. de Melo, None; A. Paranhos Jr, None; M.B. Cahali, None; D.F.
Ventura, None
References
1. Senaratna CV, Perret JL, Lodge CJ, et al. Prevalence of obstructive sleep apnea in the general population: a systematic review.Sleep Med Rev. 2017;34:70–81.
2. Peppard PE, Young T, Barnet JH, Palta M, Hagen EW, Hla KM.
Increased prevalence of sleep-disordered breathing in adults.
Am J Epidemiol. 2013;177:1006–1014.
3. Guilleminault C, Tilkian A. The sleep apnea syndromes.Annu Rev Med. 1976;27:465–484.
4. Iber C, Ancoli-Israel S, Chesson A, Quan SF. The AASM Manual for the Scoring of Sleep and Associated Events:
Rules, Terminology and Technical Specifications. Vol 1.
Westchester: American Academy of Sleep Medicine; 2007.
5. Lanfranchi P, Somers V. Obstructive sleep apnea and vascular disease.Respir Res. 2001;2:315–319.
6. L´evy P, P´epin J-L, Arnaud C, Baguet J-P, Dematteis M, Mach F.
Obstructive sleep apnea and atherosclerosis.Prog Cardiovasc Dis. 2009;51:400–410.
7. Kargi SH, Altin R, Koksal M, Kart L, Cinar F, Ugurbas SH, Ayoglu F. Retinal nerve fiber layer measurements are reduced in patients with obstructive sleep apnoea syndrome. Eye.
2005;19:575–579.
8. O’Brien L, Gozal D. Autonomic dysfunction in children with sleep-disordered breathing.Sleep. 2005;28:747–752.
9. Gozal D, Hakim F, Kheirandish-Gozal L. Chemoreceptors, baroreceptors, and autonomic deregulation in children with FIGURE 7. MacAdam Ellipses presented in the CIE chromaticity
diagram (1976, u’v’ units) for control and OSA groups. The colors within the ellipse are those not discriminated from the reference background. The larger the area of the ellipse the worse is the discrimination.
obstructive sleep apnea.Respir Physiol Neurobiol. 2013;185:
177–185.
10. Peppard PE, Young T, Palta M, Skatrud J. Prospective study of the association between sleep-disordered breathing and hypertension.N Engl J Med. 2000;342:1378–1384.
11. Cochen De Cock V, Benard-Serre N, Driss V, et al. Supine sleep and obstructive sleep apnea syndrome in Parkinson’s disease.
Sleep Med. 2017;16:1497–1501.
12. Buratti L, Viticchi G, Falsetti L, et al. Vascular impairment in Alzheimer’s disease: the role of obstructive sleep apnea. J Alzheimers Dis. 2014;38:445–453.
13. Mojon DS, Hess CW, Goldblum D, et al. High prevalence of glaucoma in patients with sleep apnea syndrome.Ophthal- mology. 1999;106:1009–1012.
14. McNab AA. Floppy eyelid syndrome and obstructive sleep apnea.Ophthal Plast Reconstr Surg. 1997;13:98–114.
15. McNab AA. Council Lecture 2004 The eye and sleep.Clin Exp Ophthalmol. 2005;33:117–125.
16. Mojon DS, Hedges TR, Ehrenberg B, et al. Association between sleep apnea syndrome and nonarteritic anterior ischemic optic neuropathy.Arch Ophthalmol. 2002;120:601–
605.
17. Glacet-Bernard A, Leroux Les Jardins G, Lasry S, et al.
Obstructive sleep apnea among patients with retinal vein occlusion.Arch Ophthalmol. 2010;128:1533–1538.
18. Yu DY, Cringle SJ. Oxygen distribution and consumption within the retina in vascularised and avascular retinas and in animal models of retinal disease.Prog Retin Eye Res. 2001;20:
175–208.
19. Zhao XJ, Yang CC, Zhang JC, Zheng H, Liu PP, Li Q.
Obstructive sleep apnea and retinal nerve fiber layer thickness: a meta-analysis.J Glaucoma. 2016;25:e413–e418.
20. Shiba T, Takahashi M, Sato Y, et al. Relationship between severity of obstructive sleep apnea syndrome and retinal nerve fiber layer thickness. Am J Ophthalmol. 2014;157:
1202–1208.
21. Moghimi S, Ahmadraji A, Sotoodeh H, et al. Retinal nerve fiber thickness is reduced in sleep apnea syndrome. Sleep Med.
2013;14(1):53–57.
22. Butler MP, Smales C, Wu H, et al. The circadian system contributes to apnea lengthening across the night in obstructive sleep apnea.Sleep. 2015;38:1793–1801.
23. Hern´andez C, Abreu J, Abreu P, Castro A, Jim´enez A.
Nocturnal melatonin plasma levels in patients with OSAS:
the effect of CPAP.Eur Respir J. 2007;30:496–500.
24. Lemmer B, Scholtze J, Schmitt J. Circadian rhythms in blood pressure, heart rate, hormones, and on polysomnographic parameters in severe obstructive sleep apnea syndrome patients.Blood Press Monit. 2016;21:136–143.
25. Provencio I, Rodriguez IR, Jiang G, Hayes WP, Moreira EF, Rollag MD. A novel human opsin in the inner retina. J Neurosci. 2000;20:600–605.
26. Berson DM, Dunn FA, Takao M. Phototransduction by retinal ganglion cells that set the circadian clock.Science. 2002;295:
1070–1073.
27. Dacey DM, Liao HW, Peterson BB, et al. Melanopsin- expressing ganglion cells in primate retina signal colour and irradiance and project to the LGN. Nature. 2005;433:749–
754.
28. Zaidi FH, Hull JT, Peirson SN, et al. Short-wavelength light sensitivity of circadian, pupillary, and visual awareness in humans lacking an outer retina. Curr Biol. 2007;17:2122–
2128.
29. Brown TM, Gias C, Hatori M, et al. Melanopsin contributions to irradiance coding in the thalamo-cortical visual system.
PLoS Biol. 2010;8.
30. Ecker JL, Dumitrescu ON, Wong KY, et al. Melanopsin- expressing retinal ganglion-cell photoreceptors: cellular diversity and role in pattern vision.Neuron. 2010;67:49–60.
31. Schmidt T, Alam N, Chen S, et al. A role for melanopsin in alpha retinal ganglion cells and contrast detection.Neuron.
2014;82:781–788.
32. Bergamin O, Bridget Zimmerman M, Kardon RH. Pupil light reflex in normal and diseased eyes: diagnosis of visual dysfunction using waveform partitioning. Ophthalmology.
2003;110:106–114.
33. Park JC, Moura AL, Raza AS, Rhee DW, Kardon RH, Hood DC.
Toward a clinical protocol for assessing rod, cone, and melanopsin contributions to the human pupil response.
Investig Ophthalmol Vis Sci. 2011;52:6624–6635.
34. Feigl B, Mattes D, Thomas R, Zele AJ. Intrinsically photosen- sitive (melanopsin) retinal ganglion cell function in glaucoma.
Invest Ophthalmol Vis Sci. 2011;52:4362–4367.
35. Moura AL, Nagy BV, La Morgia C, et al. The pupil light reflex in Leber’s hereditary optic neuropathy: evidence for preserva- tion of melanopsin-expressing retinal ganglion cells.Invest Ophthalmol Vis Sci. 2013;54:4471–4477.
36. Gracitelli CPB, Duque-Chica GL, Moura AL, et al. A positive association between intrinsically photosensitive retinal gan- glion cells and retinal nerve fiber layer thinning in glaucoma.
Invest Ophthalmol Vis Sci. 2014;55:7997–8005.
37. Duque-Chica GL, Gracitelli CPB, Moura AL, et al. Inner and outer retinal contributions to pupillary light response:
correlation to functional and morphological parameters in glaucoma.J Glaucoma. 2018;27:723–732.
38. Feigl B, Zele AJ. Melanopsin-expressing intrinsically photo- sensitive retinal ganglion cells in eetinal disease.Optom Vis Sci. 2014;91:894–903.
39. Joyce DS, Feigl B, Kerr G, Roeder L, Zele AJ. Melanopsin- mediated pupil function is impaired in Parkinson’s disease.Sci Rep. 2018;8:7796.
40. Kardon R, Anderson SC, Damarjian TG, Grace EM, Stone E, Kawasaki A. Chromatic pupillometry in patients with retinitis pigmentosa.Ophthalmology. 2011;18:376–381.
41. Gamlin PDR, McDougal DH, Pokorny J, Smith VC, Yau KW, Dacey DM. Human and macaque pupil responses driven by melanopsin-containing retinal ganglion cells. Vision Res.
2007;47:946–954.
37. Guler AD, Ecker JL, Lall GS, et al. Melanopsin cells are the principal conduits for rod-cone input to non-image-forming vision.Nature. 2008;453:102–105.
38. Kardon R, Anderson SC, Damarjian TG, Grace EM, Stone E, Kawasaki A. Chromatic Pupil Responses. Ophthalmology.
2009;116:1564–1573.
39. Gooley JJ, Ho Mien I, St. Hilaire MA, et al. Melanopsin and rod- cone photoreceptors play different roles in mediating pupillary light responses during exposure to continuous light in humans.J Neurosci. 2012;32:14242–14253.
40. Kostic C, Crippa S, Martin C, et al. Determination of rod and cone influence to the early and late dynamic of the pupillary light response. Invest Ophthalmol Vis Sci. 2016;57:2501–
2508.
41. Chylack LT, Wolfe JK, Singer DM, et al. The lens opacities classification system III. The longitudinal study of cataract study group.Arch Ophthalmol. 1993;111:831–836.
42. Buysse DJ, Reynolds CF, III Monk TH, Berman SR, Kupfer DJ.
The Pittsburgh Sleep Quality Index: a new instrument for psychiatric practice and research. Psychiatry Res. 1989;28:
193–213.
48. Lucas RJ, Peirson SN, Berson DM, et al. Measuring and using light in the melanopsin age.Trends Neurosci. 2014;37:1–9.
49. McDougal DH, Gamlin PD. The influence of intrinsically- photosensitive retinal ganglion cells on the spectral sensitivity
and response dynamics of the human pupillary light reflex.
Vision Res. 2010;50:72–87.
50. Keenan WT, Rupp AC, Ross RA, et al. A visual circuit uses complementary mechanisms to support transient and sus- tained pupil constriction.Elife. 2016;5:1–23.
51. Altimus CM, Guler AD, Alam NM, et al. Rod photoreceptors drive circadian photoentrainment across a wide range of light intensities.Nat Neurosci. 2010;13:1107–1112.
52. Barrionuevo PA, Nicandro N, McAnany JJ, Zele AJ, Gamlin P, Cao D. Assessing rod, cone, and melanopsin contributions to human pupil flicker responses.Invest Ophthalmol Vis Sci.
2014;55:719–727.
53. M¨unch M, Lorette L, Crippa SV, Kawasaki A. Circadian and wake-dependent effects on the pupil light reflex in response to narrow-bandwidth light pulses.Invest Ophthalmol Vis Sci.
2012;53:4546–4555.
54. Zele AJ, Feigl B, Smith SS, Markwell EL. The circadian response of intrinsically photosensitive retinal ganglion cells.
PLoS One. 2011;6:e17860.
55. Feigl B, Zele AJ, Fader SM, et al. The post-illumination pupil response of melanopsin-expressing intrinsically photosensi- tive retinal ganglion cells in diabetes.Acta Ophthalmol. 2012;
90:230–234.
56. Kankipati L, Girkin CA, Gamlin PD. Post-illumination pupil response in subjects without ocular disease.Invest Ophthal- mol Vis Sci. 2010;51:2764–2769.
57. Vural AD, Kara N, Sayin N, Pirhan D, Ersan HBA. Choroidal thickness changes after a single administration of coffee in healthy subjects.Retina. 2014;34:223–8.
58. Bardak H, Gunay M, Mumcu U, Bardak Y. Effect of single administration of coffee on pupil size and ocular wavefront aberration measurements in healthy subjects.Biomed Res Int.
2016;2016:1–5.
59. Sae-Teaw M, Johns J, Johns NP, Subongkot S. Serum melatonin levels and antioxidant capacities after consumption of pineapple, orange, or banana by healthy male volunteers.J Pineal Res. 2013;55:58–64.
60. Duarte AAM, Mostarda C, Irigoyen MC, Rigatto K. A single dose of dark chocolate increases parasympathetic modulation and heart rate variability in healthy subjects.Rev Nutr. 2016;
29:765–773.
61. Zeger SL, Liang KY. Longitudinal data analysis for discrete and continuous outcomes.Biometrics. 1986;42:121–130.
62. Murdoch IE, Morris SS, Cousens SN. People and eyes:
statistical approaches in ophthalmology. Br J Ophthalmol.
1998;82:971–973.
63. Monaco A, Cattaneo R, Mesin L, Fiorucci E, Pietropaoli D.
Evaluation of autonomic nervous system in sleep apnea patients using pupillometry under occlusal stress: a pilot study.CRANIOt. 2014;32:139–147.
64. Bergamin O, Kardon RH. Latency of the pupil light reflex:
sample rate, stimulus intensity, and variation in normal subjects.Invest Ophthalmol Vis Sci. 2003;44:1546–1554.
65. Sivaprasad S, Arden G. Spare the rods and spoil the retina:
revisited.Eye. 2016;30:189–192.
66. Birol G, Wang S, Budzynski E, Wangsa-Wirawan ND, Linsen- meier RA. Oxygen distribution and consumption in the macaque retina.Am J Physiol Hear Circ Physiol. 2007;293:
H1696–H1704.
67. Li RS, Chen BY, Tay DK, Chan HHL, Pu ML, So KF. Melanopsin- expressing retinal ganglion cells are more injury-resistant in a chronic ocular hypertension model.Invest Ophthalmol Vis Sci. 2006;47:2951–2958.
68. Cui Q, Ren C, Sollars PJ, Pickard GE, So K-F. The injury resistant ability of melanopsin-expressing intrinsically photo- sensitive retinal ganglion cells.Neuroscience. 2015;284:845–
853.
69. de Sevilla M¨uller L, Sargoy A, Rodriguez AR, Brecha NC.
Melanopsin ganglion cells are the most resistant retinal ganglion cell type to axonal injury in the rat retina. PLoS One. 2014;9:1–7.
70. La Morgia C, Ross-Cisneros FN, Sadun AA, et al. Melanopsin retinal ganglion cells are resistant to neurodegeneration in mitochondrial optic neuropathies. Brain. 2010;133:2426–
2438.
71. Wang S, Gu D, Zhang P, et al. Melanopsin-expressing retinal ganglion cells are relatively resistant to excitotoxicity induced by N-methyl-d-aspartate.Neurosci Lett. 2018;662:368–373.
72. Chen SK, Badea TC, Hattar S. Photoentrainment and pupillary light reflex are mediated by distinct populations of ipRGCs.
Nature. 2011;476(7358):92–95.
73. Ventura DF, Moura AL, Duque-Chica GL, et al. The non-image- forming visual system: its relation to sleep, circadian rhythm, pupillary light reflex and other functions. In: Adams F, Pessoa O, Jr Kogler JE, Jr editors,Cognitive Science: Recent Advances and Recurring Problems. Wimington, DE: Vernon Press;
2017:73–87.
74. Amnon B. Melatonin in Humans. N Engl J Med. 1997;336:
186–195.
75. Hastings M, O’Neill JS, Maywood ES. Circadian clocks:
Regulators of endocrine and metabolic rhythms. J Endocri- nol. 2007;195:187–198.
76. Reutrakul S, Siwasaranond N, Nimitphong H, et al. Associa- tions between nocturnal urinary 6-sulfatoxymelatonin, ob- structive sleep apnea severity and glycemic control in type 2 diabetes.Chronobiol Int. 2017;34:382–392.
77. L´eon L, Crippa S, Borruat F, Kawasaki A. Differential effect of long versus short wavelength light exposure on pupillary re- dilation in patients with outer retinal disease. Clin Exp Ophthalmol. 2011;40:e16–e24.
78. Hannibal J, Christiansen AT, Heegaard S, Fahrenkrug J, Kiilgaard JF. Melanopsin expressing human retinal ganglion cells: subtypes, distribution, and intraretinal connectivity. J Comp Neurol. 2017;525:1934–1961.
79. Alasil T, Wang K, Keane P, et al. Analysis of normal retinal nerve fiber layer thickness by age, sex, and race using spectral domain optical coherence tomography.J Glaucoma. 2012;22:
532–541.
80. Sun CL, Zhou LX, Dang Y, Huo YP, Shi L, Chang YJ. Decreased retinal nerve fiber layer thickness in patients with obstructive sleep apnea syndrome: a meta- analysis.Medicine. 2016;95:
e4499.
81. Zengin MO, Tuncer I, Karahan E. Retinal nerve fiber layer thickness changes in obstructive sleep apnea syndrome: one year follow-up results.Int J Ophthalmol. 2014;18:704–708.
82. Ng SH, Tai E, Min L, Hitam WW. Visual electrophysiological tests in obstructive sleep apnoea.Int Eye Sci. 2017;17:5–10.
83. Liguori C, Palmieri MG, Pierantozzi M, et al. Optic nerve dysfunction in obstructive sleep apnea: an electrophysiolog- ical study.Sleep. 2016;39:19–23.
84. Sergi M, Salerno DE, Rizzi M, et al. Prevalence of normal tension glaucoma in obstructive sleep apnea syndrome patients.J Glaucoma. 2007;16:42–46.
85. Ferrandez B, Ferreras A, Calvo P, Abadia B, Marin JM, Pajarin AB. Assessment of the retinal nerve fiber layer in individuals with obstructive sleep apnea.BMC Ophthalmol. 2016;16:40.
86. Ferrandez B, Ferreras A, Calvo P, et al. Macular retinal ganglion cell layer thickness is not reduced in patients with obstructive sleep apnea.Ophthalmic Res. 2016;56:85–91.
87. Salzgeber R, Iliev ME, Mathis J. Do optic nerve head and visual field parameters in patients with obstructive sleep apnea syndrome differ from those in control individuals?Klin Monbl Augenheilkd. 2014;231:340–343.
88. Yu J, Xiao K, Huang J, Sun X, Jiang C. Reduced retinal vessel density in obstructive sleep apnea syndrome patients: an optical coherence tomography angiography study. Invest Ophthalmol Vis Sci. 2017;58:3506.
89. Huseyinoglu N, Ekinci M, Ozben S, Buyukuysal C, Kale MY, Sanivar HS. Optic disc and retinal nerve fiber layer parameters as indicators of neurodegenerative brain changes in patients with obstructive sleep apnea syndrome.Sleep Breath. 2014;
18:95–102.
90. Xin C, Zhang W, Wang L, Yang D, Wang J. Changes of visual field and optic nerve fiber layer in patients with OSAS.Sleep Breath. 2015;19:129–134.
91. Tsang CSL, Chong SL, Ho CK, Li MF. Moderate to severe obstructive sleep apnoea patients is associated with a higher incidence of visual field defect.Eye. 2006;20:38–42.
92. Adam M, Okka M, Yosunkaya Sx, Bozkurt B, Kerimoˇglu H, Turan M. The evaluation of retinal nerve fiber layer thickness in patients with obstructive sleep apnea syndrome. J Ophthalmol. 2013;2013:292158.
93. Cinici E, Tatar A. Thickness alterations of retinal nerve fiber layer in children with sleep-disordered breathing due to adenotonsillar hypertrophy.Int J Pediatr Otorhinolaryngol.
2015;79:1218–1223.