Cite this: New J. Chem., 2021, 45, 11618
Towards more accurate solubility measurements with real time monitoring: a carvedilol case study†
Do´ra Csicsa´k,aEniko Borba+ ´s, *bSzabina Ka´da´r,b Petra T+ozse´r,bPe´ter Bagi, b Hajnalka Pataki,bBa´lint Sinko´,cKrisztina Taka´cs-Nova´kaand Gergely Vo¨lgyi a
The aim of this study was to draw attention to the challenges of solubility measurement and to present new techniques and detection methods that provide more accurate results. We investigated the effect of crystal structure, pH and buffer composition on thermodynamic equilibrium solubility using two polymorphs of carvedilol (Form I and Form II) as model compounds. Measuring the solubility of carvedilol is challenging, as the literature data show extremely high standard deviation. Therefore standardized measurements were performed in the pH range 3–10, in two solutions at 251C: Britton–
Robinson (BR) and BR with added KCl. Solid phase analysis was performed by X-ray powder diffraction and Raman spectroscopy. The measuredSpHdata were compared to the theoretical Henderson–Hassel- balch (HH) curve and a perfect fit was found in the pH range 7–10. The salt formation could be observed in the acidic pH range. The counter-ion and solubility of the salt were found to be different in various buffer solutions.In situfiber optic UV probes were used to monitor the dissolution of carvedilol polymorphs in real-time. The results showed significantly different dissolution kinetics for the polymorphs depending on the pH and the buffer solution. From the dissolution profile, the time required to reach the equilibrium was determined. In most cases, it was more than 24 hours, therefore using the standard protocol (6 hours agitation, 18 hours sedimentation) would have caused significant inaccuracy in results. In extreme cases the measured concentration after 24 hours was found to be 5 or 6 times higher than the real equilibrium solubility.
1. Introduction
Solubility is one of the most important physicochemical properties of a drug for the pharmaceutical industry. It can highly influence the absorption of a compound and consequently affect bioavailability. It is also a key parameter in the Biopharmaceutics Classification System (BCS).1 Solubility is influenced by the lattice structure of a compound.
Because of the different lattice energies, the dissolution requires more or less solvation energy.2Polymorphism is the ability of the compounds to exist in two or more crystalline structures, consequently it can affect their solubility or dissolution.3 As a rule of thumb, the polymorph having the lower lattice-free energy is the more stable form and it has lower solubility while the one with higher energy is less stable
but tends to dissolve faster and has higher solubility.4 Polymorphism can be observed at least for one-third of the active pharmaceutical ingredients. The topic received increasing attention in the past decades, as more and more cases with unexplored polymorphism caused serious safety problems.5 Cases with the highest publicity (chloramphenicol palmitate, oxytetracycline, enalapril, ritonavir) are discussed in detail in the literature.6–9 As the result, the discovery and investigation of possible polymorphs (i.e. polymorph screening) is now an inevitable requirement in drug development. Solubility difference of polymorphs will affect the bioavailability/bioequivalence of a drug product if the solubility is the rate-limiting factor upon absorption (for BCS II and IV drugs).
Equilibrium (or thermodynamic) solubility is the concen- tration of the compound in a saturated solution when the solid and solution phases are at equilibrium. This parameter can be measured by several methods, however, the ‘‘gold standard’’ is still the saturation shake-flask (SSF) technique.10 The kinetic solubility (not a thermodynamic constant) is the concentration when precipitation first appears in the (saturated or super- saturated) solution. It can be registered with anin situdevice, such as fiber optic UV probes. The kinetic solubility is generally higher than the measured equilibrium solubility.11In the case
aDepartment of Pharmaceutical Chemistry, Semmelweis University, H+ogyes Endre u. 9., H-1092 Budapest, Hungary
bDepartment of Organic Chemistry and Technology, Budapest University of Technology and Economics, M+uegyetem rakpart 3., H-1111, Budapest, Hungary.
E-mail: eniko.jaksaneborbas@edu.bme.hu
cPion Inc. Billerica, 10 Cook Street, Massachusetts 01821, USA
†Electronic supplementary information (ESI) available. See DOI: 10.1039/
d1nj01349a
Received 19th March 2021, Accepted 9th June 2021 DOI: 10.1039/d1nj01349a
rsc.li/njc
PAPER
Open Access Article. Published on 10 June 2021. Downloaded on 9/21/2021 12:33:38 PM. This article is licensed under a Creative Commons Attribution-NonCommercial 3.0 Unported Licence.
View Article Online
View Journal | View Issue
of ionisable molecules, solubility depends on the pH of the medium: acidic molecules have poorer solubility at acidic pH;
basic molecules at alkaline pH. For amphoteric molecules, the lowest solubility can be observed at their isoelectric point.12–14 The solubility of the unionized form of the compound can be described by the intrinsic solubility value (So).
Solubility measurement of polymorphs is often challenging since in the presence of solvent changes in the crystalline structure of the compound can be observed: the less stable form can be converted to the more stable form; depending on the solvent, a hydrate or solvate may be formed. Because of these phenomena, the solubility measurements of polymorphs must always be complemented by solid-phase analysis to identify the form present in the equilibrium.15
In this work, carvedilol was used as a model compound to study the possible behaviour of polymorphs in solubility experiments. Carvedilol (CAS No. 72956-09-3) is a non-selective beta-adrenergic receptor blocker and an alpha-adrenergic receptor blocker, that acts on the beta-1 receptors of the heart to produce negative inotropic and chronotropic effects.
Therefore it is primarily used to treat hypertension. However, due to its non-selective nature, it can cause bronchoconstriction on the beta-2 receptors in the lungs, which limits its applicability.16Carvedilol is known to have many polymorphic forms, in this study Form I and II were used.17–19Several studies published solubility data of carvedilol, but the intrinsic solubility values show poor reproducibility. The average value is logSo[M]:
5.35 0.47 (in-ADME Research).20 In the literature different methods (CheqSol, SSF method), buffers (NaOH/HCl solution, phosphate, acetate buffers, FaSSIF/FeSSIF media) and phase separation techniques (centrifugation, sedimentation, filtration) were described.21–25These circumstances can greatly influence the measured equilibrium solubility, so this work tried to avoid as many potential errors as possible.26 Therefore real-time monitoring was used via immersed UV probes, because it needed no phase-separation and the sensitivity of UV detection is appropriate to measure the concentration of carvedilol solutions.
This study aimed to follow the dissolution of the two polymorphs of the model compound in different buffer solutions using real-time monitoring, to determine the equilibrium solubility over a wide pH range and to obtain detailed information about supersaturation and the time needed to reach the equilibrium.
Furthermore, the reason for the poor reproducibility of the intrinsic solubility data found in the literature was also investigated.
2. Experimental section
2.1 Materials
The structure of the model compound is presented in Fig. 1.
Carvedilol was purchased from Merck KGaA. (Darmstadt, Germany). From the commercially available Form II, the other polymorphic form (Form I) was prepared in-house based on patents and literature data17–19 and was verified by X-Ray powder diffraction (XRPD) and differential scanning calorimetry (DSC) measurements. Distilled water of Ph. Eur. grade was used.
All other reagents were of analytical grade.
As solvent, two different buffer solutions were used: Britton–
Robinson (BR) buffer stock solution (a mixture of acetic acid, phosphoric acid, and boric acid, each at 0.04 M) and modified BR buffer, where 0.15 M KCl was added to the solution (BR + KCl).
The required amount of 0.2 M NaOH or 1 M NaOH was added to obtain the pH specified for the solubility experiments in the pH range 3–10.
2.2 Solubility measurements
2.2.1 In situ monitoring of the dissolution profile. The drug solution concentrationversustime was investigated with themDISS ProfilerTM. The operation of this device is based on UV spectrophotometry using fiber optic UV probes for in situ concentration measurements.27–29 The instrument measures the real-time concentration with fiber optic UV dip probe inserted in 6 temperature-controlled 20 mL vessels, stirred with a magnetic stirrer. Using the appropriate tips (2–5–10–20 mm pathlength) adjusted to the UV probe, the UV spectra were registered in the following timing protocol: 1 spectrum per 30 s in 0–1 h, 1 spectrum per 1 min in 1–6 h and per 2 min in 6–24 h periods. In some cases, the UV spectra were further registered at two points in a 24–66 h period. The stirrer was turned off 6 hours before the end of the measurements. For the evaluation of the concentration, previously determined calibration data and second derivative spectra were used. The calibration was performed using a DMSO stock solution for each UV dip probe separately. Equivalently small amount of this solution was added to all vessels, and after each step, the UV spectrum was registered. From the known concentration values and UV data, the calibration curve was determined with linear regression (R2Z0.9990 in each case). To get accurate concentration data the calibration was performed at each pH and buffers. The equilibrium solubility was also determined from the dissolution curve in some cases.
2.2.2 Equilibrium solubility.The equilibrium solubility of the samples in the examined pH region was determined by the SSF method. The sample was added in excess to the aqueous buffer solutions to produce a suspension. The amount of solid was accurately weighed: 10–16 mg/20 mL. At a controlled temperature of 25.0 0.1 1C, the solution containing solid excess of the sample was vigorously stirred generally for 60 hours (agitation time) followed by a sedimentation period of 6 hours before the end of the measurements. In special cases, where reaching the equilibrium lasted longer than 60 hours, longer measurement time was used.mDISS ProfilerTM Fig. 1 The structure of carvedilol.
Open Access Article. Published on 10 June 2021. Downloaded on 9/21/2021 12:33:38 PM. This article is licensed under a Creative Commons Attribution-NonCommercial 3.0 Unported Licence.
(Pion Inc. Billerica MA, US) was applied as the UV fiber optic instrumentation. The equilibrium concentration was concomi- tantly determinedin situ in the equilibrated solubility system (without dilution) by immersing the appropriate UV dip probe.
Calibration was performed with the same (2–5–10–20 mm) tip adjusted to the fiber optic UV dip probe which was used in the given solubility experiment. The concentration was determined by the AU Pro software (Pion Inc. Billerica MA, US) using the second derivative method in the range 278–289 nm.
2.3 Solid-phase analysis
2.3.1 Raman spectroscopy. At the end of the solubility measurement, a small amount of the solid phase was isolated and dried on a glass plate. Raman spectra were collected using a Horiba Jobin-Yvon LabRAM system coupled with an Olympus 97 BX-40 optical microscope (Olympus Corporation, Tokyo, Japan). The sample was illuminated by a 785 nm diode laser (TEC 510 type, Sacher Lasertechnik, Marburg, Germany) and an objective of10 (laser spot size, approximately 4mm) was used for optical imaging and spectrum acquisition. The laser beam was focused through the objective, and the backscattered radiation was collected with the same objective, a common configuration found in most confocal spectroscopic systems.
The collected radiation was directed through an edge filter that removed the Rayleigh photons and then through a confocal hole (500 mm) and the entrance slit (100 mm). Finally, a 950 groove per mm grating monochromator dispersed the Raman photons before reaching the CCD detector. Each spectrum of the image was collected in the spectral range of 300 to 1600 cm 1.
2.3.2 XRPD.X-Ray powder diffraction patterns were used to verify the results of the Raman measurements in the questionable cases and to collect more detailed information if needed. The same samples were used as in the case of Raman spectroscopy.
The measurement was carried out by a PANalytical (Amelo, The Netherlands) X’pert ProMDP X-ray diffractometer using Cu-Ka radiation (1.524 Å) and a Ni filter. The applied voltage was 40 kV, while the current was 30 mA. The samples were analyzed between 41and 4212Y.
2.4 Statistical analyses
Concentrations were expressed as means SD, and were compared using the ‘‘two-sample’’ Student’st-test. Differences were considered statistically significant whenpo0.05.
3. Results and discussion
Carvedilol is a non-selective b-receptor blocker drug used mainly as an antihypertensive agent in immediate-release (IR) tablets as a racemate of the free base form and in retard tablets as that of its phosphate salt, respectively. The compound belongs to the BCS II group having low solubility and high permeability.30Carvedilol is known to have many polymorphic forms, in this study Form I and II (nomenclature according to Pataki et al.17,18) were used. In recent literature, Form I is
referred as Form III.31Although Form I is more stable (melting point: 123–1261C), in marketed formulations Form II (melting point: 114–1151C) is used. Form I and Form II are monotropic forms.18 Carvedilol is a monoprotic base, (pKa: 8.06), its solubility is pH-dependent in the biorelevant pH range.
3.1 Real-time dissolution monitoring bylDISS Profiler The dissolution profile of the examined carvedilol polymorphs was followed in real-timeviaUV fiber-optic probes in BR or BR + KCl buffers. The dissolution kinetics was found highly different depending on the pH and the buffer solution.
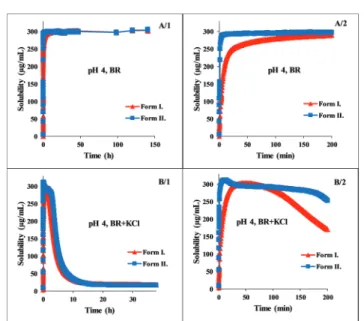
In Fig. 2 the dissolution kinetics of the two polymorphs in BR and BR + KCl buffer solutions can be seen at pH 4, which is representative of the acidic pH region. In the BR buffer, practically no difference could be observed, within 3 hours both forms reached the equilibrium solubility of the phosphate salt, which formed in the acidic range (pH 3–5). No change was observed until the end of the measurements (Fig. 2, A panel).
On the other hand in the BR + KCl buffer solution, Form II reached a higher supersaturation at 310mg mL 1and held it a bit longer before reaching the equilibrium solubility of the hydrochloride salt (Fig. 2, B/2 panel). From the dissolution profile, the time required to reach the equilibrium can be determined. It was less than 24 hours in the acidic pH region, so in this case, the use of the standard protocol (18 hours agitation time, 6 hours sedimentation) was found to be appropriate.10,12
At pH 8 (which represents the basic pH region), both Form I and Form II exhibit immediate dissolution with no or minimal supersaturation. Equilibrium solubility concentrations can be seen on the first panel of Fig. 3. The second panel shows the deviation between the dissolution of the two polymorphs in the first 15 hours. Not only lower equilibrium solubility, but also slower dissolution can be observed in the case of Form I. Both
Fig. 2 Concentration–time profile of carvedilol polymorphs at pH 4 in BR and BR + KCl buffers.
Open Access Article. Published on 10 June 2021. Downloaded on 9/21/2021 12:33:38 PM. This article is licensed under a Creative Commons Attribution-NonCommercial 3.0 Unported Licence.
Form I and II needed more than one day to reach equilibrium solubility, therefore measuring the concentration after 24 hours can lead to false solubility data. After one day, the concentration of the solution of Form I was 2.960.03mg mL 1, which is 14%
higher than the measured concentration at the real equilibrium.
In contrast, Form II slowly reached the equilibrium state without supersaturation, and the concentration obtained after 24 hours was 30% lower than the equilibrium solubility. In this basic region (pH 7–10) no salt formation could be observed.
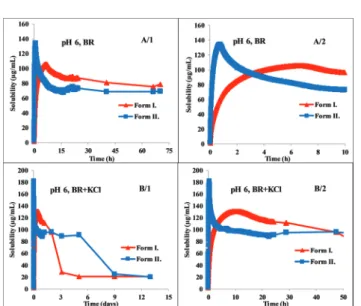
The greatest difference between the behavior of the two polymorphs can be observed at pH 6. Fig. 4 shows that Form
II exhibits immediate dissolution and reaches supersaturation with 135mg mL 1, atca.40 min. Form I dissolves much slower, producing a lower supersaturation atca.400 min (Fig. 4, A/2 panel). The total solubility-time profile (Fig. 4, A/1 panel) indicates that it precipitates quickly from the saturated solution but the system reaches the real solubility equilibrium state of the phosphate salt very slowly, during ca. 3 days.
Reaching the equilibrium state is even slower in the presence of KCl, where hydrochloric salt is forming at the end of the measurement. However, the kinetics in the first few hours is very similar to the dissolution profile in BR buffer solution (Fig. 4, B/2 panel). Form I reached the equilibrium in BR + KCl at ca. 5 days, in contrast, Form II needed even more time, approx. 9 days (Fig. 4, B/1 panel). This slow equilibrium can cause inaccuracy if the standard 24 hours protocol is applied.
In the BR buffer solution, the concentration of Form I after 24 hours is 85.95 3.74 mg mL 1, which is 20.9% higher than the real equilibrium concentration. This distortion is only 7.6% in the case of Form II. In BR + KCl, this deviation is significantly higher: the concentration of Form I after 24 hours is 112.01 5.81mg mL 1 and the concentration of Form II is 91.56 0.71 mg mL 1. It causes a more than 600% increase compared to the actual equilibrium solubility in the case of Form I and more than 500% in the case of Form II.
3.2 Solubility-pH profile of carvedilol polymorphs
The pH-dependent equilibrium solubility of carvedilol Form I and Form II was studied at 25 1C, in the pH 3–10 range, in BR buffer solutions (chloride ion free,I= 0.089 M) and also in pH 3–6.5 domain in BR buffer solutions using external salt (KCl) to adjust the ionic strength to 0.15 M. The average values of the solubility results inmg mL 1unit are collected in Table 1.
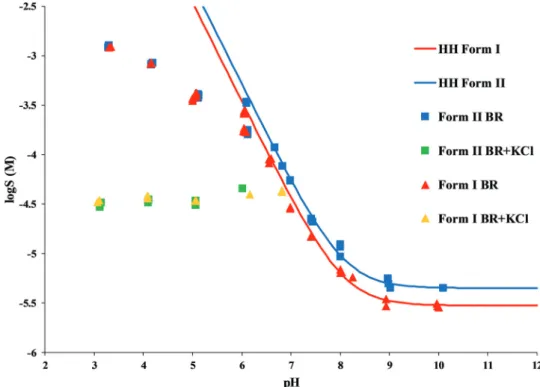
The standard deviation was found to be in the range of 1–35%, the average was 8%. A significant difference in equilibrium solubility of the two polymorphs was found in the pH range 7–10, Form II reached twice as high equilibrium concentration as Form I. This solubility ratio of polymorphs is in agreement with the general behavior of polymorphs reported in the literature.32The experimental data showed a perfect fit to the theoretical HH curve (logS[M]vs.pH, Fig. 5) between pH 7–10. At about pH 6.5, the measured solubility starts to deviate from the HH curve; in the presence of KCl, a constant Fig. 4 Concentration–time profile of carvedilol polymorphs at pH 6 in BR
and BR + KCl buffers.
Table 1 Equilibrium solubility of carvedilol polymorphs in BR and BR + KCl buffers measured bymDISS device
Sample pH SpHSD (mg mL 1) BR pH SpHSD (mg mL 1) BR + KCl Sample pH SpHSD (mg mL 1) BR pH SpHSD (mg mL 1) BR + KCl Form I 3.38 437.8432.64 3.08 13.540.45 Form II 3.30 491.4218.79 3.12 13.011.10
4.16 342.372.68 4.09 14.541.22 4.17 334.776.96 4.10 14.090.71
5.08 165.498.54 5.05 12.761.34 5.12 158.227.34 5.08 15.191.96
6.05 71.062.45 6.06 18.051.84 6.12 68.192.50 6.06 18.011.82
6.57 35.631.84 6.62 46.910.68
6.99 11.750.20 6.99 22.040.21
8.02 2.590.19 8.06 4.610.55
8.95 1.230.15 8.96 2.380.85
9.98 1.210.06 9.84 2.230.38
Fig. 3 Concentration–time profile of carvedilol polymorphs at pH 8 in the BR buffer.
Open Access Article. Published on 10 June 2021. Downloaded on 9/21/2021 12:33:38 PM. This article is licensed under a Creative Commons Attribution-NonCommercial 3.0 Unported Licence.
salt solubility can be observed at pH 3–6. This is a typical phenomenon when a salt starts to precipitate from the solution. In contrast, the equilibrium concentrations measured in the pure BR buffer at pH 3–6 show a continually increasing tendency and reach no constant value. Solid-phase analysis methods helped to identify which salt is formed in the different buffer media.
3.3 Characterization of the undissolved solid phase isolated from solubility measurements
In the pH range 7–10, the Raman spectra of the solid phase isolated from the solubility suspension after equilibration showed consentaneous characteristic peaks with the starting materials (Fig. 6). This supports that during the solubility Fig. 5 Solubility-pH profile of carvedilol Form I and Form II in BR and BR + KCl buffers (solid line represents the theoretical HH curve, points represent the experimental data).
Fig. 6 Raman spectra of original Form I, Form II and the solid phase of carvedilol polymorphs isolated from solubility suspensions from the measurements at pH 7 and 10.
Fig. 7 Raman spectra of carvedilol hydrochloride and the solid phase of carvedilol polymorphs isolated from solubility suspensions from the measurements at pH 3 and 5 in BR + KCl.
Open Access Article. Published on 10 June 2021. Downloaded on 9/21/2021 12:33:38 PM. This article is licensed under a Creative Commons Attribution-NonCommercial 3.0 Unported Licence.
experiments, the transition did not happen and the measured solubility belongs to the specified polymorph.
In the pH range 3–5, salt formation can be observed regardless of the starting polymorph, but in a different way in the two buffers used. Hydrochloride salt (Fig. 7) was identified from the BR + KCl buffer, while a phosphate salt from pure BR buffer, which was identified as carvedilol dihydrogen phosphate anhydrate (later referred as phosphate salt) based on information found in international patents.33,34
Since XRPD and Raman spectroscopy verified the identical composition of the precipitate from pH 3–5 BR solutions (Fig. 8), the increasing solubility with decreasing pH in this region (see Table 1 and Fig. 5) can be explained by the formation of solute aggregates or complexes with a buffer component.
At pH 6.5, the two polymorphs showed different behavior at the end of the solubility measurements in the BR buffer solution. Form II formed a phosphate salt. It can be observed that the Raman spectra and the XRPD diffractogram differ from that of the original Form II and show characteristic peaks with the phosphate salt. In contrast, Raman spectra and XRPD diffractogram of the sample from the end of the solubility measurements of Form I shows a good agreement with the original form, except one peak, which can be observed between 700 and 750 cm 1at the Raman spectra and between 17 and 19 2Yat the XRPD diffractogram (Fig. 9), and is characteristic to the phosphate salt.
In conclusion it can be stated, based on solubility and solid-phase measurements, that the solubility of Form I and carvedilol dihydrogen phosphate anhydrate is so similar, that Fig. 8 Raman spectra (left) and XRPD diffractogram (right) of carvedilol dihydrogen phosphate anhydrate and the solid phase of carvedilol polymorphs isolated from solubility suspensions from the measurements at pH 3 and 5 in BR.
Fig. 9 Raman spectra (left) and XRPD diffractogram (right) of carvedilol dihydrogen phosphate anhydrate, Form I, Form II and the solid phase of carvedilol polymorphs isolated from solubility suspensions from the measurements at pH 6.5 in BR.
Open Access Article. Published on 10 June 2021. Downloaded on 9/21/2021 12:33:38 PM. This article is licensed under a Creative Commons Attribution-NonCommercial 3.0 Unported Licence.
the original compound cannot be completely transformed into the salt at pH 6.5. It also means that the pHmax is slightly different in the case of the two polymorphs. The pHmaxrefers to the pH where both the phosphate salt and the carvedilol free base have equal solubilities. This phenomenon can be observed only in the BR buffer solution because in BR + KCl the solubility of the hydrochloride salt is much lower at this pH.
4. Conclusion
In this study, we have demonstrated that the poorly water- soluble carvedilol provides a good example that BCS II classi- fied drugs may need more than 24 hours to reach their equilibrium solubility. Factors like the type of polymorph, pH, and even the buffer composition can greatly influence the equilibration time. This can explain the different equili- brium solubility values of carvedilol published in the literature.
In the case of carvedilol, real-time monitoring of the dissolu- tion was found to be essential in order to measure the solubility at the true equilibrium.
The use ofin situUV probes enabled the measurement of concentration in real-time without sampling and sample pre- paration and provided a more in-depth knowledge of how the equilibrium is reached in case of different polymorphic forms.
In most cases, Form II showed a faster dissolution and reached a higher extent of supersaturation. The faster dissolution of Form II at biorelevant pHs explains the application of the less stable polymorph in solid formulations.
Author contributions
Do´ra Csicsa´k: investigation, formal analysis, visualization, writ- ing – original draft. Enik+o Borba´s: conceptualization, super- vision, writing – review & editing. Szabina Ka´da´r: supervision, project administration, formal analysis. Petra T+ozse´r: project administration, visualization. Pe´ter Bagi: investigation, formal analysis, visualization. Hajnalka Pataki: investigation. Ba´lint Sinko´: supervision, project administration. Krisztina Taka´cs- Nova´k: conceptualization, methodology, supervision. Gergely Vo¨lgyi: methodology, supervision, project administration, writ- ing – review & editing.
Conflicts of interest
There are no conflicts to declare.
Acknowledgements
Authors thank Dr Alex Avdeef (in-ADME Research, NY, US) for providing carvedilol literature solubility data from the Wiki-pSo Database and for the valuable discussion on the topic. Hajnalka Pataki is thankful for the Ja´nos Bolyai Research Scholarship of the Hungarian Academy of Sciences. This work was financially supported by the National Research, Development, and Innova- tion Office of Hungary (OTKA PD-121143). The research was
also supported by the U´NKP-20-5 and U´NKP-21-4 New National Excellence Program of the Ministry for Innovation and Tech- nology from the source of the National Research, Development, and Innovation Fund.
Notes and references
1 G. L. Amidon, H. Lennerna¨s, V. P. Shah and J. R. Crison, Pharm. Res., 1995,12, 413–420.
2 A. Avdeef,Absorption and Drug Development: Solubility, Per- meability, and Charge State, 2012.
3 T. L. Threlfall,Analyst, 1995,120, 2435–2460.
4 H. G. Brittain,Polymorphism in Pharmaceutical Solids, 2nd edn, 2016.
5 P. A. Pangarkar, A. M. Tayade, S. G. Uttarwar and R. S. Wanare,Int. J. Pharm. Technol., 2013,5, 2374–2402.
6 R. Eyjolfsson,Pharmazie, 2002,57, 347–348.
7 D. Tempfli, E. Borba´s, H. Pataki, D. Csicsa´k, G. Vo¨lgyi, B. Sinko´ and K. Taka´cs-Nova´k, Eur. J. Pharm. Sci., 2020, 149, 105328.
8 J. Bauer, S. Spanton, R. Henry, J. Quick, W. Dziki, W. Porter and J. Morris,Pharm. Res., 2001,18, 859–866.
9 A. J. Aguiar, J. Krc, A. W. Kinkel and J. C. Samyn,J. Pharm.
Sci., 1967,56, 847–853.
10 E. Baka, J. E. A. Comer and K. Taka´cs-Nova´k, J. Pharm.
Biomed. Anal., 2008,46, 335–341.
11 K. J. Box, G. Vo¨lgyi, E. Baka, M. Stuart, K. Taka´cs-Nova´k and J. E. A. Comer,J. Pharm. Sci., 2006,95, 1298–1307.
12 A. Avdeef, E. Fuguet, A. Llina`s, C. Ra`fols, E. Bosch, G. Vo¨lgyi, T. Verbic, E. Boldyreva and K. Taka´cs-Nova´k,ADMET DMPK, 2016,4, 117–178.
13 E. Shoghi, E. Fuguet, E. Bosch and C. Ra`fols,Eur. J. Pharm.
Sci., 2013,48, 291–300.
14 A. Pobudkowska and U. Doman´ska,Chem. Ind. Chem. Eng.
Q., 2014,20, 115–126.
15 M. Saifee, N. Inamdar, D. L. Dhamecha and A. A. Rathi,Int.
J. Health Res., 2009,2, 291–306.
16 D. McTavish, D. Campoli-Richards and E. M. Sorkin,Drugs, 1993,45, 232–258.
17 H. Pataki, I. Csontos, Z. K. Nagy, B. Vajna, M. Molna´r, L. Katona and G. Marosi,Org. Process Res. Dev., 2013,17, 493–499.
18 H. Pataki, I. Markovits, B. Vajna, Z. K. Nagy and G. Marosi, Cryst. Growth Des., 2012,12, 5621–5628.
19 A. G. Bubendorf, R.-D. Gabel, M. Henning, S. Krimmer, G. Neugebauer, W. Preis and A. Wirl, Eur. Pat., EP1432681B1, 2019.
20 Wiki-pSo Database. in-ADME Research, New York, USA.
21 D. Scho¨nherr, U. Wollatz, D. Haznar-Garbacz, U. Hanke, K. J. Box, R. Taylor, R. Ruiz, S. Beato, D. Becker and W. Weitschies,Eur. J. Pharm. Biopharm., 2015,92, 155–170.
22 C. A. S. Bergstro¨m, C. M. Wassvik, K. Johansson and I. Hubatsch,J. Med. Chem., 2007,50, 5858–5862.
23 Y. L. Hsieh, G. A. Ilevbare, B. Van Eerdenbrugh, K. J. Box, M. V. Sanchez-Felix and L. S. Taylor,Pharm. Res., 2012,29, 2738–2753.
Open Access Article. Published on 10 June 2021. Downloaded on 9/21/2021 12:33:38 PM. This article is licensed under a Creative Commons Attribution-NonCommercial 3.0 Unported Licence.
24 R. Hamed, A. Awadallah, S. Sunoqrot, O. Tarawneh, S. Nazzal, T. AlBaraghthi, J. Al Sayyad and A. Abbas,AAPS PharmSciTech, 2016,17, 418–426.
25 J. Ashok Kumar, S. Ramkanth, S. Lakshmana Prabu and V. Gopal,Int. J. Curr. Pharm. Rev. Res, 2015,6, 269–273.
26 G. Vo¨lgyi, D. Csicsa´k and K. Taka´cs-Nova´k,Eur. J. Pharm.
Sci., 2018,123, 98–105.
27 V. Bijlani, D. Yuonayel, S. Katpally, B. N. Chukwumezie and M. C. Adeyeye,AAPS PharmSciTech, 2007,8, 6–9.
28 K. Bynum, K. Roinestad, A. Kassis, J. Pocreva, L. Gehrlein, F. Cheng and P. Palermo,Dissolution Technol., 2001,8, 1–8.
29 V. A. Gray,Dissolution Technol., 2003,10, 33–36.
30 E. Borba´s, P. T+ozse´r, K. Tsinman, O. Tsinman, K. Taka´cs- Nova´k, G. Vo¨lgyi, B. Sinko´ and Z. K. Nagy,Mol. Pharmaceu- tics, 2018,15, 3308–3317.
31 L. D. Prado, H. V. A. Rocha, J. A. L. C. Resende, G. B. Ferreira and A. M. R. De Figuereido Teixeira,CrystEngComm, 2014, 16, 3168–3179.
32 M. Pudipeddi and A. T. M. Serajuddin,J. Pharm. Sci., 2005, 94, 929–939.
33 R. K. Thaper, M. D. Prabhvat, A. V. Mouneshwarachar, Y. D. Pawar, P. P. Daramwar and P. R. Upadhyay, WO2008093350A1, 2007.
34 J. Hildesheim, S. Finogueev, J. Aronhime, B.-Z. Dolitzky, S. Ben-Valid and I. Kor,US Pat., US7056942B2, 2000.
Open Access Article. Published on 10 June 2021. Downloaded on 9/21/2021 12:33:38 PM. This article is licensed under a Creative Commons Attribution-NonCommercial 3.0 Unported Licence.