Book of Proceedings International Conference on
LIVING LONGER, WORKING
SMARTER, AGEING WELL
Organised in the framework of the project
„EFOP-3.6.2-16-2017-00017 – Sustainable, intelligent and inclusive regional and city models”
Budapest, Hungary
May 18-19, 2020
2 This book of proceedings has been supported by the European Union, co-financed by the European Social Fund within the framework of the „EFOP-3.6.2-16-2017-00017 – Sustainable, intelligent and inclusive regional and city models” project.
Edited by Erzsébet Kovács
Programme Committee:
Éva Berde Ilona Cserháti Tibor Keresztély Erzsébet Kovács
Tibor Takács
Organising Committee:
Dávid Burka Anna Huszárik Erzsébet Kovács
Bettina Török Ágnes Vaskövi
Péter Vékás
ISBN 978-963-503-840-4
Published
3 by Corvinus University of Budapest
4 Session 1: Ageing, Mortality and Pension ... 5
Life Expectancy slowdown in V4 countries
Ján Gogola ... 6 Time transfers between elderly parents and their children: Hungary in European context Márton Medgyesi ... 13 Releasing the Potential in Human Resources
Gábor Vona ... 25 Empirical Evidence of the Rotation of the Age Pattern of Mortality Decline
Kolos Ágoston, Dávid Burka, Erzsébet Kovács, Ágnes Vaskövi, Péter Vékás ... 33 Analysis of elders’ habits in Europe according to results of time use surveys in 2010
Klaudia Máténé Bella, Zoltán Madari ... 46 Session 2: Labour market ... 53
Determinants of the Sustainability of Pension Systems in the V4 Countries
András Olivér Németh, Petra Németh, Péter Vékás ... 54 The potential of atypical work
Annamaria Kazai Ónodi, Sándor Holló ... 63 Is an older woman disadvantaged compared to her younger peer when employers make hiring decisions? – An experimental study on the Hungarian job market
Éva Berde, Mánuel László Mágó ... 71 Workplace flexibility, employee wellbeing and the possible macroeconomic impacts
Cserháti Ilona ... 83 Session 3: Well-being ... 98
The demographic dividend in Uzbekistan. What should we learn from the South Korean case?
Eva Berde, Muyassar Kurbanova ... 99 Country-level ESG indicators as Predictors of Social Well-Being?
Helena Naffa, Fanni Dudás ... 110 Intersection of Elderly Employment and Tourism – Opportunities for proactively addressing the challenges brought by aging societies
Edina Kovács, Kornélia Kiss, Zsófia Kenesei, Krisztina Kolos, Gábor Michalkó, Ivett Pinke- Sziva ... 116 Corporate Social Performance and Financial Profitability
Máté Fain ... 128 Lifestyle medicine – Can you create shareholder and employee value at the same time?
Péter Juhász, Ágnes Szabó ... 138
5
S ESSION 1: A GEING , M ORTALITY AND P ENSION
6
Life Expectancy slowdown in V4 countries
Ján Gogola
Institute of Mathematics and Quantitative Methods Faculty of Economics and Administration
University of Pardubice Czech Republic jan.gogola@upce.cz
Abstract
The main objective of the contribution is to show trends in life expectancy in Visegrád 4 (V4) countries in recent years. Life expectancy has increased in all OECD countries over the last few decades. Whilst life expectancy has increased steadily over time, there has been a slowdown in recent years. The aim of our contribution is to describe trends in recent years and then try to find which factors are behind these trends. To examine the slowdown in life expectancy improvements in recent years, changes in life expectancy at birth between 2002 and 2017 were chosen. Generally we can say that causes of this slowdown in life expectancy gains are multifaceted. Mortality at older ages is the primary driver of slowing improvements in life expectancy. It is unclear whether the current slowdown in mortality improvements is long-term trend or not. The slowdown has not been observed for long enough for statistical analysis to determine whether it will continue
Keywords: Life expectancy at birth, V4 countries
Introduction
Life expectancy is a key indicator for the overall health of a population. Life expectancy at birth measures how long, on average, people would live based on a given set of age-specific death rates. Japan, Switzerland, Spain lead a large group of OECD countries in which life expectancy at birth exceeds 80 years. Our contribution is focusing on central and east European countries especially the Visegrad group (V4) countries – the Czech Republic, Hungary, Poland and the Slovakia. In all V4 countries life expectancy is below the EU 28 average. The Czech Republic, Poland and Slovakia have life expectancy between 77 and 80 years. Hungary has the lowest life expectancy (Table 1.), at less than 76 years in 2017.
7 Life expectancy has increased in all OECD countries over the last few decades. In 2017, life expectancy at birth was 80.7 years on average across OECD countries, over 10 years higher than it was in 1970.
Whilst life expectancy has increased steadily over time, there has been a slowdown in recent years. Comparing the last five years (2012-2017) with a decade earlier (2002- 2007), V4 countries and OECD countries in average as well, experienced slower gains in life expectancy. These gains were slower for females than males. Naturally the question arises: Why have increases in life expectancy slowed down?
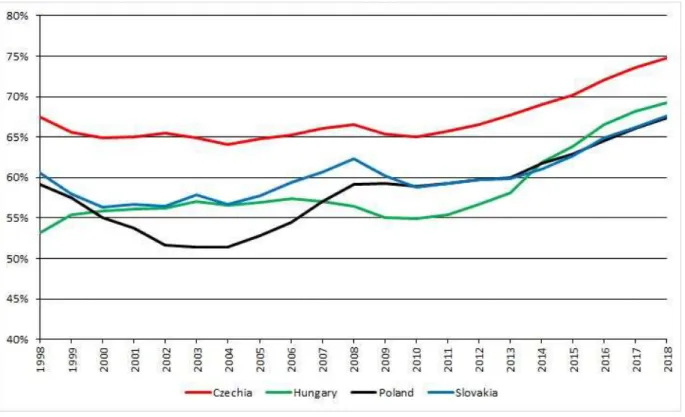
Figure 1. Life expectancy at birth – EU 28 average and V4 group countries (total) (2017)
Source: Author’s illustration by Eurostat and HMD (2019)
8 Table 1. Life expectancy at birth, 1970 and 2017 – EU 28 average and V4 group countries (total, male, female)
Life expectancy at birth, 2000 Life expectancy at birth, 2017 Total Male Female Total Male Female
EU 28 77,1 73,8 80,5 80,9 78,3 83,7
CZE 75,0 71,7 78,4 79,0 76,1 82,0
HUN 71,2 67,1 75,6 75,8 72,5 79,3
POL 73,7 69,7 78,0 77,7 73,9 81,8
SVK 73,0 69,1 77,2 77,2 73,8 80,7
Source: Eurostat and HMD (2019)
Firstly we look at the trends of life expectancy in V4 countries and then try to find which factors are behind these trends.
We need to emphasize that life expectancy gains fell on average across OECD countries in 2015. The reductions in case of V4 countries were 1.2 months in Poland and 2.4 months in the Czech Republic, Hungary and Slovakia.
Table 2. Slowdown in life expectancy gains, 2012-17 and 2002-2007 – EU 28 average and V4 group countries (total, male, female)
Change in life expectancy at birth, 2002-2007
Change in life expectancy at birth, 2012-2017
Total Male Female Total Male Female
EU 28 1,40 1,50 1,30 0,60 0,90 0,60
CZE 1,35 1,48 1,35 0,95 1,04 0,88
HUN 1,66 1,95 1,26 0,82 1,00 0,65
POL 1,22 1,31 1,12 1,03 1,27 1,02
SVK 1,33 1,55 1,07 1,05 1,27 0,82
Source: Eurostat (2019)
9 Table 3. Change in life expectancy at birth, 2014 to 2015 – OECD average and V4 group countries (total) – change in months
OECD CZE HUN POL SVK -1,00 -2,4 -2,4 -1,2 -2,4 Source: OECD Health Statistics (2019)
The causes of this slowdown in life expectancy gains are multifaceted. Among them belong slowing improvements in heart disease and stroke. Rising level of obesity and diabetes, as well as population ageing, have made it difficult for countries to maintain previous progress. There has been a substantial shift in the age structure of population in recent decades, the number and proportion of people older ages has increased. In recent decades, the share of the population aged 65 years or older has nearly doubled on average across OECD countries. The proportion of the population aged 65 years or over increased from less than 9% in 1960 to more than 17% in 2017. Between 2017 and 2050, the share of the population 80 and above will more than double on average in OECD countries, from 4,6% to 10,1%.
Gains in life expectancy at age 65 have slowed in recent years (exception is Slovakia) (Table 5.). Life expectancy at age 65 increased by 10 months on average in OECD countries between 2002 and 2017. Between years 2012 and 2017 this increase was just 7 months. The slowdown in life expectancy at age 65 in 2012-2017 compared with 2002-2007 may be partially explained by the severe influenza epidemic of 2014-2015, which affected frail and older populations in particular.
Table 4. Share of the population aged 65 and over – OECD average and V4 group countries (2017)
OECD CZE HUN POL SVK
17,4 % 19,0 % 18,8 % 16,7 % 15,3 % Source: OECD Health Statistics (2019)
Heart disease and stroke have partly determined the trend in mortality rates in older adults, other causes of death have influenced the trend in younger people. The cause of death that had the biggest negative impact on mortality rates among younger adults was accidental poisoning due to drug or alcohol.
10 Table 5. Slowdown in life expectancy gains – OECD average and V4 group countries (2017) - gains in months
OECD CZE HUN POL SVK 2002-2007 10,32 14,40 7,80 9,60 6,00 2012-2017 6,95 6,60 3,00 5,40 7,80 Source: OECD Health Statistics (2019)
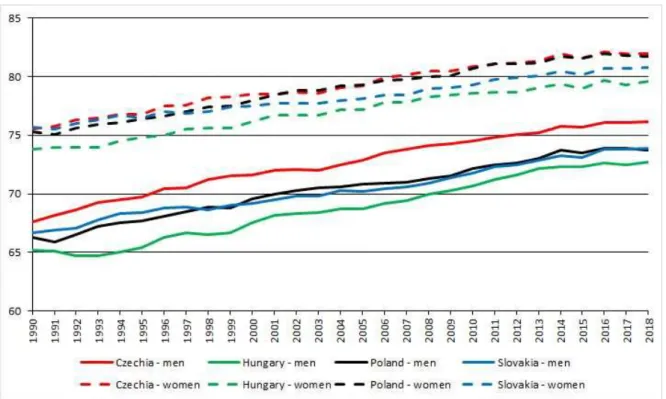
Figure 2. Life expectancy at 65 – EU 28 average and V4 group countries (2017)
Source: Author’s illustration by Eurostat and HMD (2019)
11 What is clear is that continued gains in longevity should not be taken for granted, with better protection of older people and other at-risk populations paramount to extending life expectancy.
Inequality in life expectancy has widened and the improvement in life expectancy has been slower in the more deprived areas than the less deprived area. In addition, female life expectancy in the most deprived areas has actually decreased.
There is a positive association between health spending per capita and life expectancy.V4 countries spend less than the OECD average and have lower life expectancy at birth.
The main conclusion from our contribution is that the overall slowdown in improvement is due to factors operating across a wide range of age groups, geographies and causes of death. It is not possible to attribute the recent slowdown in improvement to any single cause and it is likely that a number of factors, operating at the same time, need to be addressed. The slowdown has not been observed for long enough for statistical analysis to determine whether it will continue.
12
References
Eurostat - European Statistical Office, https://ec.europa.eu/eurostat
Human Mortality Database. University of California, Berkeley (USA), and Max Planck Institute for Demographic Research (Germany). Available at www. mortaliy.org.
Jindrová, P., Slavíček, O. (2012). Life expectancy development and prediction for selected European countries, 6-th International Scientific Conference Managing and Modelling of Financial Risk proceedings, p. 303-312, VŠB-TU Ostrava, ISBN 978- 80-248-2835-0.
OECD (2019), Health at a Glance 2019: OECD Indicators, OECD Publishing, Paris,
Raleigh, V. (2019). Trends in life expectancy in EU and other OECD countries:
why are improvements slowing?, OECD Health Working Papers, No. 108, OECD Publishing, Paris.
United Nations (2019). 2019 Revision of World Population Prospects, United Nations, available at https://esa.un.org/unpd/wpp
Author biographs
RNDr. Ján Gogola, Ph.D., Assistant professor of Mathematics at the Institute of Mathematics and Quantitative methods, Faculty of
Economics and Administration, University of Pardubice, Czech Republic Research fields: Theory of real functions, Actuarial mathematics.
He graduated from The Comenius University in Bratislava, Faculty of Mathematics, Physics and Informatics in 2008 with a degree of Ph.D. in Mathematical analysis. Previous work experience - 2004-2013: Assistant professor of Mathematics, University of Economics in Bratislava, Faculty of Business Informatics, Slovak Republic, Department of Mathematics.
13
Time transfers between elderly parents and their children: Hungary in European context
Márton Medgyesi TARKI,
Centre for Social Sciences Budapest
medgyesi@tarki.hu
Abstract
In times of population aging and its pressure on social security programmes it is particularly important to understand the determinants of intergenerational family transfers. Here we study exchanges of support between elderly parents and their children in Hungary, which is a rapidly ageing country with low level of public provision of long-term care services. We describe patterns of time transfers received from children using data from the Survey of Health Ageing and Retirement in Europe (SHARE) wave 4. One aim of the analysis is to situate Hungary among the transfer regimes typical in European countries and the other is to describe the main determinants of private transfers and compare Hungary to other EU countries.
Multivariate models of the probability of transfers were constructed with both parental and child characteristics as explanatory variables. Results showed that time transfers (personal care and household help) were received by the more „needy” parents, those living alone and having health problems. A gender bias in support was also evident:
parents were more likely to receive help and care from daughters compared to sons.
Eastern European countries are heterogeneous in terms of non-intensive support, but have generally high level of intensive support.
Keywords: intergenerational solidarity, population ageing, informal care
Introduction
In times of population aging and its pressure on social security programmes it is important to understand the interaction between family support and public redistribution. If ageing states are restricting public financing for pension and long-term
14 care policies, family transfers are also likely to change: the young might become more inclined to help elderly parents in need or the elderly people might be less able to support younger generations.
The study of transfers between generations is not only important for the understanding of family dynamics but also important to study the effect of public intergenerational transfers on elderly poverty or well-being. The social science literature draws the attention to the possible interaction between public and private intergenerational transfers: these can complement, displace or even reinforce each other. According to the crowding out hypothesis public and private transfers are substitutes and the effect of changes in public reallocations could be to a certain extent neutralized by changes in private transfers (Barro 1974). Increased social security payments might for example, cause children to reduce private transfers to their retired parents. According to the opposite hypothesis of „crowding in” public transfers might even increase family support (Kühnemund and Rein 1999). Interactions between family transfers and public policy programs mean that the overall effect of changes in public policy cannot be assessed without taking into account how family transfers react to those changes. It is thus important to learn about patterns and determinants of private transfers between elderly parents and their children.
In this study we describe patterns of time transfers between elderly parent and their children in Hungary using data from the Survey of Health Ageing and Retirement in Europe (SHARE) wave 4. We also study main determinants of private transfers and compare Hungary to other EU countries.
Research questions and hypotheses
Private transfers can come under various forms, like financial transfers, time transfers (caring for frail elderly, helping with household tasks, caring for grandchildren) or co- residence. Comparative analysis on patterns of private transfers in EU countries show that in Western industrialized countries intergenerational financial transfers typically flow downwards, which means that adult children receive financial transfers from their parents, whereas children support their aged parents by means of time transfers by providing elderly care and household help (Albertini et al. 2007, Albertini and Kohli 2013, Albuquerque 2014, Silverstein 2006). Empirical results show that daughters
15 support older parents more frequently and are more likely to provide intensive personal care than sons (Walker 1999, Brandt et al. 2012).
Research on private transfers acknowledges that the nature of interaction between private and public transfers depends on the motivation that drives family transfers.
According to the economics literature (see Laferrere and Wolff 2004) transfers motivated by altruism lead to public transfers crowding out private transfers. From the point of view of an altruist donor the important is the welfare of the recipient, thus the transfer will not take place if the recipient’s needs are satisfied by a public program. In contrast private transfers based on exchange will not be crowded out by public redistribution since welfare state programs enable individuals to engage in exchanges of support, which results in a higher level of private transfers overall. The sociological literature emphasises the role of reciprocity, norms and affection as important motivations of transfer behaviour (Kohli and Künemund 2001). Reciprocity - similarly to exchange - does not imply crowding out and transfers motivated by affection are not expected to be displaced by public programs either (Künemund 2008). Norms of responsibility however might be weakened if generous welfare state program are in place.
Regarding the determinants of private transfers, we build on hypotheses put forward in the social science literature. As mentioned before both economic and sociological studies of private transfers acknowledge the importance that “needs” of potential recipients play in decisions about transfers. Following this argument, we expect that transfers flow in the direction of family members who are in need because of poverty or health problems.
Others see private transfers as part of a reciprocal relationship between parents and children. Reciprocity as the norm of reciprocating for benefits received is most often understood as referring to symmetric relationships. The parent-child relation does not fit this requirement in the short term, since children are unable to reciprocate immediately transfers received during childhood, and elderly parents are unable to reciprocate for the care received. Nevertheless, some studies, like Leopold and Raab (2011) describe patterns of short-term reciprocity between children and their elderly parents.
16 Difference between countries in the frequency of private transfers can also result from difference welfare state involvement in elderly care. Leitner (2003) distinguishes three types of familialism in European countries based on welfare state arrangements for elderly care. In explicitly familialistic countries such as Germany, Austria, France and Belgium responsibility for elderly care is assigned to the family. These countries provide limited access to public services, impose legal obligations on children to finance professional care for the elderly and support family care with public transfers.
Implicitly familialistic countries (Southern European states, Poland) assign to the family not only to finance, but also to provide elderly care for parents. These countries neither provide public services or cash for care schemes. The Scandinavian countries and the Netherlands belong to the group of “optional familialism”. These countries provide generous public services to dependent elderly and there are also public transfers for those who engage in caring for dependent family members. There is no legal obligation of family members to care for the elderly.
In Hungary public services in elderly care (institutional care, home care, meals-on- wheels) are scarce, and there is considerable unmet need for long-term care services (Czibere and Gál 2010). There is no explicit cash-for-care scheme, although the public transfer “ápolási díj” (nursing fee) allows for eligibility of those caring for dependent adult family member in special cases. Overall, the bulk of LTC activities is left to households or an informal market. Thus Hungary belongs to the group of implicitly familialistic countries, but with an important difference compared to the Southern European states: coresidence between parents and their elderly children is less frequent.
Data and measurement
The Survey of Health, Ageing and Retirement in Europe (SHARE) is a multidisciplinary and cross-national panel database of micro data on health, socio-economic status and social and family networks of more than 55,000 individuals from 20 European countries aged 50 or over. In 2011, Estonia, Hungary, Portugal and Slovenia joined SHARE wave 4, which is the third regular panel wave of the survey. Wave 4 contains data for 16 European countries. The survey is probably the richest data on intergenerational private transfers between the elderly and their adult children. The respondent is defined as recipient of time transfer from children if he or she has been receiving personal care
17 or practical help from children living outside the household or received regular personal care from children living inside the household. Time transfers given to children are based on similar items referring to transfers given but also include time spent with looking after grandchildren.
In the analysis we are analysing private transfers from the respondent’s perspective.
In case of upward transfers this is the recipient’s perspective, while in case of downward transfers this is the donor’s perspective. The unit of analysis is the elderly respondent and his or her spouse/partner, if living in the household. Children mean biological children, step-children and sons and daughters-in-law aged 18 years or above. Both coresident and independent children are included. Results were obtained with the use of the household weight
The SHARE survey contains a wide array of variables regarding the respondent’s socio-economic background, health status, health care, health behaviour, employment, income, wealth and assets, social networks and attitudes. A great advantage of the dataset that it provides also extensive information on the respondent’s children as well. The “family respondent” is also asked about age, gender, marital status, education, employment of the respondent’s children.
As measures of parental need we include a measure of difficulties with activities of daily living (ADL), as representing the number of activities the respondent has difficulties with among dressing, bathing, toileting, getting in and out of bed, walking across room, eating. We also include a scale measuring difficulties with instrumental activities of daily living (IADL), which counts the activities the respondent has difficulties with (activities on the list are the following: using a map, preparing hot meal, shopping for groceries, making telephone calls, taking medication, work around the house or garden, managing money). Need for support is also related to the income situation of the elderly. Income is measured as equivalised household income, calculated by dividing household income with the square root of household size.
Parental control variables are age, household structure (single woman, single man, couple, other household structure), education (primary, secondary, tertiary), employment status (not working, working). Variables describing children (all information refers to children above age of 18) are number of children, percentage of female children, average age of children, percentage of coresident children,
18 percentage of non-coresident children living in close proximity (between 1-5 km) to parents, percentage of children with tertiary diploma, percentage of children in employment and the number of grandchildren.
Results
Descriptive results
Here the focus is on support between parents and their children, thus the sample is constrained to households with children. Differences in childlessness are shown in Figure A1 of the Annex. Childlessness is most important in Switzerland, Austria and Belgium where more than 15% of the households do not have children.
First we compare the percentage of those receiving or giving support. The percentage of those 50+ receiving personal care or household help from their children during the year preceding the interview was the highest in the Czech Republic, where 25% of households with children have received such support. Italy, Estonia, Denmark and Hungary follow with percentages between 15 and 20%. Lowest occurrence of support from children to parents was found in Switzerland, the Netherlands, Slovenia and Portugal, where less than 8% of households with children.
In most of the countries giving time transfers (personal care, household help and looking after grandchildren) to children is equally or more frequent among those 50+
as receipt of support. In countries such as Slovenia, Belgium or Poland the percentage of those giving support is 5-7% higher than the percentage of support recipients. In the Czech Republic, Estonia, Germany and Italy the opposite is true: the occurrence of support receipt is higher than the frequency of support giving. In Hungary the receipt of support from children and giving support to children occurs with the same frequency:
in nearly 15% of the cases. With this percentage Hungary is among the countries with relatively high frequency of parent child transfers of support.
19 Figure 1. Percentage of households receiving (giving) support from (to) children (among households with children)
Source: own calculation based on SHARE wave 4.
There is a strong age profile of parent-child transfers. Support given by parents becomes less frequent with age, while support received by parents becomes more frequent with age. The percentage of parents giving support to children declines from 19% (among those below 60) to 7% (among those over 70). Parallel to this the percentage of parents receiving support increases from 7% to 30%.
Results of multivariate regression analysis
We use probit models to study the role of explanatory factors in determining the probability of private time transfers. First we study the determinants of private transfers among all 50+ respondents in Hungary (see Table 1.). In case of support received by parents, significant predictors are those related to parental need, such as marital status and health limitations. Elderly living with their spouse or partner are less likely to receive personal care/household help from their children. Living in couple decreases the probability of receipt of support by 7% points compared to the single elderly. Health limitations increase the probability of support receipt. A one-point increase on the ADL scale results in a 2.4 points increase of the probability of receiving support, while one point increase on the IADL scale increases the likelihood of support by 4 points.
0.0%
5.0%
10.0%
15.0%
20.0%
25.0%
30.0%
CH NL SI PT FR BE AT SE ES PL DE HU DK EE IT CZ Received Given
20 Table 1. Probit estimates of transfer determinants (average marginal effects)
Parents aged 50+ Parents aged 65+
Received from children
Given to children
Received from children
Given to children Parent characteristics
Age (years) 0.0033 -0.0075*** 0.0080* -0.0059
Household structure (ref. cat: single man)
Single woman 0.0300 0.0558 0.0646 0.0922
Couple -0.0698* 0.0507 -0.1190* 0.0957
Other hhd str -0.0484 0.0727 -0.0494 0.1200
Education level (ref. cat: primary education)
Secondary ed. -0.0362* -0.0102 -0.0223 -0.0255
Tertiary ed. -0.0376 -0.0067 -0.0378 0.0005
ADL 0.0239*** 0.0236* 0.0233* 0.0234
IADL 0.0380*** -0.0245** 0.0542*** -0.0293**
Working -0.00536 -0.0774** 0.0870 0.0152
Household income (ref. cat: 1st quintile)
2nd quintile 0.0255 0.0184 0.0270 0.0378
3rd quintile 0.0208 -0.0109 0.0141 0.0025
4th quintile 0.0026 -0.0260 -0.0159 -0.0357
5th quintile 0.0074 0.0327 0.0547 0.0320
Characteristics of children aged 18+
Number of children 0.0163 0.0016 0.0270 -0.0049
% female 0.0423* 0.0552* 0.0298 0.0056
% coresident 0.0379 0.0813* 0.0762 0.0265
% living close 0.0268 0.1130*** 0.0273 0.0929**
% w. diploma 0.0145 0.0020 0.0057 0.0186
% working 0.0229 0.0060 0.0154 -0.0504
Average age 0.0003 0.0026 -0.0016 -0.0011
No. of grandchildren -0.0008 0.0105* -0.0052 0.0021
N 1741 1739 845 844
Pseudo R-sq 0.2198 0.0587 0.2131 0.0767
Note: * p<0.05, ** p<0.01, *** p<0.001 Source: own calculation
Among child variables the only significant predictor is the percentage of female children among all children. If the percentage of female children goes from 0% to 100%, the probability of parents receiving support increases by 4% points.
Parental support given to children is associated with parental age and employment. An increase in the age of parents by 10 years decreases the probability of parent providing support to children by 8% points. Employed parents are 8% points less likely to provide support to their children. Parental support to children is positively related to proximity
21 with children. If all children are living in the same household with the parent, the probability of parents providing support is 8% points higher compared to the case when all children are living in independent households. The probability of parental support to children also increases if there are more daughters among the children. As parental support to children is frequently associated with care for grandchildren it is not surprising to see that the number of grandchildren has a positive effect on the probability of transfers.
As we have seen earlier, private transfers between parents and children have a strong age profile. In order to see whether determinants of transfers are different in by age groups, we have repeated the analysis for those aged 65 or over. Unfortunately, sample size does not permit to select a higher age group. Main results are similar to those seen earlier, although some effects are not statistically significant due to less precise estimates. Parental receipt of support is most strongly associated with parental health measures and marital status. Parental gift of support is more frequent if children live closer.
Conclusions
In this study we have described patterns of time transfers between elderly parents and children and compared these to other European countries. The comparison showed that the frequency of support received from children and given to children is relatively high in Hungary when compared to the other EU countries participating in the study.
The relatively high frequency of personal care and practical household help was expected as the involvement of the welfare state in elderly care is low.
As determinants of support received by parents from children we showed that factors associated with parental need (living alone, limitations in daily activities) have the strongest effect on support received. The analysis revealed that time transfers given to children are determined by parental availability (relatively young, not in employment) and also proximity to children.
22
References
Albertini, M.; Kohli, M.; and Vogel, C. (2007): „Intergenerational transfers of time and money in European families: common patterns different regimes?” Journal of European Social Policy 2007; 17; 319
Albertini, M; Kohli, M (2013): „The generational contract in the family: An analysis of transfer regimes in Europe” European Sociological Review Vol. 29, No. 4, pp. 828-840.
Albuquerque, P.C. (2014): „Intergenerational private transfers. Portugal in the European context” European Journal of Ageing, published online 29 October 2014
Arrondel, L. and Masson, A. (2004): „Altruism, Exchange and Indirect Reciprocity: What do the Data on Family Transfers Show?” In: Kolm, S.C. és Mercier- Ythier (eds.): Handbook on the Economics of Giving, Reciprocity and Altruism. North- Holland.
Attias-Donfut, C. and Wolff, F.C. (2000): „Complementarity between private and public transfers” in: Attias-Donfut, C. and Arber, S. (eds): The Myth of Generational Conflict. Routledge.
Barro, R. J. (1974): „Are Government Bonds Net Wealth?” Journal of Political Economy Vol. 82, pp. 1095-117.
Brandt, M; Schmid, T; Haberkern, K (2012): „Gendered support to older parents:
do welfare states matter?” European Journal of Ageing Vol. 9, No. 1, pp. 39-50.
Czibere, K. and Gál, R. (2010): „The long-term care system for the elderly in Hungary” ENEPRI Research Report No.79, ANCIEN project.
Dykstra, P.A. (2009): „Intergenerational relationships in ageing societies” United Nations Economic Commission for Europe Working Group on Ageing, ECE/WG .1/2009/3.
Kalmijn, M., Saraceno, Ch. (2008): „A comparative perspective on intergenerational support. Responsiveness to parental needs in individualistic and familialistic countries” European Societies Vol. 10, pp. 479-508.
23 Kohli, M. (1999): „Private and public transfers between generations: Linking the family and the state” European Societies, Vol.1, No. 1, pp. 81-104.
Kohli, M. and Künemund, H. (2001): „Intergenerational transfers in the family:
What motives for giving?” in: Bengtson, V.L. és Lowenstein, A. (eds.): Families, ageing and social supports: International perspectives. Hawthorne, Aldin de Gruyter.
Künemund, H. and Rein, M. (1999): „There is more receiving than needing:
theoretical arguments and empirical explorations of crowding in and crowding out”
Ageing and Society Vol.19, pp. 93-121.
Künemund, H. (2008): „Intergenerational relations within the family and the state” In: Chiara Saraceno (ed.): Families, ageing and social policy - Intergenerational solidarity in European welfare states. Cheltenham: Edward Elgar, 105-122.
Laferrere, A. and Wolff, F-C. (2004): „Microeconomic models of family transfers”
in: Kolm, S.C. and Mercier-Ythier (eds.): Handbook on the Economics of Giving, Reciprocity and Altruism. North-Holland.
Leitner, S. (2003): „Varities of familialism. The caring function of the family in comparative perspective” European Societies Vol. 5, No. 4, pp. 353–375.
Leopold, T. and Raab, M. (2011): „Short-Term Reciprocity in Late Parent-Child Relationships” Journal of Marriage and Family Vol. 73, pp. 105 –119.
Silverstein, M. (2006): „Intergenerational Family Transfers in Social Context” in:
Binstock, R.H. and George, L. (eds): Handbook of Aging and the Social Sciences, 6th edition, Academic Press.
24
Author biographs
Marton Medgyesi is senior researcher at TARKI, Social Research Institute and also holds a part-time position at the Centre for Social Sciences, Hungarian Academy of Sciences Centre of Excellence. He obtained an MSc in Applied Economics from SciencesPo Paris and a PhD in Sociology from Corvinus University in Budapest. His main research interests include the study of income inequality, intergenerational transfers in the family and the welfare state and attitudes (eg. inequality tolerance, trust). Marton also regularly lectures on social inequality at the Corvinus University.
25
Releasing the Potential in Human Resources
Gábor Vona
Doctoral School of Business and Management Corvinus University of Budapest
Budapest, Hungary gabor.vona@uni-corvinus.hu
Abstract
Background: A new generation of inequalities within and between countries is emerging with divergence in enhanced capabilities (e.g. access to quality health).
These discrepancies have to be reduced in order to fulfil the 3rd Sustainable Development Goal of Ensuring healthy lives and promoting well-being for all at all ages.
Objectives: This article aims at investigating the theoretical maximum of healthy life expectancy at birth for 2016 and possible required measures for obtaining it.
Methods: Calculations were based on ordinary least squares linear regression and hypothesis testing of two independent subsamples.
Results: The theoretical maximum of 76.7 years bears a potential of 9.9 years for Hungary. The nature of the main recommendations is either primarily related to the health system or it can be considered as comprehensive.
Conclusions: The first group encompasses an effective public health care and more prevention in order to cut down lifestyle risk factors, shifting from hospital services towards outpatient services, and preferring day surgery within inpatient services. The second category is composed of spreading sustainable consumption patterns (including that of pharmaceuticals), eliminating environmental harms, and mitigating the education gap in life expectancy through augmented expected years of schooling.
Keywords: healthy life expectancy at birth, sustainability, human resource
26
Introduction
By designating the direction of the research and carrying out the analysis, the applied approach was inspired by the endeavour of “Enabling everyone to lead a long and healthy life”. Hence, the predominant focus is on improving the Healthy life expectancy at birth1, which can be considered as enhanced capability with divergence within and between countries opposite to the basic capability indicator Life expectancy at birth2, which demonstrates slow convergence thanks to the declining inequalities.3
Two research questions were formulated:
1. What was the theoretical maximum of the Healthy life expectancy at birth in 2016?
2. By means of which major measures can this maximum be achieved?
The literature review with regard to the healthy life expectancy disclosed similar studies focusing on life expectancy or on healthy life expectancy from diverse points of view and identified a presumed gap in the research field. For instance, van Hedel et al.
examined the association between education and mortality in the United States and 7 European countries.4 Lhachimi et al. estimated the potential gains in life expectancy and in morbidity-free life expectancy for 11 EU countries by assuming best practice lifestyle risk factors.5 Loichinger and Weber compared the working life expectancy at age 50 with healthy life expectancy.6 Nonetheless, I did not find any articles from the last 5 years, which would handle the estimated maximum of the healthy life expectancy at birth in EU countries through the complex lens of sustainable development and would attempt to quantify the contribution of the particular components.
1 Healthy life expectancy at birth: “Average number of years that a person can expect to live in full health by taking into account years lived in less than full health because of disease and injury.” (UNDP-HDR, 2018, pp. 53.) Its value varies mainly between 68 and 56 years across the Earth. (UNDP-HDR, 2019, pp. 38.)
2 Life expectancy at birth: “Number of years a newborn infant could expect to live if prevailing patterns of age-specific mortality rates at the time of birth stay the same throughout the infant’s life.” (UNDP-HDR, 2018, pp. 25.)
3 (UNDP-HDR, 2019, pp. 6-9., 228.)
4 They concluded that “the larger educational inequalities in mortality in the United States than in many European countries suggest that policies (within and outside the health sector) that address this inequality and the health of the most disadvantaged groups might contribute to improve overall population health in the United States.” (van Hedel & al., 2015, pp. 112., 118.)
5 (Lhachimi & al., 2016, pp. 739-741.)
6 Their difference in Europe ranges between 0.5 and 12 years for men, whereas it is 3-17 years for women. (Loichinger & Weber, 2016, pp. 1203.)
27
Data analysis and findings
Determining the theoretical maximum of the healthy life expectancy at birth
Based on 29 countries7, the following Ordinary Least Squares Linear Regression model can be built on the Preventable causes of mortality8 (X1) and the Ambient and household air pollution attributable death rate9 (X2) as predictors for estimating the Healthy life expectancy at birth10 (Y):
𝑌 = 𝛽 + 𝛽 ∙ 𝑋 + 𝛽 ∙ 𝑋 = 76.6576 − 0.0279 ∙ 𝑋 − 0.0149 ∙ 𝑋
The confidence interval of the intercept at a significance level of 5% is [76.0854;77.2297] years. The R square is 95.84%, the adjusted R square is 95.52%, and all beta parameters are significant. At the state of medicine in 2016, the intercept indicates the maximum11, which is equivalent to a potential of 9.86 years in case of Hungary. The model underestimates the Hungarian fact value (66.35 = 𝑌 < 𝑌 = 66.8), for this reason, the decomposition of the potential can be calculated as follows:
Cutting back all preventable causes of mortality by dint of effective primary prevention and public health care: 𝑎𝑏𝑠 𝛽 ∙ 𝑋 ∙ = 8.68 years
Eliminating environmental harms: 𝑎𝑏𝑠 𝛽 ∙ 𝑋 ∙ = 1.18 years
7 EU-27 (Bulgaria was removed in order to improve the fit of the model), plus Norway and Iceland.
8 “Preventable mortality is defined as death that can be mainly avoided through public health and primary prevention interventions. Treatable (or amenable) mortality is defined as death that can be mainly avoided through health care interventions, including screening and treatment. Both indicators refer to premature mortality (under age 75). The data is based on the revised OECD/Eurostat lists.”
Preventable causes of mortality (2016): (OECD/EOHSP, 2020, Figure 10)
9 In order to disclose the interrelatedness between the healthy life expectancy at birth and a restored ecosystem without disturbing effects on the human organisation, the benefits arising from the elimination of air pollution were estimated by assuming that air pollution comprises the majority of the causes of mortality attributable to environmental harms.
Ambient and household air pollution attributable death rate (2016): (WHO, 2020)
10 Healthy life expectancy at birth (2016): (UNDP-HDR, 2018, pp. 50-51.)
11 Many alternative models were created for validating the result for the maximum of the Healthy life expectancy at birth by relying on two data sources with various composition and more predictors.
28 Regarding the lifestyle risks12, mitigating Dietary risks, Alcohol consumption and risks arising from Low physical activity could favourably influence the Healthy life expectancy at birth as shown in Table 1.
Table 1:
Relationship between Lifestyle Risk Factors and the Relevant Variables Correlation Coefficient
(Pearson)
Healthy Life Expectancy at Birth
Preventable Causes of Mortality
Dietary Risks -89.99% +85.78%
Alcohol Consumption -58.26% +62.29%
Low Physical Activity -73.81% +70.03%
Source: Author’s compilation (2020)
Shifting from inpatient towards outpatient services, preferring day surgery
In order to estimate the recommended level for the ratio between Outpatient care and Inpatient care, the 29 previous countries were aligned in ascending order according to their healthy life expectancy at birth. Both the cumulative average healthy life expectancy at birth and the cumulative average ratio (Expenditures on outpatient care per capita / Expenditures on inpatient care per capita13) were weighted based on the total population14 of the underlying countries. Although the trendline is not monotonous, the proposed ratio is above 105%. Two-sample asymptotic z tests confirm that the mean of the country group with higher ratio exceeds that of the country group with lower ratio. Nevertheless, these results are valid on aggregated level, which view alleviates the influence of country-specific circumstances (e.g. effects of climate).15
12 Estimates of the Lifestyle risk factors (2017) are provided by the Institute for Health Metrics and Evaluation: (OECD/EOHSP, 2020, Figure 5)
13 Health expenditures by function of health care (2017): (OECD/EOHSP, 2020, Figure 8)
14 Total population (2016): (World Bank Group, 2020)
15 Particular cases (like France) serve as counter-examples for that the preponderance of inpatient care may lead to high healthy life expectancy at birth but revising the allocation of expenditures may enhance efficiency similar to the case of the excelling Spain. By applying a low ratio of 92.75%, Hungary performs 66.8 years of healthy life expectancy at birth, which could be ameliorated by means of a reconsidered distribution of health expenditures in favour of outpatient services.
29 16 main and 4 sub-procedures16 were analysed whether they offer the opportunity for an enlarged proportion of day surgery: either a convergence towards 100%, or a considerable potential for growth proves to be feasible in numerous cases.17 The relationship between the healthy life expectancy and the share of day cases finds evidence in a positive medium correlation.18
Responsible consumption patterns
The 12th Sustainable Development Goal envisages ensuring sustainable consumption and production patterns, which embody avoiding overconsumption of medicaments as well. The interrelatedness between the Healthy life expectancy at birth (Y – dependent variable) and the Expenditures on pharmaceuticals and medical devices19 (X - predictor) is scrutinised by dividing the countries into two groups (whether the healthy life expectancy exceeds 71.5 years) as two distinct phenomena prevail. The first cluster contains selected best practice Mediterranean and Scandinavian countries where the healthy life expectancy at birth reached at least 71.8 years, whilst the second one incorporates members joined the EU in 2004 and thereafter. The efficient medical consumption patterns of 2017 can be demonstrated by virtue of the equations below:
• above 71.5 years20: Y = 0.0102 · X + 68.270 (R square: 86.12%, adjusted R square: 82.65%, both beta parameters are significant);
• below 71.5 years21: Y = 0.0151 · X + 63.335 (R square: 70.67%, adjusted R square: 63.33%, both beta parameters are significant).
Hungary’s figure of 448.89 EUR represents a level of expenditures, which could enable – in case of efficient use and treating health problems not symptom-centric – to maintain a healthy life expectancy at birth of 70.1 years in a newcomer country or even 72.8 years in a more developed state. The two functions draw the attention to the dissimilarity of views and raise the question of the nature of the process of catching- up, i.e. whether the former satellite countries and several Western nations will be able to follow the traces of best practice states and to increase the healthy life expectancy
16 Total number of procedures, Number of day cases, Share of day cases (2016): (OECD.Stat, 2020)
17 Example for the first group: Cataract surgery (Hungary: 54.9%, OECD average: 64.7%, countries above 95%: Spain, United Kingdom, etc.). Example for the second one: Inguinal hernia, Tonsillectomy.
18 Its value lies between +0.318 and +0.436. The range of the number of OECD countries: 22-28.
19 Health expenditures by function of health care (2017): (OECD/EOHSP, 2020, Figure 8)
20 Best practice countries: Denmark, Iceland, Italy, Norway, Spain, Portugal.
21 Best practice states of the ancient Eastern Bloc: Croatia, Czech Republic, Estonia, Poland, Romania, Slovenia.
30 at birth without an unjustified and thus avoidable medicament overconsumption. In addition, the models anticipate that the higher the achieved healthy life expectancy amounts, to the less extent medical products, appliances and equipment can contribute to the further increment in the healthy life expectancy.
The responsible consumption patterns shed light on the expansion of overweight (including obesity). Its measured and self-reported percentage22 varied between 41.8%
and 72.5% among adults in 2017 in the 26 European OECD countries, while the example of Japan (25.9%) and South Korea (33.7%) testify that a viable compromise does exist, if efforts are complemented by the fight against food waste and malnutrition.
Mitigating the education gap
23in life expectancy
The education gap in life expectancy at age 30 was 12.6 years for men and 6.4 years for women in 2016 in Hungary. Bifurcating the sample consisting of 21 European countries into more and less developed societies according to the education gap, a significant difference in the mean of the expected years of schooling24 for males can be perceived. In order to overcome its education gap, Hungary should amplify the expected years of schooling for males from 14.8 years to 16.5-16.8 years.25 Concerning females, the relation between the education gaps can not be underpinned with the expected years of schooling. However, Hungary should advance by raising this indicator from 15.4 years to 17.2-17.4 years in order to attain the average.
Conclusions
The study revealed the maximum theoretical potential of healthy life expectancy at birth for 2016, moreover, additional yearly accrual can be realised in the future. If the individuals become more conscious and take more responsibility for their health status and the environment, it is possible to release the uttermost part of the potential through
22 Overweight including obesity among adults by sex, measured and self-reported (2017 or nearest year): (OECD iLibrary, 2020)
23 “High education is defined as people who have completed a tertiary education (ISCED 6-8) whereas low education is defined as people who have not completed their secondary education (ISCED 0-2).”
(OECD/EOHSP, 2020, Figure 2) The education gap equals to their difference.
Education gap in life expectancy at age 30 (2016 or available year): (OECD/EOHSP, 2020, Figure 2)
24 Expected years of schooling: “Number of years of schooling that a child of school entrance age can expect to receive if prevailing patterns of age-specific enrolment rates persist throughout the child’s life.”
(UNDP-HDR, 2018, pp. 25.)Expected years of schooling (2017): (UNDP-HDR, 2018, pp. 34.)
25 The share of males was determined from that of females within the population. Female population (%
of total population) (2016): (World Bank Group, 2020)
31 prevention and effective public health interventions, plus greening each sector. A new quality-oriented system approach within the inseparable society-environment- economy framework is required: the emphasis should be put on the improvement of the healthy life expectancy in lieu of that of the life expectancy so that the growth in healthy life expectancy can surpass that in life expectancy. The convergence between the two indicators necessitates the active participation of the individuals who can, in turn, only benefit from this process.
References
Lhachimi, S. K. et al. (2016), "Potential health gains and health losses in eleven EU countries attainable through feasible prevalences of the life-style related risk factors alcohol, BMI, and smoking: a quantitative health impact assessment", BMC Public Health, Vol. 16, Article number 734, pp. 1-11., available at:
https://doi.org/10.1186/s12889-016-3299-z (14 April 2020)
Loichinger, E., Weber, D. (2016), "Trends in Working Life Expectancy in Europe", Journal of Aging and Health, Vol. 28, Article number 7, pp. 1194-1213., available at:
https://journals.sagepub.com/doi/pdf/10.1177/0898264316656509 (14 April 2020) OECD.Stat (2020), "Health Care Utilisation: Surgical procedures", available at:
https://stats.oecd.org/index.aspx?queryid=30167 (07 April 2020)
OECD iLibrary (2020), "Figure 4.11 Overweight including obesity among adults by sex, measured and self-reported, 2017 (or latest year)", available at:
https://doi.org/10.1787/888934015467 (07 April 2020)
OECD/EOHSP (2020), "Country Health Profile of Hungary", available at:
http://www.oecd.org/health/Country-Health-Profiles-2019-Hungary.xls (11 January 2020)
UNDP-HDR (2018), "Human Development Indices and Indicators 2018 Statistical Update", available at:
http://hdr.undp.org/sites/default/files/2018_human_development_statistical_update.p df (05 January 2019)
UNDP-HDR (2019), "Human Development Report 2019", available at:
http://hdr.undp.org/sites/default/files/hdr2019.pdf (10 January 2020)
van Hedel, K. et al. (2015), "The Contribution of National Disparities to International Differences in Mortality Between the United States and 7 European Countries",
32 American Journal of Public Health, Vol. 105, No. 4, pp. 112-119., available at:
https://www.ncbi.nlm.nih.gov/pmc/articles/PMC4358193/ (15 April 2020)
WHO (2020), "World Health Statistics data visualizations dashboard", available at:
http://apps.who.int/gho/data/node.sdg.3-9-data?lang=en (07 April 2020)
World Bank Group (2020), "Population, female (% of total population)", available at:
http://api.worldbank.org/v2/en/indicator/SP.POP.TOTL.FE.ZS?downloadformat=excel (14 April 2020)
World Bank Group (2020), "Total population", available at:
http://api.worldbank.org/v2/en/indicator/SP.POP.TOTL?downloadformat=excel (04 March 2020)
Author biographs
Gábor Vona
After finishing my studies in Actuarial Sciences at the Corvinus University of Budapest, I carried out activities as actuary and product developer between 2006 and 2014 in Hungary and in the Netherlands.
Subsequently, I could gain insights during 1-1 year in the civil, later in the information and communication technology sector. From 2018, I turned to the field of Sustainable Development by performing assignments as volunteer to the benefit of NGOs. In order to deepen my knowledge and evolving into a researcher, I started my PhD studies in Sustainability Management in 2019 at my alma mater.
33
Empirical Evidence of the Rotation of the Age Pattern of Mortality Decline
Kolos Csaba Ágoston EFOP Mortality Research Group Corvinus University of
Budapest kolos.agoston@uni-
corvinus.hu
Dávid Burka EFOP Mortality Research Group Corvinus University of
Budapest david.burka@uni-
corvinus.hu
Erzsébet Kovács EFOP Mortality Research Group Corvinus University of
Budapest erzsebet.kovacs@uni-
corvinus.hu
Ágnes Vaskövi EFOP Mortality Research Group Corvinus University of
Budapest agnes.vaskovi@uni-
corvinus.hu
Péter Vékás EFOP Mortality Research Group Corvinus University of
Budapest peter.vekas@uni-
corvinus.hu
Abstract
Rotation of the age pattern of mortality decline refers to two phenomena supposedly occurring simultaneously: decelerating mortality decreases at younger ages and accelerating improvements in elderly populations. Several researchers have documented these processes in the literature, especially in highly developed countries.
After a concise summary of the most relevant sources, a simple, largely data-driven methodology with few assumptions is used to empirically examine the rotation phenomenon in historical mortality datasets of the G7 countries26, using United Nations data from the period between 1950 and 2015 for both genders.
In line with earlier findings about European Union member states, my results indicate that the presence of rotation is far from universal, even in highly developed countries.
There is strong evidence of rotation in both male and female populations only in the case of Japan, and no evidence of rotation whatsoever in US data. Therefore, it is
26 1 The Group of Seven consists of Canada, France, Germany, Italy, Japan, the United Kingdom and the United States of America.
34 necessary to exercise appropriate caution before applying forecasting procedures such as the variant of the popular Lee–Carter model that includes rotation.
Acknowledgement
This research has been supported by the National Research, Development and Innovation Office (FK-132343).
Introduction
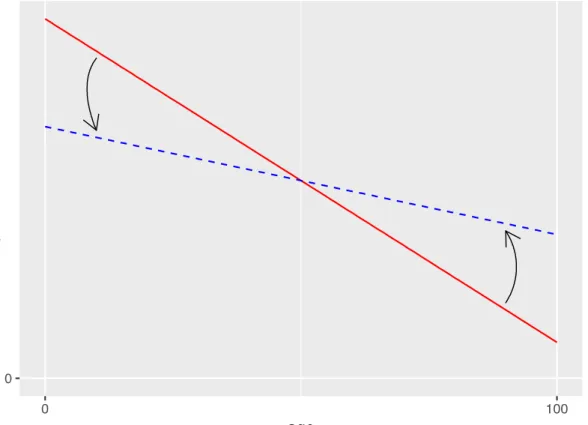
Several mortality researchers have noted a historical pattern of diminishing mortality decline at relatively younger ages, accompanied by accelerating improvements at more advanced ages (Christensen et al. [2009]). Li–Lee–Gerland [2013] call this phenomenon the “rotation” of the age pattern of mortality decline, which is captured by a counterclockwise rotation in Figure 1.
Figure 1: Rotation of the age pattern of mortality decline (stylized illustration, source:
Vékás [2019])
35 A somewhat simplistic explanation of the rotation is that longevity increases used to be driven by rapidly declining infant and childhood mortality rates (e.g., due to widespread vaccination programs and improved child nutrition) – and to some ex- tent, by improvements in middle-aged mortality –, where spectacular advances are less and less possible, but on the other hand, better medications, nutrition and lifestyle choices for the elderly and costly medical procedures to extend life at higher ages are increasingly available.27 It should be noted that the investigation of the causes of the rotation falls outside the scope of this paper.
The practical significance of the topic lies in the fact that ignoring rotation in long- term mortality forecasts leads to the systematic underestimation of the elderly population, which exacerbates longevity risk. These underestimation errors have a cumulative nature and may be surprisingly severe in the long run (see e.g. Vékás [2018]). This may lead to serious financial consequences for life and health insurers as well as pension schemes.
Mortality forecasting techniques play a key role in demography, life insurance and pensions. Due to the immense and ever-growing literature on these methods (see e.g.
Booth–Tickle [2008] and Pitacco et al. [2009] for comprehensive reviews), an exhaustive overview is not attempted here, but instead, this paper will only focus on sources related to the rotation phenomenon.
The famous paper of Lee–Carter [1992] has probably been the most important break- through in the history of mortality forecasting. The authors model the logarithm of the central mortality rate at age x and calendar year t as
log mxt = ax + bxkt + εxt , (1)
where ax represents the mean of the observed logarithmic central mortality rates for a given age, the time series kt captures the evolution of the overall level of mortality across time, and bx denotes the speed of mortality decline for every age.
As the parameters bx do not depend on time, and the time series kt is overwhelmingly assumed to follow a linear pattern (Tuljapurkar et al. [2000]), age-specific mortality declines at a constant speed in the Lee–Carter model, and the rate of improvement
27 Li–Lee–Gerland [2013] argue that the rotation is more prevalent in developed countries characterized by low mortality, which is consistent with this explanation. Elderly mortality itself is far from homogeneous, and this general description may hold for some age groups and countries and not for others.
36 only depends on the age of the individual in question. The latter implicit assumption of the model has attracted intense scrutiny by the scientific community (see
e.g. Kannisto et al. [1994], Horiuchi–Wilmoth [1995], Lee–Miller [2001], Carter–
Prskawetz [2001], Rau et al. [2008] and Christensen et al. [2009]).
Several approaches have been developed to address this inflexibility of the classic Lee–Carter framework. Notably, Li–Lee–Gerland [2013] have incorporated the rotation into the original procedure28, where instead of Equation (1), they model the logarithms of central mortality rates as
log mxt = ax + B(x,t)kt + εxt. (2)
The parameters B(x,t) in Equation (2) capture the rotation phenomenon by converging smoothly across time from their initial levels corresponding to bx in Equation (1) to their assumed ultimate levels, as life expectancy at birth advances from an initial threshold to an upper ceiling (the authors propose 80 and 102 years, respectively) in the original model described by Equation (1). It is important to note that the authors recommend their model for low-mortality countries and very long forecasting horizons, and knowledge of the estimated parameters of the original Lee–Carter model is sufficient to fit the rotated model to data. Ševčíková et al. [2016] and Dion et al. [2015] recently incorporated this technique into population projections for the United Nations Population Division and Statistics Canada, respectively.
Another solution is to capture the rotation by modeling the evolution of age-specific mortality improvement rates instead of mortality rates, as proposed by Haberman–
Renshaw [2012] and Mitchell et al. [2013], among others. Bohk-Ewald–Rau [2017]
follow this line in a Bayesian framework capable of combining mortality trends of different countries. These approaches are data-driven, as opposed to Li–Lee–Gerland [2013], who impose a somewhat arbitrary process on age-specific mortality improvement rates, as they are of the opinion that empirical evidence of the rotation is too subtle to govern forecasts.
Yet another alternative is the approach of Booth et al. [2002] and Hyndman–Ullah [2007], who recommend using more than one interaction of age- and time-dependent parameters in Equation (1) in order to capture the non-constant evolution of age- specific mortality improvement rates, which produces so-called multi-factor mortality
28 Li–Gerland [2011] present an earlier, not fully developed version of this approach.
37 forecasting models. Bongaarts [2005] proposes a shifting logistic model to de- scribe the transition in the age pattern of mortality decline. Li–Lee [2005], Cairns et al. [2011], Russolillio et al. [2011] and Hyndman et al. [2013] model mortality rates of several populations in a coherent framework. In a multi-population setting, age-specific rates of mortality improvement are not necessarily constant due to interactions among different populations. Further recent developments in this field are described by de Beer–Janssen [2016] and Li–Li [2017].
Based on data from 28 European Union member states and the period between 1950 and 2015, Vékás [2019] concludes that the rotation only took place in a few member states, with only 11 of them displaying statistically significant evidence for rotation at the 5% level in case of both genders, while apparently no rotation at all (or even on the contrary, an anti-rotation) in many others. Additionally, the rotation was more prevalent in female than male populations. Contrary to Li–Lee–Gerland [2013], Vékás [2019]
argues that the presence and strength of the rotation phenomenon appear to be largely unrelated to life expectancies at birth in the European Union as a whole: positive and negative cases appear among both low- and high-mortality countries, and the strength of the association between these two variables is apparently statistically negligible. On the other hand, there is significant evidence for a positive correlation between degrees of rotation and life expectancies at birth among member states that used to belong to the Eastern Bloc during the Cold War.
Data and methods
The statistical analysis presented in this paper was performed in R (R Development Core Team [2008]) using mortality rates, life expectancies at birth and population counts of the Group of Seven, which consists of Canada, France, Germany, Italy, Japan, the United Kingdom and the United States of America These indicators are available for both genders, all G7 countries, 22 age groups (0, 1-4, 5-9, 10-14, …, 95- 99 and 100 years and older) and 13 calendar periods (1950-1955, 1955-1960, …,
38 2010-2015).29 All data are the courtesy of the UN World Population Prospects 2017 ([United Nations [2018]]).
Mortality improvement rates and measures of rotation were computing using the population-weighted non-linear correlation approach introduced by Vékás [2019], and one-sided z-tests (Pinto da Costa [2015]) with
H0: ρcg ≤ 0, H1: ρcg > 0 (5)
were used to test whether degrees of rotation were significantly different from zero.
Conclusions
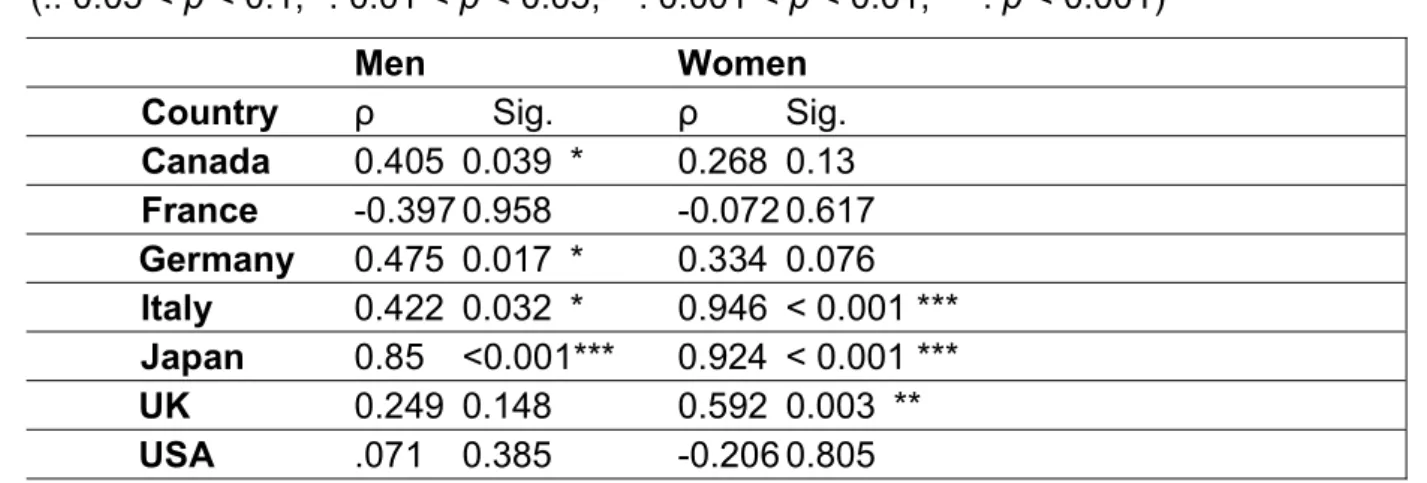
Figures 2 and 3 display degrees of rotation in male and female populations of the G7 countries, as well as the critical values at the 5% and 1% significance levels of the hypotheses defined by Equation (5). Table 1 in the Appendix contains the exact values of ρcg as well as the p-values of the above test by country and gender.
Evidence for rotation is significant at the 5% level in male populations of Canada, Germany, Italy and Japan, as well as in female populations of Italy, Japan and the United Kingdom. This suggests that rotation of the age pattern of mortality decline was far from universal in the G7 countries between 1950 and 2015, similarly to the findings of Vékás [2019] about European Union member states.30
29 Every period spans 5 years and starts and ends on July 1 of the respective years. The grouping of
ages and calendar years smooths the data (akin to moving averages) so that they contain less undesirable random fluctuations.
30 A stricter testing framework might take into account that 14 null hypotheses are being tested simultaneously. Hence applying the popular Bonferroni adjustment for controlling the familywise error rate (see Frane [2015] for a critical discussion), the p-values below 0.05 / 14 = 0.0036 imply statistical significance at the 5% level.


![wasrecentlydocumentedfortheEUtoreducegreenhouseemissionsbyatleastby55% goalwastointegratepoliticalandeconomiccooperationfully[ ].Energysecurityisaglobalconcernnowadays.Allnationsaroundtheworldhaveframedenergypoliciesincontrastwithsustainablegrowth.Almosta](data:image/gif;base64,R0lGODlhAQABAIAAAP///wAAACH5BAEAAAAALAAAAAABAAEAAAICRAEAOw==)