A
Gusztáv Báger – Tímea Cseh
Top Performance in Investments
in the Hungarian Economy
Summary: The study shows that the extraordinary growth of fixed capital formation and investment was twice higher than the increase in GDP during the period between 2012 and 2018. Investment rate reached 25 percent in 2018, compared with the European Union’s 20.4 percent; after Sweden and the Czech Republic Hungary had the third highest rate among the EU Member States. The achievement of this outstanding investment performance was greatly supported by the use of EU funds, the growth in foreign direct investment inflow and the lending turnaround stimulated by the proactive and innovative monetary policy of the Hungarian Central Bank as well as the large-scale expansion of investment grants. Among these impact factors the use of EU funds was the most significant in years 2013-2015. These resources amounted to more than one third of government investments in the period under examination. The volume of foreign direct investment inflow reached 4 percent of GDP in four years during the period between 2012 and 2018. The impact of the Funding for Growth Scheme launched by the Hungarian Central Bank was 4.4 percentage points in years 2013-2018. In parallel with the boost in investment, there was a positive and efficient change in the industries and branches of the national economy, material-technical composition, territorial distribution, sectoral composition, as well as the structure of public investments according to institutional framework.
KeywordS: national economic investments, public investments, state subsidy, foreign direct investment, corporate lending, EU transfer
JeL codeS: E22, E27, F21, G01, H54 doI: https://doi.org/10.35551/PFQ_2020_1_7
A previous study (Báger, 2015) showed that the decline in fixed capital formation and investment was significantly greater than the fall in GdP in the period between 2008 and 2013 under examination; among OeCd countries the gap of the investment rate compared to the level before the crisis was the 9th greatest in Hungary. The Hungarian
capital allocation increased more rapidly than the Fdi inflow. The service charge payment of PPP investments increased the budget deficit by approximately 0.5 percent of the GdP per year. The structure of national economic investments changed substantially: there was an outstanding growth in the processing industry, a smaller growth in the share of public administration and water supply;
and there was a substantial decline in the percentage of real estate activities, electricity E-mail address: bagerg@gmail.com,
csehtimi@gmail.com
and gas supply, education and transportation.
The change in the structure of public investments is indicated by the fact that the performance value of fixed capital formation increased by 2.1 percent at the central budget and by 12.3 percent at local governments.
The sum of investment grants doubled in the period between 2009 and 2013. The volume of grants in the sector of non-financial corporations as a share of GdP increased to 1.9 percent in 2013 compared with the 1.2–
1.1 percent of years 2009-–2010. in addition to the net eu transfer, the increasing grants also played a significant role in the recovery of investment activity, which started in 2013.
THE oBjECTIvE AnD METHoD oF AnAlySIS
The objective of this study is to show the top performance that was reached by the country in terms of investments in the period between 2013 and 2018 following the downturn and recovery in investments. to this end – in line with the previous study (Báger, 2015) – we summarize the findings of the analyses pointing in the following four directions:
• the trends in fixed capital formation and investment in the light of recovery and international comparison,
• the restructuring of national economic investments,
• the restructuring and institutional framework of public investments, and
• the volume and structure of investment grants.
When examining certain topics, the study reviews a period longer than 2012-2018 so that the prevailing trends and the changes in them can be presented. Sometimes, when the comparative statistical data do not allow the analysis of the period between 2012 and 2018, the study examines a shorted period.
THE TREnDS In FIxED CAPITAl FoRMATIon AnD InvESTMEnT Trends in fixed capital formation and investment
Fixed capital formation in the 2012-2018 period examined increased by a total of 60.6 percent, much more significantly than the volume of GdP (23.6 percent), compared with the –12.5 and –2.9 percent in the 2007–
2013 period. The volume of the resources devoted to economic development contributed positively to economic growth in the period between 2012 and 2018, except for two years (2012 and 2016), and it already contributed by 3.7 percentage points in 2017 and by 3.8 in 2018 (see Table 1).
The largest proportion, approximately 70–80 percent, of fixed capital formation is constituted by investments, while the remaining proportion consists of intangible assets and assets acquired through financial leasing. The parallel nature of the trend of the two indicators changed in 2014 in a way that – as a result of the slower growth of the constituting elements apart from investment – the volume of fixed capital formation increased more slowly than the volume of investments, as illustrated by Figure 1.
Based on the brief analysis of gross fixed capital formation and investment processes it can be established that the development activity in the national economy grew significantly after 2013, except for 2016.
The decline of gross fixed capital formation in 2016 is mainly explained by the eu budgetary cycle. The resources available for two more years from the 2007–2013 eu budgetary cycle greatly increased the 2015 baseline value, but these resources ceased to exist in 2016, which caused a decline in the nominal and volume data for the subject year.
Table 1 CHANGE IN THE VOLUME OF GDP, GROSS FIXED CAPITAL FORMATION
AND INVESTMENTS
GDP (previous year=100.0)
Gross fixed capital formation (previous year=100.0)
Contribution of gross fixed capital formation to GDP
growth (percentage points)
Investment (previous year=100.0)
2012 98.5 97.0 –0.6 95.0
2013 102.0 109.8 1.9 105.9
2014 104.2 112.3 2.6 119.3
2015 103.8 104.8 1.1 107.9
2016 102.2 89.4 –2.4 87.1
2017 104.3 118.7 3.7 124.4
2018 105.1 117.1 3.8 119.2
Source: Edited by the authors based on the data of the Hungarian Central Statistical office
Figure 1 CHANGE IN THE VOLUME OF GDP, GROSS FIXED CAPITAL FORMATION AND INVESTMENTS
(YEAR 2012 =100.0)
Source: Edited by the authors based on the data of the Hungarian Central Statistical office
Gross fixed capital fomration Investments GDP
Figure 2 GROSS FIXED CAPITAL FORMATION AS A PERCENTAGE OF GDP (2012–2018)
Source: Edited by the authors based on the data of the Hungarian Central Statistical office
Figure 3 GFCF IN 2018 AS A PERCENTAGE OF GDP IN THE EU-28 MEMBER STATES
Source: Edited by the authors based on European Union data
Gross fixed capital fomration as percentage of GDP
investment rate (investment/GdP ratio) continuously increased in the period under examination: it was 17.7 percent in 2017 and 20.3 percent in 2018. According to Figure 2 gross fixed capital formation (GFCF) as a percentage of GdP increased or stagnated in the years between 2012 and 2018 – except for 2016 –, and it reached a record of 25 percent in 2018.
According to Figure 3, – based on the data of the latest available international comparison – the proportion of gross fixed capital formation as a percentage of GdP in 2018 was the 3rd highest (25 percent) in Hungary after Sweden and the Czech Republic among the eu Member States. This rate significantly
exceeded the 20.4 percent of the eu average, the 21.0 percent of the euro zone and the 21.8 percent of OeCd countries. Among OeCd countries the rate was 20.6 percent in the uSA, 24.2 percent in Japan, 22.5 percent in Canada and 22.1 percent in Mexico.
A special factor affecting investments, PPP investments
PPP investments were significant development factors in the period before 2010; their contractual total capital value was HuF 761.6 billion in 2018 (see Table 2). it is noteworthy that 6.1 percent of this amount
Table 2 VOLUME AND SERVICE CHARGES OF PPP INVESTMENTS 2013–2018,
HUF BILLION
Capital value
Volume of service charges payment 2013 2014 2015 2016 2017 2018
Total 761.6 141.9 150.9 150.3 151.7 147.1 151.6
of this larger projects:
M6 motorway (Szekszárd–Bóly) 230.8 30.8 32.2 32.5 33.1 33.3 35.0
M6 motorway (Dunaújváros–Szekszárd) 118.5 17.3 17.4 17.5 17.6 17.6 18.0
M5 motorway (Kiskunfélegyháza–Szeged) 89.0 37.3 39.1 39.3 39.7 40.1 42.0
M6 motorway (Érdi tető–Dunaújváros) 98.7 19.3 20.6 20.8 20.7 20.4 21.3
M5 motorway (Szeged: Hungarian–Serbian border)
39.8 - - - - - -
Motorways in total 576.8 104.7 109.3 110.1 111.1 111.4 116.3
Palace of Arts 31.3 7.5 11.5 11.1 11.3 11.2 11.0
Prison construction (Szombathely) 9.2 3.0 3.0 3.0 3.0 3.0 3.1
Prison construction (Tiszalök) 7.7 2.5 2.6 2.6 2.6 2.6 2.6
University of Pécs – Dormitories 2 8.2 1.7 1.8 1.9 1.8 1.8 1.8
Semmelweis University – Theoretical Medical Centre
7.0 1.3 1.2 1.2 1.2 1.2 1.1
Source: Hungarian Central Statistical office
of investment (HuF 46.7 billion) was realized as budget investment, and its majority – 93.9 percent – (HuF 714.9 billion) as private (entrepreneurial) investment; the volume of public and business investments was increased by this amount.
As shown in table 2, the larger projects listed above amounted to 84.1 percent of the amount of PPP investments, in particular, motorways constituted 75.7 percent of this amount. in terms of size – with its share of 30.3 percent – the M6 motorway project (Szekszárd-Bóly) stands out among them.
Given that the implementation of development schemes did not continue from 2010 in the form PPP projects, this conceptual change decreased the investment rate in the years after 2010.
On the other hand, when it comes to the previously implemented PPP projects, it is important to highlight that although the
related so-called service charge payment (the amount of contractual capital repayment and the annual charge of the services provided by the projects) exceeded the amount of service charge payment of the preceding four years – except for 2017 –, it constituted a smaller percentage, approximately 0.3–0.4 percent of the annual GdP; therefore, it increased the budget deficit in the year in question by this amount.
Investments carried out by using EU funds between 2012 and 2018
Another important change in the conditions influencing the growth of national economic investments was the opportunity to use eu funds. Their greatest impact appeared in the years 2012–2015 (see Figure 4).
in the seven-year period under examination Figure 4 DISTRIBUTION OF NET CAPITAL TRANSFERS BY SECTOR (MILLION EUR)
Source: Edited by the authors based on the data of the Hungarian Central Statistical office
2.2.1. Unrequited capital transfers of public finances, balance 2.2.2. Unrequited capital transfers of other sectors, balance
Million Euro
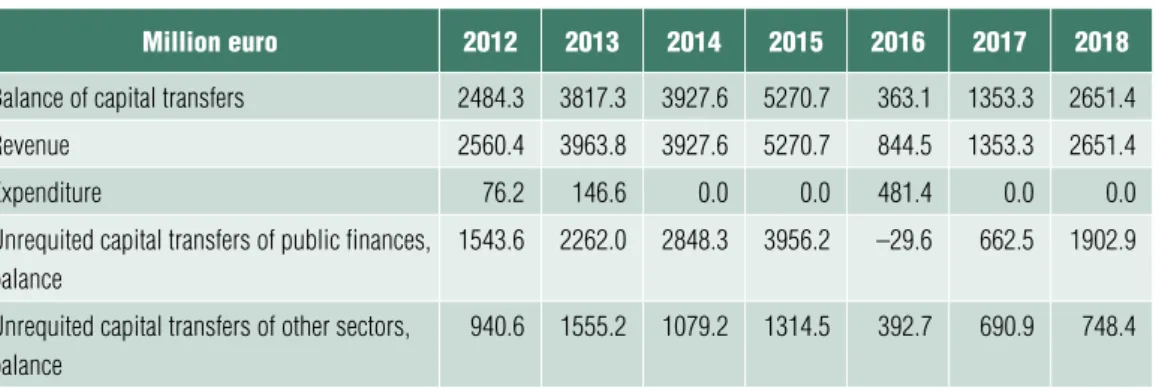
– according to the accrual-based data of the balance of payments – eu funds, of an amount of 19.9 billion euR arrived in Hungary, which is less than in the years 2007–2013 (21.1), of which amount 6.8 billion euR was used in the private sector, and 13.1 in public finances (see Table 3). This transfer amounts to HuF 6076.4 billion, which constituted subsidy of HuF 4029.6 billion for public finances and subsidy of HuF 2046.8 billion for the private sector.
in terms of the impact of eu transfers stimulating investments it is important to note, however, that the distribution of the volume of capital transfers by year was uneven, especially in the case of public finance transfers. in 2016, for example, this transfer decreased by 4 billion euR compared with the growth of 1.0 billion euR in 2015 (see table 3).
in terms of eu funds, the 2012–2018 period affects two consecutive seven-year budgetary periods. Approximately two thirds of the resources of the 2007–2013 cycle were used between 2012 and 2015, and the use of the resources of the 2014–2020 cycle started between 2016 and 2018. The value of the investments financed from eu funds per year can be monitored in – among others – the
capital transfer lines of the balance of payments.
The significant decline of eu transfers, which was visible from 2015 to 2016, indicates the transition between the two cycles (Figure 4).
The decline had the strongest impact on the capital transfers provided to public finances, whereas the decline in current transfers was significantly lower. in addition to the low nominal absorption, the dynamic growth in gross domestic product also contributed to the rate of decrease in used funds as a share of GdP.
in case of the private sector, households mainly received agricultural grants (direct payments), while the majority of non- financial corporations benefited from grants for development purposes. The eu transfers received by public finances also served development purposes to a significant extent, primarily in the field of infrastructure, in particular, transport networks.
The balance of payments accounts with cash flows at the time of the use of funds, but the payment of advances played an enhanced role in the Hungarian practice from 2016.
in the 2014–2020 cycle – until the end of 2018 – subsidy of almost HuF 5,800 billion was paid to the beneficiaries within the
Table 3 TRANSACTIONS AFFECTING THE BALANCE OF PAYMENTS RELATING TO THE EUROPEAN
UNION (APART FROM SPECIAL PURPOSE COMPANIES, MILLION EURO)
Million euro 2012 2013 2014 2015 2016 2017 2018
Balance of capital transfers 2484.3 3817.3 3927.6 5270.7 363.1 1353.3 2651.4
Revenue 2560.4 3963.8 3927.6 5270.7 844.5 1353.3 2651.4
Expenditure 76.2 146.6 0.0 0.0 481.4 0.0 0.0
Unrequited capital transfers of public finances, balance
1543.6 2262.0 2848.3 3956.2 –29.6 662.5 1902.9
Unrequited capital transfers of other sectors, balance
940.6 1555.2 1079.2 1314.5 392.7 690.9 748.4
Source: Edited by the authors, based on the data of the Hungarian Central Bank
framework of Széchenyi 2020 program, and approximately three quarters of this amount consisted of advance payments. The highest amounts paid were linked to the economic development and innovation Operational Programme (ediOP, HuF 1,300 billion) and the integrated transport development Operational Programme (itdOP, HuF 1,200 billion).
The budget of the ediOP exceeding HuF 2,700 billion supports investments that stimulate direct economic development, through, among others, supporting the competitiveness of small and medium-sized enterprises, promoting research, development and innovation, info-communications tech- nology and employment, and providing financial instruments, in particular preferential loans. The investment priorities of itdOP, in which the subsidies granted exceeded HuF 1,700 billion at the end of 2019, include the enhancement of regional mobility, the development of environmentally friendly transport systems and the support of the multimodal Single european transport Area.
due to the high proportion of advances only some of the payments were actually used (and put on the balance of payments).
As estimated by the Hungarian Central Bank (MNB, 2019a), until the end of 2018 the amount of the payments (invoice based payment, use of advance payment) linked to the actual use probably amounted to a total of HuF 2,600 billion in the schemes under Széchenyi 2020. Between 2016 and 2018, however, advances of more than HuF 4,000 billion were paid to the beneficiaries, the investment performance relating to which will only appear later, when the advances are used. The highest advance payments concerned ediOP and the territorial and Settlement development Operational Programme (tOP). The purpose of advance payments is to minimise the investments
that due to the beneficiary’s self-financing difficulties.
The direct payments not included in the cohesion programmes, shown in Figure 5 in dark green, are the area-related subsidies of the european Agricultural Guarantee Fund (eAG). The exact utilisation structure of the eAG funds is not known, but according to the calculation of KPMG (KPMG, 2017) 20–40 percent of the domestic agricultural investments derived from eu funds between 2012 and 2015. in addition to direct payments, the Rural development Programme with a budget of HuF 1,300 billion also means important investment resources in the period after 2014.
Based on the statistics of the balance of payments, the expenditure for investment purposes represented by capital transfers decreased significantly among the payments linked to the 2014–2020 cycle, compared with the 2007–2013 period. The volume of national economic investments fell by approximately 17 percent in 2016, the first absorption year of the new cycle, in parallel with eu funds and capital transfers (Nagy, K., Palócz, É., Vakhal, P., 2018). The link between the drawdown of eu funds and the change in volume of investments continued to exist after 2016, as the investments increased by more than 20 percent in both 2017 and 2018.
The change in volume appeared primarily in the sectors supported by eu transfers, such as health care, education, public administration, electricity industry, accommodation and food service activities, as well as water supply.
Between 2012 and 2015 the proportion of capital transfers indicating the investments within the cohesion policy funds exceeded 70 percent. Between 2016 and 2018, however, just over half of the eu funds supported investments. The significance of eu funds in terms of investments is at different levels in the government and the private sector. According
to a study prepared by the Hungarian Central Bank in 2016 on eu transfers (Boldizsár, A., Kékesi, Zs., Koroknai, P., Kóczián, B., 2016), eu funds provided more than half of the public investments between 2012 and 2014, while their proportion did not even reach 10 percent in the private sector. The trends of government investments are more significantly determined by eu funds than the investments of the private sector.
When assessing the entire period between 2012 and 2018, slightly more than one third of the government investments derived from eu funds. Figure 6 illustrates that the role played by eu funds was less prominent as a share of GdP in the use of the 2014–2020 period, which started in 2016, than at the end of the 2007–2013 cycle. The increase of own-funded investments in the years 2017-2018 was only able to partially compensate the significant decline of eu funds for the year 2016.
The Hungarian Central Bank also conducted a study in 2017 on the utilisation of eu funds arriving in the private sector (Banai, Á., Lang, P., Nagy, G., Stancsics, M., 2017), which examined the impact of eu funds disbursed to the corporate sector in the 2007–2013 budget cycle. According to the result of the impact study based on the micro database, the impact of investments for economic development was significant in terms of the workforce size, revenue and gross added value. The authors, however, also established that no significant link could be demonstrated between the eu funds and the labour productivity of enterprises.
The utilisation of eu funds is also central to the government, which is well demonstrated by the fact that the amount of resources available for direct economic development was significantly increased1 for the 2014–2020 cycle. The appropriate utilisation of economic Figure 5 TRENDS IN THE USE OF EU FUNDS
Source: Hungarian Central Bank Direct payments
Current transfers for the private sector Capital transfers for the private sector
Current transfers for public finances Capital transfers for public finances
As a percentage of GDP
development subsidies may promote the improvement of competitiveness, and thus the catching-up of the country to the eu average.
The type of objectives and priorities along which the resources of the eu budget cycle after 2020 will be allocated may be crucial in terms of competitiveness and convergence.
The trends of foreign direct investments
The role of foreign direct investments promoting growth significantly contributed to the outstanding investment performance.
They slowed down as consequence of the crisis, and their noticeable recovery manifested as late as in 2012‒2013.
The slowdown of Fdi inflow after the crisis was the result of several factors. On the one hand, economic growth declined after the
crisis, and the deterioration of growth prospects rapidly narrowed down the scope of possible investments, which had a decreasing effect on the trends of Fdi investments. On the other hand, the lack of liquidity arising during the crisis and the potential financing difficulty of mother companies may have encouraged foreign-owned companies to pay higher dividends, which led to a lower Fdi inflow through the lower investment percentage. in this context, it is important to highlight that the decline in Fdi investments after the crisis – similarly to the substantial increase taking place in the previous years – was a typical process throughout region, as the trends of Fdi investments shows a similar pattern in the countries of the region. (Figure 7)
When analysing foreign direct investment inflow (abbreviated as: Fdi inflow) we cannot disregard the fact that its trend is influenced by the capital in transit in the country. This Figure 6 TRENDS OF GOVERNMENT INVESTMENTS
Source: Hungarian Central Bank, Inflation Report for December 2019, Hungarian Central Statistical office data EU capital transfer Own funds
As a percentage of GDP
phenomenon is supposedly the result of the fact that some enterprises give shareholder loan to the Hungarian subsidiaries for tax optimization purposes, which is then retransferred abroad. This phenomenon is called by the Hungarian Central Bank capital in transit, which is separately shown in the balance of payments statistics since 2008.
The appearing capital in transit (Fdi in Hungary) increased from 0.4 billion euR in 2010 to 7.2 billion in 2012. This trend started to change in 2013: its volume sharply declined, by a maximum of 15.2 billion in 2015, then continued to decrease more slightly in 2016–
2017, and increased by 1.7 billion euR again as late as in 2018. The volume of capital in transit (Fdi abroad) changed at a similar rate,
reaching 7.6 billion in 2012, –15.2 in 2015, and +1.7 billion euR in 2018 (Table 4).
As we can see, the volume of the net Fdi inflow shows a positive value in each year:
in 2016 it reached 2.6 billion, in 2017 2.2 billion, and in 2018 2.8 billion euR. it is also important to note that the development of net Fdi inflow lagged markedly behind gross inflow in some years as a consequence of the fact that the volume of Hungarian capital allocation grew more rapidly.
in case of the financing of domestic investments from Fdi it is possible that gross inflow is of greater relevance than the net value.
in the funding of Hungarian investments, indeed, capital inflow of significance – although capital outflow decreases the resources of the
Figure 7 NET AND GROSS FDI INFLOW OF THE COUNTRIES IN THE REGION
(AS A PERCENTAGE OF GDP)
Source: UnCTAD, without capital in transit in case of the Hungary FDI inflow
Hungary Poland Czech Republic Slovakia Romania
FDI outflow Net FDI inflow
domestic economy, these resources are likely to leave the country just because it is more profitable for the given enterprises to invest in a different country, in other words, they would not necessarily have devoted these sums to investments in Hungary.
With regard to the trends of the factors of direct capital inflow – in terms of the impact on developments – it is also important to point out that compared with the new and fresh direct investments, expressing the ability to attract Fdi, the reinvested income and debt instruments have come to the foreground in the national economy of Hungary since 2014 (see Table 5). This is especially striking in 2017 and 2018, when the volume of reinvested income exceeded 5 billion euR. The large and sometimes negative debt Fdi transactions (so- called shareholder loans) reflect the impact of the individual corporate decisions, which did not influence the value of net Fdi inflow taking account of other Fdi sources as well.
The reasons for the change in the financing structure include the following:
• tax payment considerations given that the interest paid on the loan can be deducted
from the profit before tax, and dividend payment is only possible from the profit after tax, and
• it is easier to regulate for the owners, the interest paid on the loan is more predic- table than the annual profitability of the given company.
in terms of the funding of investments, another important change is that after the crisis the net direct investment arriving in the banking system played a greater role in the growth in the net Fdi inflow compared with the funds directly arriving from abroad.
it is also remarkable that the enterprises can acquire great foreign resources by direct foreign borrowing in addition to direct investment.
For example, the majority of the great- scale investments of Mercedes in Hungary were carried out by taking out foreign (not shareholder) loans.
in terms of the GdP ratios of regional net and gross Fdi inflows, we can establish based on Figure 7 that in the period between 2012 and 2018 the average volume of net Fdi inflow was the greatest in Hungary and the Czech Republic (around 2 percent), amidst Table 4 TRENDS AND FACTORS OF NET FOREIGN DIRECT INVESTMENT INFLOW (FDI)
(BILLION EUR)
2010 2011 2012 2013 2014 2015 2016 2017 2018
FDI in Hungary (inward) 1.8 4.3 11.3 2.7 6.0 –12.9 –4.8 3.3 7.1
FDI abroad (outward) 1.0 3.2 9.2 1.4 2.9 –14.3 –7.4 1.1 4.3
Capital in transit, FDI in Hungary 0.4 2.6 7.2 0.6 0.8 –15.2 –8.7 –1.9 1.7
Capital in transit, FDI abroad 0.6 2.7 7.6 0.6 0.8 –15.2 –8.7 –1.8 1.7
FDI in Hungary without capital in transit
1.4 1.7 4.1 2.1 5.1 2.3 3.9 5.2 5.3
FDI abroad without capital in transit
0.3 0.6 1.5 0.8 2.1 0.9 1.3 2.9 2.5
net FDI 0.8 1.1 2.2 1.2 3.1 1.4 2.6 2.2 2.8
Source: Edited by the authors, based on the data of the Hungarian Central Bank
significant volatility in the latter country, while significant outflow was also taking place from both countries. during the last two years this ratio achieved 4 percent in both countries.
The realisation of the lending turnaround
The proactive and innovative policy of the Hungarian Central Bank facilitated a stabilisation to take place in the financial system – without endangering the price stability objective –, which were effective in promoting the growth in investments in the real economy.
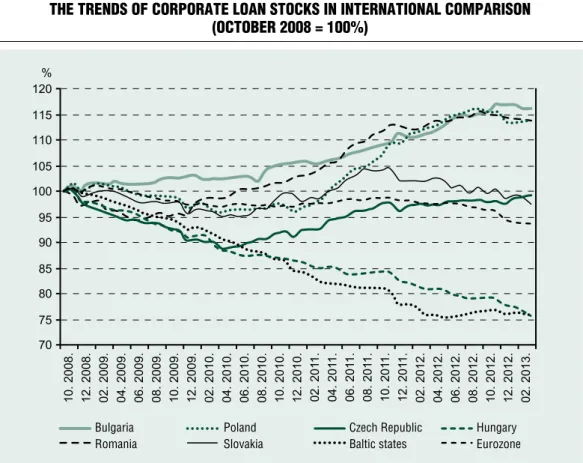
For a period of five years after the crisis, the corporate loan stock reduced to 75 percent of the volume before the crisis by the beginning of 2013, and continued to decrease further in 2013 (Figure 8).
As an important step, the Central Bank started to decrease the base rate in summer 2012, but the impact of this measure manifested in the corporate loan conditions only marginally. For this reason, the
Hungarian Central Bank started the Funding for Growth scheme (FfG) in June 2013 as a targeted monetary policy instrument to promote lending to SMes, boost the economy and strengthen financial stability.
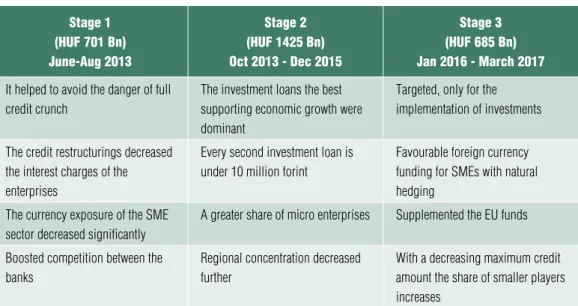
in autumn 2013, in the second stage of the scheme, the emphasis of the scheme was placed on new loans, in particular investment loans. in order to support the development of enterprises having greater financing difficulties, the Central Bank launched a new funding scheme (FfG+) in which it assumed some of the credit risks of the small and medium enterprises from the credit institutions in order to improve the access of the enterprises to credit. in the second stage of the FfG and within the framework of the FfG+ the volume of the contracts amounted to HuF 1,425 billion.
The Central Bank decided on the phasing- out of the FfG in autumn 2015. One of the reasons was the achievement of the objectives linked to the start of the schemes, the promotion of a favourable foreign currency funding and the unfolding of a market-based lending without refinancing by the Central Table 5 FINANCING FACTORS OF NET FOREIGN CAPITAL INFLOW
(CUMULATIVE TRANSACTIONS, BILLION EUR)
2010 2011 2012 2013 2014 2015 2016 2017 2018
net debt 0.8 1.1 2.2 1.2 3.1 1.4 2.6 2.2 2.8
From the net debt: Shares (net debt)
2.1 4.2 –6.8 3.0 1.8 20.0 5.5 8.3 1.9
From the shares: Stock and other share (net debt)
2.4 2.9 –7.3 2.0 –1.2 16.3 2.4 3.2 –3.2
From the shares: Reinvested income (net debt)
–0.3 1.3 0.5 1.0 2.9 3.7 3.0 5.1 5.1
From the net debt: Debt instruments (net debt)
–1.2 –3.1 9.0 –1.8 1.3 –18.6 –2.9 –6.2 0.9
Source: Edited by the authors, based on the data of the Hungarian Central Bank
Bank. The sum of the contracts concluded in this phasing-out stage was HuF 685 billion (see Table 6).
As a result of the FfG scheme it can be established that until March 2017 it made available a funding of HuF 2,800 billion to approximately 40 thousand Hungarian enterprises, and nearly HuF 1,700 billion of this amount supported the funding of investments (Figure 9).
in parallel with stage 3 of the FfG scheme – at the beginning of 2016 – the Central Bank launched the Funding for Lending Scheme (FfL) with the objective to support the expansion of market-based lending without refinancing by the Central Bank.
Stage 1 started in February 2016, and stage 2 started in July 2017 so that the banks which over-achieved their previously undertaken lending growth can expand the loans within the framework of this scheme, and thus their lending activity to SMes, in order to foster economic growth.
The FfL deserves particular attention also because within its framework two central bank instruments – interest rate swap conditional on lending activity (LiRS) and preferential deposit facility – promoted the lending activity.
These instruments increased the dynamism of lending, and by using them, the credit institution made quantitative and verifiable commitments to provide lending to SMes.
Figure 8 THE TRENDS OF CORPORATE LOAN STOCKS IN INTERNATIONAL COMPARISON
(OCTOBER 2008 = 100%)
Source: ECB, Hungarian Central Bank
Bulgaria Poland Czech Republic Hungary
Romania Slovakia Baltic states Eurozone
Table 6 RESULTS OF THE FFG
Stage 1 (HUF 701 Bn) June-Aug 2013
Stage 2 (HUF 1425 Bn) Oct 2013 - Dec 2015
Stage 3 (HUF 685 Bn) Jan 2016 - March 2017 It helped to avoid the danger of full
credit crunch
The investment loans the best supporting economic growth were dominant
Targeted, only for the implementation of investments
The credit restructurings decreased the interest charges of the enterprises
Every second investment loan is under 10 million forint
Favourable foreign currency funding for SMEs with natural hedging
The currency exposure of the SME sector decreased significantly
A greater share of micro enterprises Supplemented the EU funds
Boosted competition between the banks
Regional concentration decreased further
With a decreasing maximum credit amount the share of smaller players increases
Source: Hungarian Central Bank
Figure 9 DISTRIBUTION OF CREDIT OBJECTIVES IN THE DIFFERENT STAGES OF THE FFG
Note: the data relating to stage 2 of the FfG also include the loan of HUF 23 billion resulting from the parallel FfG+ scheme.
Source: Hungarian Central Bank
Loan redemptions
New working capital financing loans
HUF billion
HUF 701 Bn
HUF 1425 Bn
HUF 685 Bn
HUF 2811 Bn
Loans for pre-financing EU funds New investment loans
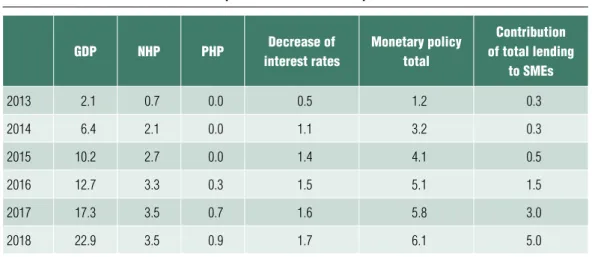
According to the analyses and estimations of the Central Bank (Hungarian Central Bank, 2019b) the FfG and FfL schemes contributed to GdP growth by 4.4 percentage points on the one hand by creating more favourable funding conditions and on the other hand through the implementation of a great number of investments, and by 1.7 percentage points through interest rate cuts, therefore, the monetary policy contributed by a total of 6.1 percentage points to cumulative GdP growth in the period between 2013 and 2018 (see Table 7).
When it comes to the impact of the schemes and the monetary policy of the Central Bank, it can be established that it brought about a trend turning point in lending to SMes, and greatly contributed to the recovery of investment activity and GdP growth in the period between 2013 and 2014. The schemes successfully achieved the objectives set in connection with them, such as: the recovery of the corporate lending market and strengthening of financial stability.
THE TREnDS oF THE STRUCTURE oF InvESTMEnTS
We would like to briefly present the structure of the performance of national economic investments by industries and branches as a first step, secondly by material-technical composition, thirdly by territorial distribution, and finally by sectoral composition.
Structure by industries and branches
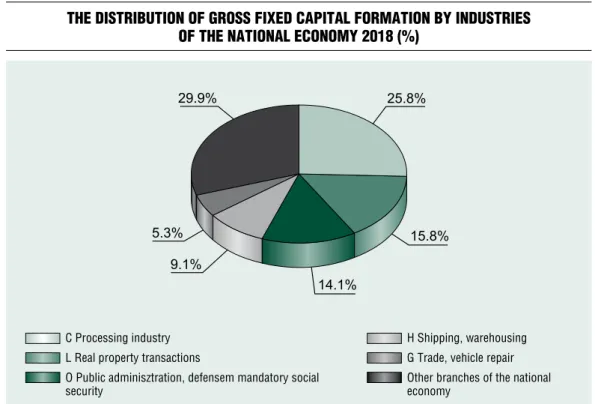
The total share of the four main investment industries; processing industry, transportation and storage, real estate activities, public administration and defence, compulsory social security exceeded 60 percent in each year during the period between 2012 and 2018. Among the main sectors, the share of processing industry, as well as public administration and defence, compulsory social security was significantly greater than the percentages in the period between 2007 and 2013 (see Table 8, Figure 10).
Table 7 CUMULATIVE GDP GROWTH (PERCENTAGE)
AND THE CUMULATIVE ECONOMIC GROWTH IMPACT OF THE SCHEMES (PERCENTAGE POINTS)
GDP NHP PHP Decrease of
interest rates
Monetary policy total
Contribution of total lending
to SMEs
2013 2.1 0.7 0.0 0.5 1.2 0.3
2014 6.4 2.1 0.0 1.1 3.2 0.3
2015 10.2 2.7 0.0 1.4 4.1 0.5
2016 12.7 3.3 0.3 1.5 5.1 1.5
2017 17.3 3.5 0.7 1.6 5.8 3.0
2018 22.9 3.5 0.9 1.7 6.1 5.0
Source: Hungarian Central Bank (2019b)
Table 8 THE SHARE OF FOUR MAIN INDUSTRIES (BRANCHES) FROM THE VALUE OF FIXED CAPITAL
FORMATION (PERCENT) Industries of the
national economy 2007 2008 2009 2010 2011 2012 2013 2014 2015 2016 2017 2018 C Processing
industry
24.3 23.1 19.7 22.1 28.6 31.1 30.3 27.9 23.7 31.7 27.9 25.8
H Transportation and storage
8.6 10.0 12.4 10.7 9.3 9.0 10.0 11.3 9.9 10.8 9.9 9.1
l Real estate activities
19.5 21.5 20.3 18.2 13.5 12.3 11.2 11.3 11.9 14.0 15.1 15.8
o Public administration and defence;
compulsory social security
10.1 8.5 9.0 8.8 8.1 11.5 11.5 13.6 16.6 8.2 12.4 14.1
Total 62.5 63.0 61.4 59.8 59.5 63.9 63.0 64.2 62.2 64.7 65.3 64.8 Source: Edited by the authors based on the data of the Hungarian Central Statistical office
Figure 10 THE DISTRIBUTION OF GROSS FIXED CAPITAL FORMATION BY INDUSTRIES
OF THE NATIONAL ECONOMY 2018 (%)
Source: Edited by the authors based on the data of the Hungarian Central Statistical office C Processing industry
L Real property transactions
O Public adminisztration, defensem mandatory social security
H Shipping, warehousing G Trade, vehicle repair Other branches of the national economy
in the field of real estate activities, the growth of commercial office construction and residential housing construction activity also contributed to the increase in investment share from 2016.
The more detailed examination of the sectoral structure of investments according to the 19 industries of national economy, focusing on the period between 2015 and 2018 demonstrates well the investment turning point that took place, as there was an increase in volume in 18 of these industries.
investments grew in the following induestries in the most dynamic manner:
• mining, quarrying (231.5 percent),
• electricity, gas, steam and air conditioning supply (106.2 percent),
• financial and insurance activities (103.2 percent),
• construction (69.8 percent),
• accommodation and food service activities (65.5 percent)
• professional, scientific, technical activities (61.3 percent) and
• arts, entertainment and recreation (60.1 percent).
Among the national economic industries of the greatest investment weight, real estate activities (67.4 percent), public administration and defence; compulsory social security (29.1 percent), processing industry (23.1 percent), and trade and repair services of motor vehicles (22.5 percentage) grew the most rapidly.
As a result of the differentiated growth by industries, the structure of the investments by industries also changed, but there was no material change in the distribution in 2018 compared with years the 2015–2016 (see Table 9).
We present the changes in structural proportions divided into three groups, which were formed according to the magnitude of the change. These are the following:
• group with a positive/negative change in proportion of 1 percentage point or more,
• group with a positive/negative change in proportion of 0.5‒0.9 percentage point,
• group with a positive/negative change in proportion of 0‒0.4 percentage point.
in the period between 2015 and 2018 examined, among the 7 sectors of the national economy undergoing the most intense change in the industry structure, the weight of processing industry increased by 2.1 percentage points, real estate activities by 3.9 percentage points and arts, enter- tainment and recreation by 1.1 percentage point.
The industries decreasing their share the most intensely include: public administration, defense, compulsory social security (–2.6 percentage point); information and communication (–2.6 percentage point);
water supply, sewerage, waste management and remediation activities (–1.8 percentage point); and human health and social work activities (–1.7 percentage point).
The industries of the national economy changing their share moderately (by 0.5–0.9 percentage point) were transportation and storage (–0.8 percentage point), electricity, gas, steam, air conditioning supply (+0.8 percentage point), construction (+0.7 percentage point), administrative and support service activities (+0.5 percentage point).
The industries of the national economy changing their percentage to a small extent include:
• trade and repair services of motor vehicles (+0.1 percentage point),
• professional, scientific and technical activities (+0.2 percentage point),
• financial and insurance activity (+0.3 percentage point),
• other service (0.0 percentage point), accom- modation service (+0.1 percentage point),
• mining, quarrying (+0.3 percentage point) and
Table 9 GROSS FIXED CAPITAL FORMATION Industries of the national economy
Volume index (Previous year = 100.0)Distribution (percentage)Changes in distribution 201520162017201820152016201720182016–20152017–20162018–20172018–2015 Industries of the national economy in total104.889.4118.7117.1100.0100.0100.0100.0 C Processing industry89119.4105.4109.923.731.727.925.88.0–3.7–2.22.1 l Real estate activities110.1103.9123.1118.811.914.015.115.82.11.00.73.9 o Public administration and defence; compulsory social security12844.1175.6130.316.68.212.414.1–8.44.21.6–2.6 H Transportation and storage9398111.2108.19.910.89.99.10.8–0.9–0.8–0.8 G Trade; repair of motor vehicles and motorcycles95.6115.799.81115.26.75.65.31.5–1.1–0.30.1 j Information and communication128.774.9104.7103.26.45.34.63.8–1.1–0.8–0.7–2.6 M Professional, scientific and technical activities119.765.5160.2128.43.52.63.53.7–0.90.90.20.2 A Agriculture, forestry and fishing84.991.9114.2113.13.83.83.63.50.0–0.2–0.1–0.3 D Electricity, gas, steam, air conditioning supply116.9119.194.4156.92.32.92.33.10.7–0.60.80.8 R Arts, entertainment and recreation82.6126.7158.396.61.62.43.22.70.70.9–0.51.1 F Construction93.389.8192.6105.21.71.72.82.50.01.1–0.30.7 n Administrative and support service activities80.9114.4116118.82.02.52.42.40.6–0.10.00.5 P Education135.660.5141.2128.52.31.61.92.1–0.70.30.2–0.2 K Financial and insurance activities117.3124.2102.2136.51.21.61.31.50.4–0.30.10.3 Q Human health care and social work activities158.628.61371312.90.91.11.2–2.00.10.1–1.7 S other services132.489.862.8206.21.01.10.61.00.0–0.50.40.0 I Accommodation and food service activities11389.1114.3140.30.80.80.80.90.00.00.20.1 E Water supply; sewerage, waste management and remediation activities135.734.991129.32.71.10.80.9–1.7–0.20.1–1.8 B Mining, quarrying156.464135.7244.10.30.20.30.6–0.10.00.30.3 Source: Edited by the authors based on the data of the Hungarian Central Statistical office
• agriculture, forestry and fishing (–0.3 percentage point) and education (–0.2 percentage point).
Investments by material-technical composition
Within the growth in investment activity, in terms of the trends of construction investments, 2013 was the first year after the declining construction investments of the preceding period in which the volume of construction investments was 7.7 percent greater than in the previous year (Table 10).
The performance of construction – following the considerable decline in 2016 – increased by 30.9 percent in 2017 and by 25.4 percent in 2018 (table 10).
The significant growth in housing construction also contributed to the large
increase of construction investments. The number of homes constructed increased by 67.5 percent between 2012 and 2018, while the number of authorisations issued for housing construction grew three and a half fold [10,600 (2012); 36,719 (2018)] in the period under examination. in terms of the value of housing investments there was a 72.3 percent growth in volume between 2012 and 2018. in addition to housing investments, infrastructural investments (road, railway) with a more considerable weight within construction investments and mainly financed from eu funds, also increased significantly.
investments into machinery grew in each year during the 2012–2018 period assessed. in 2014, after an outstanding 21.8 percent, the growth in volume was 17.5 percent in 2017 and 12.4 percent in 2018 (table 10).
Thanks to the performance of construction investments, the percentage of construction
Table 10 THE DISTRIBUTION AND GROWTH OF NATIONAL ECONOMIC INVESTMENTS
BY MATERIAL-TECHNICAL COMPOSITION
Period
Construction Machinery Construction Machinery
Percentage of investments at current prices
Change in volume of investments
% % Same period in the previous year = 100.0
year 2010 58.3 40.3 92.5 98.5
year 2011 53.1 45.3 86.1 108.8
year 2012 51.4 47.0 89.4 101.8
year 2013 52.5 45.8 107.7 105.7
year 2014 52.4 46.3 118.4 121.8
year 2015 53.8 45.0 110.2 106.7
year 2016 47.5 51.0 78.3 100.4
year 2017 51.9 47.0 130.9 117.5
year 2018 56.2 42.8 125.4 112.4
Source: Edited by the authors based on the data of the Hungarian Central Statistical office
investments increased by 51.4 percent in 2012 to 56.2 percent in 2018 at current price; by filtering out the price impacts this percentage changed from 49.6 percent to 48.8 percent.
in contrast, the percentage of investments into machinery grew from 47.0 percent in 2012 to 42.8 percent in 2018 at current price, while at the (unchanged) price in 2010 the percentage of investments in machinery increased from 49.3 percent to 50.3 percent.
The different trends of investments into construction and those into machinery can be considered as a favourable change in an investment situation which is dynamic on the whole, because, on the one hand, the building stock available allows the improvement of capacity utilisation, and on the other hand, it enabled the implementation of great-scale housing construction.
Territorial distribution of investments
Contrary to the material-technical compo- sition of the performance of the national economic investments, the distribution of the performance value of investments between the 7 regions did not differ significantly in 2018 from the previous years if we separate Budapest from the region of Central Hungary (Figure 11). in 2018, the investment performance value of enterprises with more than 5 employees, budgetary institutions and the observed non-profit organisations was the highest in Central transdanubia (HuF 677.8 billion). it was followed by Pest county (HuF 591.8 billion), Western transdanubia (HuF 583.2 billion), Northern Hungary (HuF 554.6 billion) and Southern Great Plain (HuF 552.7 billion) (Figure 11).
Figure 11 PERFORMANCE VALUE OF THE INVESTMENTS OF ENTERPRISES WITH MORE THAN 5 EMPLOYEES, BUDGETARY INSTITUTIONS AND THE OBSERVED NON-PROFIT ORGANISATIONS
BY REGION IN 2015–2018 (HUF MILLION)
Source: Edited by the authors based on the data of the Hungarian Central Statistical office 0
HUF million Southern Great Plain
Northern Great Plain Northern Hungary Southern Transdanubia Western Transdanubia Central Transdanubia Pest Budapest
The performance value of the investments of economic organisations was the lowest in the two least economically developed regions:
Southern transdanubia (HuF 307 billion) and Northern Great Plain (HuF 446.3 billion) (Figure 11).
in case of Budapest, which we analysed separately from Central Hungary, investment performance increased already in 2007 (HuF 2421.9 billion) partially as a result of the recovery of the housing market, but it showed a remarkable growth especially in 2018 (HuF 3360.1 billion). We can, therefore, establish that in the last year of the period examined more than half, 47.4 percent of the country’s investment performance was realised in Budapest.
Distribution of investments by sector
The distribution of the value of gross fixed capital formation in 2018 between regions is
illustrated in Figure 12. More than half of the investments are accounted for by developments realised in the private sector.
in case of market producers, except for 2015 in the sector of non-financial corporations and except for 2014 in the sector of financial corporations, the volume of capital formation increased in the period under examination.
The recovery which started in the non-financial sector in 2016 resulted in a 12.6 percent growth in investments in 2017 and a 13.8 percent growth in 2018 (see Figure 13). As a result of the growth in housing investments the investments of the household sector, including the developments of sole proprietorships, also exhibit an increasing trend in the years between 2012 and 2018. The highest growth in volume can be observed in 2017 during the period examined (Figure 13).
The volume of the investments of budgetary institutions (general government sector) increased significantly except for 2016: this
Figure 12 DISTRIBUTION OF GROSS FIXED CAPITAL FORMATION BY SECTOR, PERCENT
Source: Edited by the authors based on the data of the Hungarian Central Statistical office Non-financial corporations
Financial corporations General government
Households
Nonprofit institutions serving households
indicator was 148 percent in 2017 and reached 131.2 percent in 2018. The high degree of fluctuation in the investments of budgetary institutions was caused by the expenses of the investment necessities related to flood control at the beginning of the period assessed and later by the high volatility of eu transfers.
THE TREnDS In THE STRUCTURE oF PUBlIC InvESTMEnTS AnD THEIR InSTITUTIonAl FRAMEWoRK
After presenting the investment percentages of the private sector and budgetary institutions, we now examine – as a next step within national economic investments – the trends in the developments of the three subsystems of the government sector: central government, social security funds and local governments.
With regard to the available statistical data, we carried out this review by using the gross fixed capital formation indicator including investments. in addition to the indicators of the specialised investment statistics, this indicator also reveals information on components that belong to the scope of gross fixed capital formation, such as financial leasing and intangible assets.
in this context, it should be noted that the indicator of the gross fixed capital formation is significantly modified by the transition from the eSA95 system to the eSA2010 accounting system as from 1 October 2014. in addition to other changes, the most significant one is the accounting of research and development as capital formation, which means that this activity is not taken into account as expenditure but as produced asset, that is, it must be accounted as fixed capital formation instead of
Figure 13 VOLUME INDEXES OF GROSS FIXED CAPITAL FORMATION BY SECTOR
(SAME PERIOD IN THE PREVIOUS YEAR = 100.0)
Source: Edited by the authors based on the data of the Hungarian Central Statistical Office Sectors total
Financial corporations Households
Non-financial corporations General government
Nonprofit institutions serving households
intermediate consumption. This – in addition to fixed capital formation – has a significant impact on the output of the national economy and intermediate consumption (the former is increasing and the latter is decreasing).
Table 11 provides information on the fixed capital formation of the general government sector, broken down by subsector. in the period examined, the performance value of capital formation at the central government increased significantly from 2012 (HuF 703.4 billion) in each year – except for 2016 –, and there was an outstanding increase in 2014, in 2015 and 2017 (HuF 1393.9 billion), and in 2018 it achieved a volume of HuF 1909.9 billion.
The amount of capital formation by local governments – with a similar annual fluctuation – grew from HuF 366.5 billion in 2012 to 580.8 billion in 2018. However, the fixed capital formation of social security funds shrank from a level of HuF 1.5 billion in 2012 to HuF 0.4 billion in 2018 with high annual volatility.
By evaluating the changes we can establish that:
• the rate of capital formation greatly varies in the three subsystems in each year,
• the changes in the quarterly performance of capital formation compared with the same quarter of the previous year were even more hectic than those of the years.
in case of the fixed capital formation process taking place in the subsectors of the government sector this way and with changes of such intensity, it is doubtful whether development resources were used in an expedient, efficient and concentrated manner in the period examined as they were in the previous years.
An important feature of the fixed capital formation process in the government subsectors is the significant change in the shares of the subsectors (see Table 12). One of the characteristics of this change is that the capital formation ratio of the central budget subsector increased in two stages in the period assessed: in years 2012–2015 the 60 percent
Table 11 GROSS FIXED CAPITAL FORMATION OF THE GOVERNMENT SECTOR BY SUBSECTOR AT
CURRENT PRICE (HUF BILLION, PREVIOUS YEAR = 100.0)
Year
At current price (billion HUF) Value index (previous year=100.0)
Total Central government
Local government
Social security
funds
Total Central government
Local government
Social security
funds
2012 1 071.4 703.4 366.5 1.5 113.3 155.9 74.3 99.7
2013 1 320.5 822.6 495.6 2.2 123.3 117.0 135.2 152.0
2014 1 750.8 1 120.3 629.1 1.3 132.6 136.2 126.9 60.5
2015 2 275.7 1 468.7 804.9 2.1 130.0 131.1 127.9 153.7
2016 1 142.6 872.2 269.5 1.0 50.2 59.4 33.5 47.2
2017 1 762.5 1 393.9 366.9 1.8 154.3 159.8 136.1 179.6
2018 2 491.2 1 909.9 580.8 0.4 141.3 137.0 158.3 24.2
Source: Edited by the authors based on the data of the Hungarian Central Statistical office
ratio was followed by a ratio exceeding 75 percent in years 2016–2018.
A reverse process of change took place in the trends of the ratio of local government capital formation: the percentage around 35 percent measured in 2012–2015 reduced to 20-23 percent in years 2016–2018. it was due to the reform of the division of labour between the local government system and the central government, as a result of which not only the current maintenance costs, but also the majority of development expenditures were transferred to the sphere of the central budget. This primarily affected the budget and development funding of public educational and health care institutions.
TREnDS oF InvESTMEnT GRAnTS
When it comes to the factors affecting the trends of gross fixed capital formation and investments, it is important in respect of efficiency and analysis that we pay particular attention to the changes in the volume of capital transfers, in particular investments grants. Within capital transfers, i.e. unrequited
grants provided for capital formation, investment grants are of great significance.
Almost all of the capital transfers received from abroad is accounted for by investments grants.
The trends of the latter are shown in Table 13.
Concerning the methodology applied it should be noted that among the sectors of the national economy only the government and the rest of the world can provide investment grants.
The table shows the investment grant data according to the following categories:
• the grant can be received by 5 domestic sectors (non-financial corporations, financial corporations, the government, households, and the non-profit institutions serving households) and the rest of the world,
• among domestic sectors the government can only receive grants from the rest of the world, and
• the government can also provide grants to the rest of the world.
As shown in table 13, the amount of grants increased by 74.5 percent in the period under examination, and it grew from HuF 788.9 billion in 2010 to 1378.5 billion in 2018. The growth, however, took place in a fluctuating Table 12 THE SHARE OF THE SUBSECTORS FROM THE GROSS FIXED CAPITAL FORMATION
OF THE GENERAL GOVERNMENT (%) Year Central government Local government Social security
funds Total
2012 65.7 34.2 0.1 100.0
2013 62.3 37.5 0.2 100.0
2014 64.0 35.9 0.1 100.0
2015 64.5 35.4 0.1 100.0
2016 76.3 23.6 0.1 100.0
2017 79.1 20.8 0.1 100.0
2018 76.7 23.3 0.0 100.0
Source: Edited by the authors based on the data of the Hungarian Central Statistical office