Evaluation of oxidative/nitrative stress and uterine artery pulsatility index in early pregnancy
D. GERSZI
1,2pz, A. PENYIGE
1†z, Z. MEZEI
1, B. S ARAI-SZAB O
1, R. BENK O }
1, B. B ANYAI
1, C. DEMENDI
2, E. UJV ARI
2, S. V ARB IR O
2and
E.M. HORV ATH
11Department of Physiology, Semmelweis University, Budapest, Hungary
2Department of Obstetrics and Gynecology, Semmelweis University, Budapest, Hungary
Received: January 14, 2020 • Accepted: October 05, 2020 Published online: January 06, 2021
© 2020 The Author(s)
ABSTRACT
Introduction:Increased oxidative/nitrative stress is characteristic not only in pathologic, but also in healthy pregnancy. High uterine artery pulsatility index (UtAPI) at the end of the first trimester is associated with altered placentation and elevated risk for adverse pregnancy outcomes. We aimed to examine the relationship of systemic oxidative/nitrative stress and uterine artery pulsatility index in the first trimester and their correlation to pregnancy outcomes.Material and methods:Healthy pregnant women were recruited at 12–13th gestational week ultrasound examination; UtAPI was determined by color Doppler ultrasound. Patients were divided into high (UtAPI≥2.3) (n530) and low (n531) resistance groups, and pregnancies were followed until labor. Systemic oxidative/nitrative stress was estimated by measuring total peroxide level, total antioxidant capacity and nitrotyrosine level.Results:
Plasma total peroxide level was significantly lower (2,510±39mM vs. 2,285±59mM), total antioxidant capacity was higher (781±16 mM CRE vs. 822±13 mM CRE) in the high UtAPI group, which were accompanied by lower birth weight (3,317±64 vs. 3,517±77 g,P< 0.05). Plasma total peroxide level showed a negative correlation (by Pearson) to UtAPI (P< 0.01) and positive correlation to birth weight (P < 0.05). Conclusions:According to our results, lower systemic oxidative stress showed correlation with high UtAPI measured between the 12–13th weeks of gestation. We also found significant
pCorresponding author: Department of Obstetrics and Gynecology, Semmelweis University, 78/AUll}€ oiut, H- 1082 Budapest, Hungary. Tel.:þ36 1 459 1500; fax:þ36 1 333 4934. E-mail: dora.gerszi@gmail.com
zDora Gerszi andAron Penyige contributed equally to this work.
yPresent address: Department of Obstetrics and Gynecology, Saint Margaret Hospital, 132. Becsi Str., H-1032 Budapest, Hungary.
differences in the birth weight of healthy newborns; therefore it is worth examining this relationship in pathological pregnancies.
KEYWORDS
uterine artery pulsatility index (UtAPI), pregnancy, birth weight, oxidative stress, nitrative stress
INTRODUCTION
The decrease in uterine artery pulsatility index (UtAPI) on the border of the first and second trimester is a well-established clinical marker of physiological placentation. This decline is due to the development of the specialized uteroplacental vasculature: expanded, high-flow, low-resis- tance vessels to satisfy the growing nutritional and oxygen requirements of the fetus [1].
However, delay in this process might contribute to altered placentation and can be a warning sign of later placental dysfunction.
Examination of the uterine artery’s bloodflow by ultrasound Doppler method at the end of thefirst trimester with the determination of pulsatility index and resistance is widely accepted in obstetrical practice. Its predictive value was proposed in intrauterine growth restriction (IUGR) and preeclampsia. Over 95 percentile might be pathognostic to preeclampsia [2–5]. The simultaneous measurement of other early markers, like maternal plasma pregnancy related plasma protein A (PAPP-A), placental growth factor (PlGF), soluble fms-like tyrosine kinase-1 (sFlt-1), etc. may increase the sensitivity and specificity of the prognosis [6–8].
In healthy pregnancy and placentation, in the first trimester, during the period of trophoblast invasion, concentrations of reactive oxygen species (ROS) rise. At this time, placental oxygen tension is relatively low, ca. 20 mmHg. This low oxygen tension is necessary for producing the required level of angiogenic factors such as VEGF, PlGF and HIF resulting in placental angiogenesis and normal cell and tissue proliferation. When the maternal side of placental circulation has developed, both oxygen tension and ROS level get tripled. The placenta adapts to elevated oxygen tension and free radical concentration by modulating HIF-1a and increasing cellular levels of antioxidants. In physiological adaptation this process is advantageous in respect of fetal development and leads to a decrease in vascular resistance. In the high resistance group this process is partially flawed and results in damaged maternal vascular network of the placenta, which may be the consequence of lower oxygen tension and the elevation of ROS concentration.
Oxygen- and nitrogen-derived reactive species are involved in biological pathways, where they act as mediators; however, their overproduction leads to oxidative/nitrative stress that takes part in the pathogenesis of numerous diseases [9, 10]. Oxidative stress increases during the course of physiological pregnancy; however, in pathological complications, like gestational diabetes mellitus (GDM), preeclampsia and IUGR this elevation is more pronounced both in the placenta and in the blood plasma [11, 12]. Nitrative stress rises by the third trimester in physiological pregnancy. In pathological conditions mentioned above, this elevation might appear earlier and can reach higher levels [13, 14].
Our aim was to examine the relationship between systemic oxidative/nitrative stress and the uterine artery pulsatility index (UtAPI) on the 12–13th week of healthy pregnancy, and their correlation to pregnancy outcome and neonatal characteristics.
MATERIALS AND METHODS
Patients
A prospective observational study was performed at the Department of Obstetrics and Gyne- cology and the Department of Physiology, Faculty of Medicine, Semmelweis University, Budapest, Hungary between 27 May 2016 and 12 December 2017. The study was approved by the Scientific and Research Ethics Committee of the Hungarian Medical Research Council (43102-2/2014/EKU (425/2014) 49768-1/2015/EKU (392/2015). Written informed consent was obtained from all subjects.
Healthy pregnant women were invited randomly during the 12th week ultrasound screening (transabdominal sonography) to participate in the study (12þ0–12þ6 week of gestation). Method: A transducer should be positioned longitudinally and placed medially.
The vessel can be identified with colored Doppler. The best place for measuring uterine artery PI and RI is 1 cm after the branching from the iliac artery. Exclusion criteria were age below 18 and over 40 years, malignant tumors, hypertension, diabetes mellitus, obesity (BMI over 30), twin pregnancy and chronic inflammatory diseases. During transabdominal ultraso- nography examination by GE Volusion E8 (Boston, MA, USA),flowmetric measurement by color Doppler method was performed on the uterine artery 1 cm from the branching of the iliac artery; the pulsatility index was determined according to the equation below. Pregnant women were divided into two groups based on the mean of the right and left artery pulsatility indices; normal UtAPIgroup (termed in the text as low UtAPI < 2.3), (n 5 31) and high UtAPIgroup (n530).
PI¼ ðpeak systolic velocityðPSVÞ
end diastolic velocityðEDVÞÞ=time averaged velocityðTAVÞ
Inclusion/admission method was: when recruiting a high UtAPI patient, we also recruited an age- and BMI-fitted low UtAPI patient. Cut off point was set to 90% percentile of the average of the European population [15]. The study size was estimated according to earlier measurements of plasma total peroxide level in healthy women. With a pooled standard deviation of 269
m
M, a200-
m
M difference by unpaired Student’st-test may be detected witha50.05 and a power of 0.8 by a sample size of 29 per group [16].Study protocol
At the 12th week, following the ultrasound examination, participants filled in a questionnaire about their family, internal medicines and obstetric anamnesis, and blood samples were taken.
From these samples routine laboratory tests (total blood cell count, CRP, hepatic and renal function) were performed; furthermore serum, plasma and mononuclear leukocyte fractions were isolated for measuring oxidative/nitrative stress laboratory parameters. Circulating mononuclear cells were isolated from blood samples by gradient centrifugation using Histo- paque-1077 according to the users’ manual (Sigma-Aldrich, St. Louis, MO, USA). Methanol- fixed smears were made from the cell suspension and stored at 48C until further processing.
Pregnancies were followed until birth in order to note pregnancy complications, labor cir- cumstances, and neonates’ anthropometric data. We were not able to register labor circum- stances in six cases (low UtAPIgroup: 4, high UtAPIgroup: 2).
Determination of oxidative/nitrative stress related parameters
Total plasma peroxide (PRX) concentration, reflecting systemic oxidative stress, was deter- mined from plasma samples by colorimetric method using OxyStat assay (Biomedica, Wien, Austria). Plasma total antioxidant capacity was measured from plasma samples by a commercially available assay kit (OxiSelectÔ Total Antioxidant Capacity (TAC) Assay Kit, Cell Biolabs Inc., San Diego, CA, USA). Nitrative stress was characterized by measuring serum levels of 3-nitrotyrosine (NT) using competitive ELISA based on HRP-conjugated anti-3NT antibody (OxiSelectÔ Nitrotyrosine Elisa Kit, Cell Biolabs Inc., San Diego, CA, USA). To examine intracellular nitrative stress, immunohistochemistry was performed on methanol- fixed leukocyte smears with anti-nitrotyrosine rabbit polyclonal antibody (Abcam, Cambridge, UK) (1:80, 4 8C, overnight). Aspecific labeling was avoided by incubating the smears in 15%
normal horse serum for 1 h at room temperature. Secondary labeling was achieved by horseradish peroxidase-conjugated horse anti-rabbit immunoglobulin (Vector Laboratories, Burlingame, CA, USA) (30 min, room temperature). Brown colored diaminobenzidine (6 min, room temperature, brown color) was used for visualizing the labeling (Vector Laboratories).
Smears were counter-stained with blue colored hematoxylin (Vector Laboratories). Images of five representative microscopic fields of each smear were taken with 200x magnification (Zeiss-Imager.A1 light microscope, 20x/0.45 objective, AxioCam MRc5 camera, AxioVision– Rel. 4.8 software; Carl Zeiss Microscopy GmbH, Jena, Germany). The ratio of the positively stained cellular area compared to the total cellular area was determined by a blinded exper- imenter using ImageJ software (MBFImageJ, NIH, Bethesda, MA, USA); at least 300 cells were evaluated on each smear. Lower number of data in measured parameters was due to samples inadequate for analysis (hemolyzed plasma, serum or low cell count on leukocyte smears).
In order to examine the possible additive value of PRX in the correlation between UtAPI and birth weight, a new parameter was calculated, namely the quotient of UtAPI and plasma PRX:PIPX5 UtAPI/PRXp100.
Statistical analysis
Normal distribution data are presented as mean ± SEM. In the case of non-Gaussian distri- bution, logarithmic transformation was implemented (TAC) and data are presented as median [IQR]. Statistical significance between the two study groups was determined by the two-tailed unpaired Student’s t-test. Nominal variables were tested by Chi-square test. Correlations be- tween variables were estimated using Pearson’s correlation. Missing data were treated as missing. Probability values ofP < 0.05 were considered significant. For the statistical analysis SPSS 22.0 and Graphpad Prism 6.0 softwares were used.
RESULTS
Correlation between uterine artery PI and demographic and historical parameters
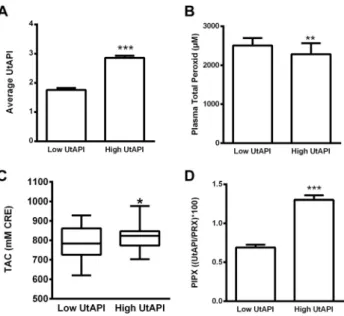
Pulsatility index of the uterine artery as our grouping variable was significantly higher in the high resistance group (Fig. 1A).
Age and BMI did not differ in the study groups. On the other hand, gravidity, parity, and the number of miscarriages were significantly lower among women with higher UtAPI (Table 1).
Clinical laboratory parameters including plasma creatinine, liver enzymes, hemoglobin, CRP and glucose levels were similar in our study groups; only LDH was significantly lower in women with higher UtAPI (Table 1).
Correlation between uterine artery pulsatility index and pregnancy outcome
The rate of Cesarean section was also similar in the two groups. All newborns were in the normal body parameter range; however, newborns of the high UtAPI group had significantly lower birth weight and chest circumference than those of the low UtAPI group. There was no difference in gestational weeks at labor; therefore these differences were not due to earlier de- livery (Table 1).
Correlation between uterine artery PI and oxidative/nitrative stress
Plasma total peroxide level, which refers to systemic oxidative stress, was significantly lower in the high UtAPI group than in the low UtAPIgroup (Fig. 1B), whereas total antioxidant capacity was significantly higher in the high UtAPI group (Fig. 1C). PIPX calculated from UtAPI and PRX (PIPX: UtAPI/PRXp100) was significantly higher in the high UtAPIgroup (Fig. 1D). On the other hand, serum and mononuclear cell NT levels were similar in the low and high UtAPI groups (Fig. 2A and B).
Fig. 1.Pulsatility index and oxidative stress markers. Panel A. Mean pulsatility index of the uterine artery.
(N531; 30) Panel B. Plasma total peroxide levels were significantly lower in the high UtAPI group. (N5 22; 22) Panel C. Plasma TAClevels were significantly higher in the high UtAPI group. (N529; 27) Panel D. PIPX calculated from UtAPI and PRX was significantly higher in the high PI group. (N522; 22). Data are presented as mean±SEM, or Median [IQR]in case of TAC.p:P< 0.05,pp:P< 0.01,ppp:P< 0.001
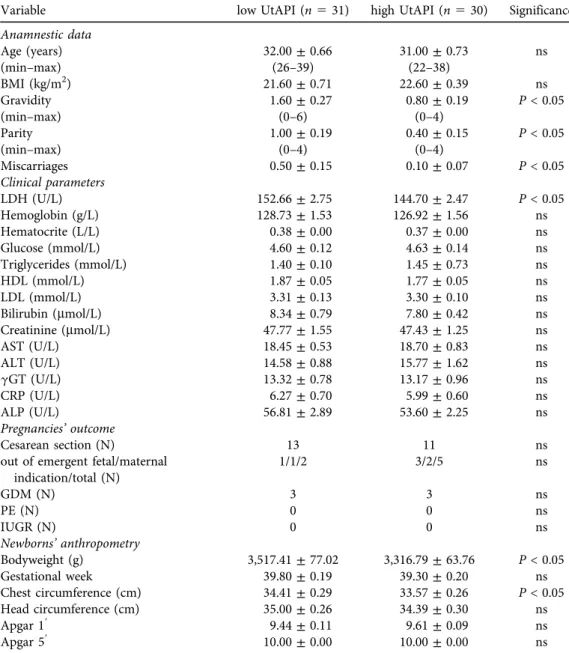
Table 1.Clinical and anthropometric data of women and their offspring. The two study groups were matched according to their age and BMI. On the other hand, gravidity, parity and the number of previous
miscarriages were lower in the high UtAPI group. There were no significant difference between the two groups in their major clinical laboratory parameters, however LDH level was significantly lower in the high UtAPI group. Development of preeclampsia was not observed among the study subjects. The occurrence of GDM and Cesarean section was similar in the two groups. The newborns of the high UtAPI group had
smaller birth weight and chest circumference despite the gestational age of the mothers at labor being similar. Data are presented as mean±SEM, where not indicated otherwise
Variable low UtAPI (n531) high UtAPI (n530) Significance
Anamnestic data
Age (years) 32.00±0.66 31.00±0.73 ns
(min–max) (26–39) (22–38)
BMI (kg/m2) 21.60±0.71 22.60±0.39 ns
Gravidity 1.60±0.27 0.80±0.19 P< 0.05
(min–max) (0–6) (0–4)
Parity 1.00±0.19 0.40±0.15 P< 0.05
(min–max) (0–4) (0–4)
Miscarriages 0.50±0.15 0.10±0.07 P< 0.05
Clinical parameters
LDH (U/L) 152.66±2.75 144.70±2.47 P< 0.05
Hemoglobin (g/L) 128.73±1.53 126.92±1.56 ns
Hematocrite (L/L) 0.38±0.00 0.37±0.00 ns
Glucose (mmol/L) 4.60±0.12 4.63±0.14 ns
Triglycerides (mmol/L) 1.40±0.10 1.45±0.73 ns
HDL (mmol/L) 1.87±0.05 1.77±0.05 ns
LDL (mmol/L) 3.31±0.13 3.30±0.10 ns
Bilirubin (mmol/L) 8.34±0.79 7.80±0.42 ns
Creatinine (mmol/L) 47.77±1.55 47.43±1.25 ns
AST (U/L) 18.45±0.53 18.70±0.83 ns
ALT (U/L) 14.58±0.88 15.77±1.62 ns
gGT (U/L) 13.32±0.78 13.17±0.96 ns
CRP (U/L) 6.27±0.70 5.99±0.60 ns
ALP (U/L) 56.81±2.89 53.60±2.25 ns
Pregnancies’outcome
Cesarean section (N) 13 11 ns
out of emergent fetal/maternal indication/total (N)
1/1/2 3/2/5 ns
GDM (N) 3 3 ns
PE (N) 0 0 ns
IUGR (N) 0 0 ns
Newborns’anthropometry
Bodyweight (g) 3,517.41±77.02 3,316.79±63.76 P< 0.05
Gestational week 39.80±0.19 39.30±0.20 ns
Chest circumference (cm) 34.41±0.29 33.57±0.26 P< 0.05
Head circumference (cm) 35.00±0.26 34.39±0.30 ns
Apgar 19 9.44±0.11 9.61±0.09 ns
Apgar 59 10.00±0.00 10.00±0.00 ns
Correlations between oxidative/nitrative stress, UtAPI and clinical data in the total study cohort
In the total study cohort, plasma total peroxide level showed negative correlation to UtAPI and positive correlation to the birth weight of the newborns (Table 2). On the other hand, TAC showed negative correlation to the number of previous pregnancies and positive correlation to serum bilirubin and creatinine levels (Table 2). Intracellular NT immunohistochemical staining intensity showed positive correlation togGT levels. It also positively correlated to the occur- rence of Cesarean section.
We also found that the negative correlation of UtAPI to birth weight in our cohort can be improved by combining UtAPI measurements with plasma PRX level by calculating their ratio (PIPX) (Table 3).
Fig. 2.Pulsatility index and nitrative stress markers. Panel A and B. Serum and mononuclear cell 3- nitrotyrosine levels were similar in the study groups. (N521; 28 andN516; 14). Data are presented as
mean±SEM, or Median [IQR]in case of TAC.p:P< 0.05,pp:P< 0.01,ppp:P< 0.001
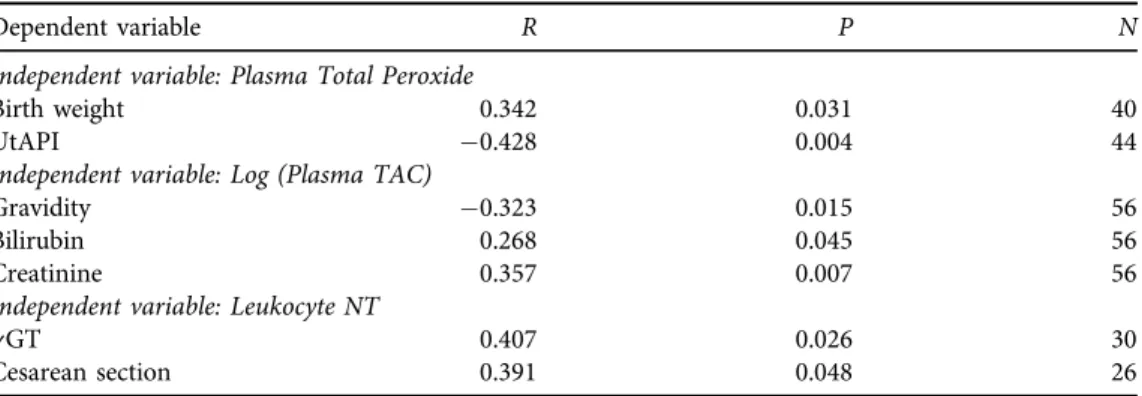
Table 2.Clinical parameters correlating to systemic oxidative/nitrative stress markers measured on the 12–
13th weeks of gestation. Plasma total peroxide level positively correlated to birth weight. Plasma total antioxidant capacity negatively correlated to the number of previous healthy pregnancies and positively to
serum bilirubin and creatinine levels. Intracellular tyrosine nitration of circulating mononuclear cells positively correlated togGT levels and the occurrence of Cesarean section
Dependent variable R P N
Independent variable: Plasma Total Peroxide
Birth weight 0.342 0.031 40
UtAPI 0.428 0.004 44
Independent variable: Log (Plasma TAC)
Gravidity 0.323 0.015 56
Bilirubin 0.268 0.045 56
Creatinine 0.357 0.007 56
Independent variable: Leukocyte NT
gGT 0.407 0.026 30
Cesarean section 0.391 0.048 26
Results only for primiparas
All statistical analysis was also repeated with primiparas only, and the results were similar to those of the entire study group.
DISCUSSION
Several research groups have examined the relationship between the first and second trimesters’ elevated UtAPI or resistance index and lower birth weight, mainly because of the risk for in- trauterine growth restriction (IUGR) [17–20]. In our healthy study cohort, the newborns of high-UtAPI mothers were born with significantly smaller weight and chest circumference than the newborns of the low-UtAPI group, although there was no difference in the gestational week at birth. In the total study cohort, UtAPI negatively correlated to the birth weight of the neonates that were within the normal range. These results may suggest that UtAPI measured in this period may indicate later placental function and fetal development also in physiological preg- nancy.
Plasma PRX indicating oxidative stress was significantly lower in the high UtAPI group, whereas total antioxidant capacity was significantly higher compared to the low UtAPI group.
Low oxygen tension in the first trimester having an important role in the initial normal placentation triples by the end of the first trimester, along with the levels of reactive oxygen species, a change that significantly contributes to further placental development. The placenta adapts to the elevated oxidative stress by modulating the levels of cellular antioxidants [21]. The low level of oxidative stress in the high UtAPI group may reflect the impairment or delay of this oxidative burst. This hypothesis may be supported by the negative correlation of oxidative stress to UtAPI and its positive correlation to birth weight of the neonates in the total study cohort even in physiological pregnancies –therefore further examination of oxidative stress markers might be also useful in pathological pregnancies. That is the reason why we try to develop more sensitive diagnostic indicators, like PIPX, involving classical and oxidative stress parameters.
As both UtAPI and plasma PRX showed a correlation to lower birth weight, we generated a variable that reflects their simultaneous change defined as PIPX:UtAPI/PRXp100. PIPX showed a stronger correlation to birth weight than UtAPI alone, suggesting that measuring oxidative stress may improve the predictive value of UtAPI on fetal development.
At this time, together with the oxidative burst, the secondary invasion of the trophoblast cells occurs in the placenta [22] that is associated with cellular degradation. Tissue degradation usually leads to the elevation of serum LDH concentration. In our study, serum LDH
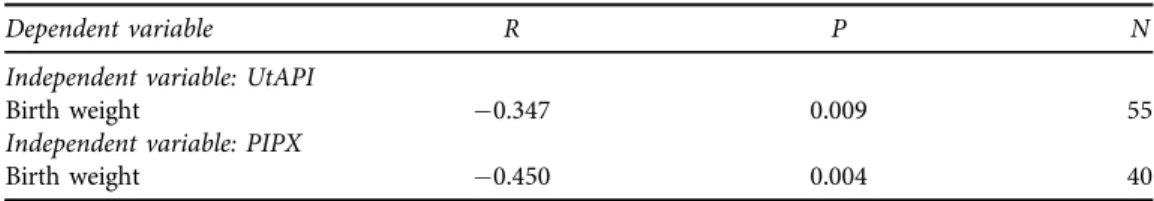
Table 3.Correlation of birth weight of the newborns to UtAPI, plasma total peroxide level and their combined variable PIPX (UtAPI/PRXp100). All analyzed parameters showed correlation to birth weight;
however, the strongest correlation could be found in case of PIPX
Dependent variable R P N
Independent variable: UtAPI
Birth weight 0.347 0.009 55
Independent variable: PIPX
Birth weight 0.450 0.004 40
concentration was lower in the high UtAPI group at the end of the first trimester. We hy- pothesize that this lower LDH reflects the decreased trophoblast invasion.
Additionally, it has been previously shown by our research group that even after a healthy pregnancy, the degree of oxidative stress is elevated after three years [16]. It is also conceivable that low-resistance pregnant women had higher oxidative stress levels because of their higher number of previous pregnancies. Our observation that plasma total antioxidant capacity negatively correlates to the number of previous pregnancies may also support this hypothesis.
Gravidity and parity were significantly higher in our low UtAPIgroup. This observation may be related to findings showing that multiparity protects against the development of high uterine artery pulsatility index. The significantly higher parity and gravidity in our low UtAPI group may reflect that multiparous women’s body had previously practiced the steps of placentation, leading to a higher chance of success in trophoblast invasion and circulatory adaptation [23].
Despite the decreased oxidative stress in the high UtAPI group, we found no difference in nitrative stress between the two study groups. Nitrotyrosine is mainly produced by the reaction of protein tyrosine residues and peroxynitrite, whereas peroxynitrite is produced by the reaction of nitric oxide and superoxide anion [24]. According to this reaction pathway, the change in nitrotyrosine levels might be expected to follow the changes in PRX concentration. On the other hand, previous studies also failed to confirm to this relationship, especially in chronic disease and healthy conditions [16, 25].
Intracellular nitrative stress showed a positive correlation to serumgGT value. Several prior studies suggested thatgGT could be used as a clinical marker of inflammation and oxidative stress. Simona Bo et al. studied the relationship between serum NT and serumgGT. Based on their results, these two markers showed a positive correlation [26]. An interestingfinding of our study is that the level of intracellular NT also correlated to Cesarean section outcome, however further investigations are required to clarify its mechanism and importance.
The limitations of the study were the relatively small number of cases and the high variability of oxidative/nitrative stress markers among pregnant women. Due to these, we were not able to define distinct cutoff values of oxidative/nitrative stress markers for pregnancy outcomes.
Combined parameters, like the variable calculated from UtAPI and PRX, could be expected to improve the predictive value of oxidative/nitrative stress parameters. On the other hand, additional studies are required to identify a more clinically relevant oxidative/nitrative stress parameter.
CONCLUSION
In conclusion, according to our results high UtAPI without other risk factors results in smaller newborns in the normal range. On the other hand, plasma oxidative stress and LDH were decreased in the high UtAPI group of our cohort that may be in connection with the disturbance of placentation. This hypothesis is further supported by our finding that combining UtAPI with an oxidative stress parameter (PRX) strengthens its correlation to birth weight. Measurement of oxidative stress markers together with UtAPI at the 12–13th weeks of gestation may provide additional information about placentation. We found significant differences also in the birth weight of healthy newborns; therefore it is worth examining this relationship in pathological pregnancies.
Data availability: According to the ethical approval, the detailed datasets of the present study cannot be shared with a third party without permission. Permission may be asked upon indi- vidual request.
Conflict of interest:The authors declare that no competing financial interests exist.
ACKNOWLEDGMENTS
The study was supported by the Hungarian National Research, Development and Innovation Office (OTKA-PD 113022). The funding sources had no involvement in the study design; in the collection, analysis and interpretation of data; in the writing of the report; or in the decision to submit the article for publication.
ABBREVIATIONS
gGT Gamma-glutamyl transferase GDM Gestational diabetes mellitus HRP Horse raddish peroxidase IUGR Intrauterine growth restriction LDH Lactate dehydrogenase NT Serum nitrotyrosine PlGF Placental growth factor
PAPP-A Plasma pregnancy related plasma protein A PE Praeclampsia
PIPX The quotient of UtAPI and plasma PRX, UtAPI/PRXp100 PRX Plasma total peroxide
sFlt-1 Soluble fms-like tyrosine kinase-1 TAC Plasma total antioxidant capacity UtAPI Uterine artery pulsatility index
REFERENCES
1. Gomez O, Figueras F, Fernandez S, Bennasar M, Martınez JM, Puerto B, et al. Reference ranges for uterine artery mean pulsatility index at 11-41 weeks of gestation. Ultrasound Obstet Gynecol 2008; 32(2): 128–32.
https://doi.org/10.1002/uog.5315.
2. Pijnenborg R, Bland JM, Robertson WB, Brosens I. Uteroplacental arterial changes related to interstitial trophoblast migration in early human pregnancy. Placenta 1983; 4(4): 397–413.
3. Jauniaux E, Greenwold N, Hempstock J, Burton GJ. Comparison of ultrasonographic and Doppler mapping of the intervillous circulation in normal and abnormal early pregnancies. Fertil Steril 2003; 79(1): 100–6.
4. McLeod L. How useful is uterine artery Doppler ultrasonography in predicting pre-eclampsia and intrauterine growth restriction? CMAJ 2008; 178(6): 727–9.https://doi.org/10.1503/cmaj.080242.
5. Gonzalez-Gonzalez NL, Gonzalez-Davila E, Gonzalez Marrero L, Padron E, Conde JR, Plasencia W. Value of placental volume and vascular flow indices as predictors of intrauterine growth retardation. Eur J Obstet Gynecol Reprod Biol 2017; 212: 13–9.https://doi.org/10.1016/j.ejogrb.2017.03.005.
6. Mosimann B, Amylidi-Mohr S, Holand K, Surbek D, Risch L, Raio L. Importance of Timing First-Trimester Placental Growth Factor and Use of Serial First-Trimester Placental Growth Factor Measurements in Screening for Preeclampsia. Fetal Diagn Ther 2017; 42(2): 111–6.https://doi.org/10.1159/000455946.
7. Kalousova M, Muravska A, Zima T. Pregnancy-associated plasma protein A (PAPP-A) and preeclampsia.
Adv Clin Chem 2014; 63: 169–209.
8. Karampas GA, Eleftheriades MI, Panoulis KC, Rizou MD, Haliassos AD, Metallinou DK, et al. Prediction of pre-eclampsia combining NGAL and other biochemical markers with Doppler in thefirst and/or second trimester of pregnancy. A pilot study. Eur J Obstet Gynecol Reprod Biol 2016; 205: 153–7.https://doi.org/10.
1016/j.ejogrb.2016.08.034.
9. Auten RL, Davis JM. Oxygen toxicity and reactive oxygen species: the devil is in the details. Pediatr Res 2009;
66(2): 121–7.https://doi.org/10.1203/PDR.0b013e3181a9eafb.
10. Pham-Huy LA, He H, Pham-Huy C. Free radicals, antioxidants in disease and health. Int J Biomed Sci 2008;
4(2): 89–96.
11. Sanchez-Aranguren LC, Prada CE, Riano-Medina CE, Lopez M. Endothelial dysfunction and preeclampsia:
role of oxidative stress. Front Physiol 2014; 5: 372.https://doi.org/10.3389/fphys.2014.00372.
12. Cuffe JS, Xu ZC, Perkins AV. Biomarkers of oxidative stress in pregnancy complications. Biomark Med 2017;
11(3): 295–306.https://doi.org/10.2217/bmm-2016-0250.
13. Horvath EM, Magenheim R, Kugler E, Vacz G, Szigethy A, Levardi F, et al. Nitrative stress and poly(ADP- ribose) polymerase activation in healthy and gestational diabetic pregnancies. Diabetologia 2009; 52: 1935–43.
14. Ramirez-Emiliano J, Fajardo-Araujo ME, Zuniga-Trujillo I, Perez-Vazquez V, Sandoval-Salazar C, Ornelas- Vazquez JK. Mitochondrial content, oxidative, and nitrosative stress in human full-term placentas with gestational diabetes mellitus. Reprod Biol Endocrinol 2017; 15(1): 26.https://doi.org/10.1186/s12958-017- 0244-7.
15. Valent S, Nemeth J, Sara L, Gidai J, Toth P, Schaff Z, et al. High early uterine vascular resistance values increase the risk of adverse pregnancy outcome independently from placental VEGF and VEGFR1 reactivities.
Eur J Obstet Gynecol Reprod Biol 2011; 156(2): 165–70.https://doi.org/10.1016/j.ejogrb.2011.01.029.
16. Horvath EM, Magenheim R, Beres NJ, Benk}o R, Pek T, TabakAG, et al. Oxidative/nitrative stress and poly (ADP-Ribose) polymerase activation 3 years after pregnancy. Oxid Med Cell Longev 2018; 2018: 1743253.
https://doi.org/10.1155/2018/1743253.
17. Sarmiento A, Casasbuenas A, Rodriguez N, Angarita AM, Sarmiento P, Sepulveda W. First-trimester uterine artery Doppler velocimetry in the prediction of birth weight in a low-risk population. Prenat Diagn 2013;
33(1): 21–4.https://doi.org/10.1002/pd.3997.
18. Martin AM, Bindra R, Curcio P, Cicero S, Nicolaides KH. Screening for pre-eclampsia and fetal growth restriction by uterine artery Doppler at 11-14 weeks of gestation. Ultrasound Obstet Gynecol 2001; 18(6):
583–6.https://doi.org/10.1046/j.0960-7692.2001.00594.x.
19. Sharma N, Srinivasan S, Jayashree K, Nadhamuni K, Subbiah M, Rajagopalan V. Prediction of intrauterine growth restriction in highpulsatility index of uterine artery. Br J Med Med Res 2017; 22(2): 1–6.https://doi.
org/10.9734/BJMMR/2017/34137.
20. Melchiorre K., Leslie K., Prefumo F., Bhide A., Thilaga B. First-trimester uterine artery Doppler indices in the prediction of -for-gestational age pregnancy and intrauterine growth restriction. Ultrasound Obstet Gynecol 2009; 33(5): 524–9.https://doi.org/10.1002/uog.6368.
21. Pereira AC, Martel F. Oxidative stress in pregnancy and fertility pathologies. Cell Biol Toxicol 2014; 30(5):
301–12.https://doi.org/10.1007/s10565-014-9285-2.
22. Zhou Y, McMaster M, Woo K, Janatpour M, Perry J, Karpanen T, et al. Vascular endothelial growth factor ligands and receptors that regulate human cytotrophoblast survival are dysregulated in severe preeclampsia and hemolysis, elevated liver enzymes, and low platelets syndrome. Am J Pathol 2002; 160(4): 1405–23.
https://doi.org/10.1016/S0002-9440(10)62567-9.
23. Lin JH, Liang AJ, Lin QD, Liu XH, Sun LZ, Zhang WY, et al. A multi-center study to evaluate the dynamic changes of uterine artery and umbilical arteryflow in a normal pregnancy and hypertensive disorders in pregnancy. Zhonghua Fu Chan Ke Za Zhi 2010; 45(8): 583–7.
24. Dijkstra G, Moshage H, van Dullemen HM, de Jager-Krikken A, Tiebosch AT, Kleibeuker JH, et al.
Expression of nitric oxide synthases and formation of nitrotyrosine and reactive oxygen species in inflam- matory bowel disease. J Pathol 1998; 186(4): 416–21. 10.1002/(SICI)1096-9896(199812)186:4<416::AID- PATH201>3.0.CO;2-U.
25. Molnar A, Toth A, Bagi Z, Papp Z,Edes I, Vaszily M, et al. Activation of the poly(ADP-ribose) polymerase pathway in human heart failure. Mol Med 2006; 12(7–8): 143–52.https://doi.org/10.2119/2006-00043.
26. Bo S, Gambino R, Durazzo M, Guidi M, Tiozzo E, Ghione F, et al. Associations between gamma-glutamyl transferase, metabolic abnormalities and inflammation in healthy subjects from a population-based cohort: a possible implication for oxidative stress. World J Gastroenterol 2005; 11(45): 7109–17.
Open Access. This is an open-access article distributed under the terms of the Creative Commons Attribution 4.0 International License (https://creativecommons.org/licenses/by/4.0/), which permits unrestricted use, distribution, and reproduction in any medium, provided the original author and source are credited, a link to the CC License is provided, and changes–if any–are indicated. (SID_1)