Versatility of microglial bioenergetic machinery under starving conditions
Adam M. Nagy, Rebeka Fekete, Gergo Horvath, Gabor Koncsos, Csilla Kriston, Anna Sebestyen, Zoltan Giricz, Zsuzsanna Kornyei, Emilia Madarasz, Laszlo Tretter
PII: S0005-2728(17)30193-7
DOI: https://doi.org/10.1016/j.bbabio.2017.12.002
Reference: BBABIO 47856
To appear in:
Received date: 5 September 2017 Revised date: 11 December 2017 Accepted date: 16 December 2017
Please cite this article as: Adam M. Nagy, Rebeka Fekete, Gergo Horvath, Gabor Koncsos, Csilla Kriston, Anna Sebestyen, Zoltan Giricz, Zsuzsanna Kornyei, Emilia Madarasz, Laszlo Tretter , Versatility of microglial bioenergetic machinery under starving conditions.
The address for the corresponding author was captured as affiliation for all authors. Please check if appropriate. Bbabio(2017),https://doi.org/10.1016/j.bbabio.2017.12.002
This is a PDF file of an unedited manuscript that has been accepted for publication. As a service to our customers we are providing this early version of the manuscript. The manuscript will undergo copyediting, typesetting, and review of the resulting proof before it is published in its final form. Please note that during the production process errors may be discovered which could affect the content, and all legal disclaimers that apply to the journal pertain.
ACCEPTED MANUSCRIPT
1
Title: Versatility of microglial bioenergetic machinery under starving conditions
Running title: Energy-donor substrates in starving microglia
Authors: Adam M. Nagy1, Rebeka Fekete2, Gergo Horvath1, Gabor Koncsos3, Csilla Kriston4, Anna Sebestyen4, Zoltan Giricz3, Zsuzsanna Kornyei2, Emilia Madarasz2, Laszlo Tretter1
1 Department of Medical Biochemistry and MTA-SE Laboratory for Neurobiochemistry, Semmelweis University; 1094 Tuzolto st. 37-47, Budapest, Hungary
2 Institute of Experimental Medicine of the Hungarian Academy of Sciences; 1083 Szigony st.
43, Budapest, Hungary
3 Department of Pharmacology and Pharmacotherapy, Semmelweis University; 1089 Nagyvarad square 4, Budapest, Hungary
4 1st Department of Pathology and Experimental Cancer Research, Semmelweis University;
1085 Ulloi st. 26, Budapest, Hungary
Laboratory of origin: Department of Medical Biochemistry and MTA-SE Laboratory for Neurobiochemistry, Semmelweis University; 1094 Tuzolto st. 37-47, Budapest, Hungary Correspondence:
Laszlo Tretter MD, PhD
Department of Medical Biochemistry, Semmelweis University H-1094 Budapest, Tuzolto st 37-47, Hungary
Tel: + 36 1 459 1500 / ext. 60020 Fax: + 36 1 267 0031
Email: tretter.laszlo@med.semmelweis-univ.hu
ACCEPTED MANUSCRIPT
2
Abstract
Microglia are highly dynamic cells in the brain. Their functional diversity and phenotypic versatility brought microglial energy metabolism into the focus of research. Although it is known that microenvironmental cues shape microglial phenotype, their bioenergetic response to local nutrient availability remains unclear.
In the present study effects of energy substrates on the oxidative and glycolytic metabolism of primary – and BV-2 microglial cells were investigated. Cellular oxygen consumption, glycolytic activity, the levels of intracellular ATP/ADP, autophagy, mTOR phosphorylation, apoptosis and cell viability were measured in the absence of nutrients or in the presence of physiological energy substrates: glutamine, glucose, lactate, pyruvate or ketone bodies.
All of the oxidative energy metabolites increased the rate of basal and maximal respiration.
However, the addition of glucose decreased microglial oxidative metabolism and glycolytic activity was enhanced. Increased ATP/ADP ratio and cell viability, activation of the mTOR and reduction of autophagic activity were observed in glutamine-supplemented media. Moreover, moderate and transient oxidation of ketone bodies was highly enhanced by glutamine, suggesting that anaplerosis of the TCA-cycle could stimulate ketone body oxidation.
It is concluded that microglia show high metabolic plasticity and utilize a wide range of substrates.
Among them glutamine is the most efficient metabolite. To our knowledge these data provide the first account of microglial direct metabolic response to nutrients under short-term starvation and demonstrate that microglia exhibit versatile metabolic machinery. Our finding that microglia have a distinct bioenergetic profile provides a critical foundation for specifying microglial contributions to brain energy metabolism.
Keywords
energy metabolism, mitochondria, glycolysis, glutamine, autophagy
Abbreviations
Artificial Cerebrospinal Fluid (ACSF), 3-hydroxybutyrate (BOHB), 2,4-dinitrophenol (DNP), carbonyl cyanide-p-trifluoromethoxyphenylhydrazone (FCCP), lactate dehydrogenase (LDH), phosphatidylethanolamine-conjugated LC3 (LC3 II), phosphatidylethanolamine-unconjugated LC3 (LC3 I)
ACCEPTED MANUSCRIPT
3
1. Introduction
Microglia comprise a highly responsive population of cells with a key role in the regulation of the immune surveillance of the central nervous system (Sandiego et al. 2015, Kettenmann et al. 2011, Davalos et al. 2005). Aside from surveying the brain parenchyma, several other functions are implicated with respect to these cells (Michell-Robinson et al. 2015), including the control of neuronal death (Bessis et al. 2007), synaptic pruning (Paolicelli et al. 2011), regulation of neural circuits (Schafer et al. 2012, Miyamoto et al. 2016, Wake et al. 2009) or the induction of the reactive astroglial phenotype (Liddelow et al. 2017).
Microglia, even in the “resting” state, represent highly dynamic cell populations in the central nervous system. They exhibit heterogeneous shapes following morphological reorganization, which enables them to effectively control the microenvironment with extreme motile processes, engulf tissue components and clear metabolic products (Nimmerjahn et al. 2005). The maintenance of the phospholipid bilayer and the constant restructuring of the actin-microtubule cytoskeleton are assigned to a significant fraction of the brain's energy consumption (Engl et al. 2017). In order to meet this energy requirement at different regions of the brain, microglia must have a continuous supply of energy substrates and require versatile metabolic machinery. These cells express a range of transporters for the import of fuel metabolites that are potentially present as energy donors in the cerebrospinal fluid: glucose, glutamine, pyruvate, lactate and ketone bodies (Nijland et al. 2014, Schilling & Eder 2004, Zhang et al. 2014). This expression profile differs from that of other cells in the CNS and enables microglia to adapt various metabolic conditions upon migration.
In addition to microglial high dynamic activity and unique expression profile, their phenotypic diversity is also a key interest that brings microglial energy metabolism more into the focus of research. Recent papers revealed a link between microglial polarization states and energy metabolism (Voloboueva et al. 2013, Gimeno-Bayon et al. 2014, Orihuela et al. 2015). These studies reveal important findings exploring microglial energy metabolism, showing a shift from oxidative to glycolytic metabolism in response to activation signals. Recent work has demonstrated that microglia from aged mice have a change in energy metabolism, making a shift from glycolytic energy provision to fatty acid oxidation (Flowers et al. 2017). These studies reveal important findings about microglial energy metabolism, however they consider microglial metabolic microenvironment as a constant factor.
Microenvironmental regulatory factors define microglial transcriptional network and maintain regional specialization of microglial phenotypes in the CNS (Gosselin et al. 2017, Trenkmann
ACCEPTED MANUSCRIPT
4 2017). Indeed, genes related to classical microglial cell processes, particularly cytoskeletal regulation and inflammatory signaling appear to be constitutively active, however, genes involved in mitochondrial function and cell metabolism are differentially expressed across brain regions (De Biase et al. 2017, Grabert et al. 2016). Despite intensive research in the field, key aspects of microglial bioenergetics have remained elusive.
Among the various cell types in the brain a close metabolic cooperation might exist. Glycolytic lactate is released from astrocytes and can be taken up by the neurons (Pellerin & Magistretti 1994, Dringen et al. 1993, Schurr et al. 1988). Neuronal glutamate is detoxified by astrocytes and the formed glutamine can be an energy source for neurons (Benjamin & Quastel 1974, Schousboe et al.
1992). On the other hand glutamate released from neurons could be an energy source for astrocytes (Schousboe et al. 1977). Astrocytes are able to produce ketone bodies that can be energy source of neurons (Blazquez et al. 1999). Neurons can release N-acetyl-aspartate and oligodendrocytes can utilize them (Chakraborty et al. 2001). Although microglial cells represent a high percentage of total cell number in the brain, yet the metabolic cooperation between microglia and other cells of the CNS remains incompletely understood.
The aim of this study therefore was to determine the potential substrates that support energy metabolism in starving microglial cells and to propose possible metabolic cooperations between microglia and other cell types in the CNS.
ACCEPTED MANUSCRIPT
5
2. Materials and Methods
2.1 Materials
Unless otherwise indicated, all reagents were obtained from Sigma-Aldrich (St Louis, MO, USA).
Glutamine was purchased from Merck KgaA (Darmstadt, Germany). Stock solutions of glutamine were prepared in bidistilled water, stored at -20°C and used only once after thawing to avoid degradation. For the assays, the medium was changed to artificial cerebrospinal fluid (ACSF) (145mM NaCl, 3 mM KCl, 2 mM CaCl2, 1 mM MgCl2, 10 mM HEPES; pH = 7.4).
2.2 Cell culture
BV-2 immortalized murine microglial cells (RRID:CVCL_0182), a kind gift from Prof. Rosario Donato (Department of Experimental Medicine and Biochemical Sciences, Perugia, Italy), were grown on Poly-L-lysine coated plastic tissue culture flasks in DMEM (Sigma D6546), supplemented with 4 mM glutamine, 10% FCS and 100 U/ml penicillin and 100 µg/ml streptomycin. This culture medium comprised the ‘DMEM control’ condition in all experiments.
Primary microglial cells were isolated from the forebrains of 1- to 2-day old CD1 mice according to (Saura et al. 2003). Both sexes of animals were included in the experiments; the ratio between male and female animals was 1:1. The animals were maintained and the experiments were performed in accordance with the Guidelines for Animal Experiments at Semmelweis University. The mice were euthanized via decapitation. Ten to thirteen animals were used per cell culture, resulting approximately 3x10⁶ microglial cells at the end of the isolation. Primary microglia were co-cultured with astrocytes and were grown on Poly-L-lysine coated plastic tissue culture petri dishes in MEM (Sigma M2279), supplemented with 4 mM glutamine, 10% FCS and 100 U/ml penicillin and 100 µg/ml streptomycin. At 24-26 days after isolation, microglial cells were harvested as previously described (Saura et al. 2003).
2.3 Measurement of mitochondrial oxidation and glycolytic activity
The oxygen consumption rate (OCR, which reflects mitochondrial oxidation) and the extracellular acidification rate (ECAR, which is considered a parameter of glycolytic activity) were measured using a microfluorimetric Seahorse XF96 Analyzer (Agilent Technologies, USA) as previously described (Gerencser et al. 2009, Nemeth et al. 2015, Jady et al. 2016). Primary microglial cells were seeded 48 hours prior to the assays in Poly-L-lysine coated XF96 cell culture microplates (Seahorse Bioscience) at 4x10⁴ cells/well density in 150 µl growth media. BV-2 cells were plated at
ACCEPTED MANUSCRIPT
6 1.5x10⁴ cells/well density in the same type of cell culture microplate 24 hours prior to the assays in 100 µl growth media. Two hours prior to the assay, the growth medium was changed to 180 µl ACSF assay medium. The O2 tension and pH values were detected, and the oxygen consumption rates and extracellular acidification rates were calculated via XF96 Analyzer software (Agilent Technologies, USA). The basal rate of respiration corresponded to the last 30 minutes of the two- hour-long starvation in ACSF. Substrates (glucose 10 mM, glutamine 2.5 mM, pyruvate 5 mM, lactate 5 mM, 3-hydroxybutyrate 5 mM (BOHB), and acetoacetate 5 mM) or metabolic inhibitors/modulators (oligomycin 5 µM, 2,4-dinitrophenol (DNP) 100 µM or carbonyl cyanide-p- trifluoromethoxyphenylhydrazone (FCCP) 1.5 μM as uncouplers, antimycin A 1 µM, and sodium oxamate 10 mM), prepared in assay media, were injected into each well during the measurement.
The concentrations of FCCP and oligomycin were titrated to obtain the maximal oxygen consumption/maximal inhibition, and the optimal 1.5 μM/5 μM were used in all experiments. DNP was also used in the measurements as an uncoupler instead of FCCP. No difference was identified between the effects of FCCP and DNP on the maximal respiration.
2.4 Measurement of intracellular ATP and ADP levels
The ATP and ADP levels were estimated using a Bioluminescent ATP assay kit (Biothema, Sweden). Measurements were performed on a Galaxy Bio-Orbit 1258 Microplate Luminometer in white luminescent microplates. Cell numbers were the same as described in the Measurement of mitochondrial oxidation and glycolytic activity subsection of the Materials and Methods part. On the day of the experiment, the cells were washed and incubated for two hours in ACSF medium (pre-warmed to 37°C). The ACSF was subsequently supplemented with the appropriate substrate (with the exception of in the control wells), and the cells were further incubated for two hours. This starvation protocol was followed in the other methods. Following four hours of incubation, the medium was changed to an ATP assay medium, and the extraction of ATP and ADP from the cells was immediately achieved with the addition of Extractant B/S (from Biothema). The ATP assay is based on the firefly luciferase reaction and was performed with a recombinant and thermostable luciferase according to (Lundin et al. 1986). The ATP and ATP+ADP assays were performed in two separate reaction mixtures. The measurements were performed in an ATP assay medium, which contained Tris 0.1 M, EDTA 2 mM, Potassium acetate 20 mM and phosphoenolpyruvate 1 mM.
Pyruvate kinase 2 U/ml was added to the wells in which the ATP+ADP levels were detected. The assays were individually calibrated by measuring the light before and after the addition of a known amount of the BioThema certified and liquid-stable ATP standard.
ACCEPTED MANUSCRIPT
7 2.5 Assessment of cell viability
The cell reduction capacity was measured using the MTT assay (3-(4,5-dimethylthiazol-2-yl)-2,5- diphenyltetrazolium bromide) and was considered a test for cell viability (Mosmann 1983). Cell numbers were the same as described in the Measurement of mitochondrial oxidation and glycolytic activity subsection of the Materials and Methods part. The incubation time and substrate conditions were the same as described for the ATP/ADP measurements: microglial cells were washed and incubated in nutrient-free ACSF for two hours; they were further incubated for two hours in ACSF assay medium, which was supplemented with a single substrate (with the exception of the ACSF controls). After four hours of incubation, MTT reagent was added, and the cells were further incubated at 37°C for one hour. The converted dye was subsequently solubilized by the addition of acidic isopropanol (0.04 M HCl in absolute isopropanol), and the absorbance intensity of λ = 570 nm light (proportional to the formazan concentration in the solution) was measured.
2.6 Apoptosis/necrosis assay
Apoptotic cells were detected using Annexin V – Cy3.18 (Vermes et al. 1995). The cell permeability was tested by the acethoxymethyl-calcein ester (calcein-AM; Invitrogen) method (Bozyczko-Coyne et al. 1993). 3x10⁵ cells were seeded onto Poly-L-lysine coated glass coverslips.
Prior to the annexin and calcein stainings, the cells were washed twice with ACSF, followed by incubation in ACSF that contained various substrates, at 37°C, with no CO2 supplementation. The incubation times in the ACSF and substrate concentrations were the same as described in the other methods: two hours of starvation was followed by two hours of incubation in substrate- supplemented media (with the exception of the ACSF controls). The microglial cells were subsequently stained with Annexin-V according to the manufacturer’s instructions. Briefly, the cells were incubated with 1 µg/ml Annexin V. Cy3.18 (Sigma A4963) for 10 min at room temperature.
The cells were simultaneously loaded with 1 µg/ml calcein-AM for 10 minutes at room temperature. After repeated washing steps live cells were immediately analyzed by a Zeiss Axiovert 200M microscope. The number of calcein and Annexin V positive cells were determined manually on images taken with a 10x EC plan-Neofluar objective, using Zeiss filter sets 20 and 38HE. The presented data are obtained from 4-4 experimental series (primary microglia and BV2 cells, n=3 for parallel cultures in each condition, 6-8 image from each culture). Cells stained only with calcein were considered vital cells. The Annexin-V labelled cells were considered necrotic, and the double stained cells comprised apoptotic cells.
ACCEPTED MANUSCRIPT
8 2.7 Western blot
BV-2 microglial cells were seeded onto Poly-L-lysine coated 6-well tissue culture plates at 3x10⁵ cells/well density. On the day of the experiment, the same starvation protocol was used as described in the other methods: two hours of incubation of the cells in nutrient-free ACSF was followed by an additional two-hour long incubation with a single substrate (with the exception of the ACSF controls). The cells were subsequently homogenized in RIPA lysis buffer (Thermo Fisher Scientific, Waltham, MA, US), supplemented with protease inhibitor (Roche, Basel, Switzerland) and PMSF (Sigma, St. Louis, MO, US). A Bicinchonic Acid Assay kit (Thermo Fisher Scientific, Waltham, MA, US) was used to measure the protein concentration of the lysates. Approximately 12-16 µg of protein from each lysate were mixed with reducing 5× Laemmli buffer, loaded and separated in a 4–20 % precast Tris–glycine SDS polyacrylamide gel (Bio-Rad, Hercules, CA, US).
The separated proteins were transferred to a polyvinylidene difluoride membrane (Bio-Rad, Hercules, CA, US) at 350 mA for 2 hours. Visualization of proper transfer was assessed via Ponceau S staining (Sigma, St. Louis, MO, US). The blockade of non-specific binding was conducted with 5% non-fat milk (Bio-Rad, Hercules, CA, US) or BSA (Santa Cruz Biotechnology, Dallas, TX, US) in Tris-buffered saline that contained 0.05 % Tween-20 (0.05% TBS-T; Sigma, St.
Louis, MO, US) at room temperature for two hours. Immunoblotting was performed as recommended by the antibody manufacturers. The primary antibodies (marker of autophagy:
microtubule-associated protein 1 light chain 3 II/I [LC3 II/I]—#4108; markers of mTOR pathway:
phospho-mTOR [Ser2448]—#2971; mTOR—#2972, phospho-AMP-activated protein kinase α [AMPKα; Thr172]—#2535; AMPKα—#5831) were purchased from Cell Signaling (Danvers, MA, US). Immunoreactivity was detected with the corresponding horseradish peroxidase-conjugated secondary antibody (Cell Signaling, Danvers, MA, US) for 2 h at room temperature. The signals were detected with an enhanced chemiluminescence detection reagent (Bio-Rad, Hercules, CA, US) by Chemidoc XRS+ (Bio-Rad, Hercules, CA, US). For the removal of antibodies that detected phosphorylated epitopes, Pierce Stripping Buffer (Thermo Fisher Scientific, Waltham, MA, US) was used prior to incubation with antibodies that detected the total protein.
2.8 Flow cytometry
BV-2 microglial cells were incubated in nutrient-free ACSF for two hours; the ACSF assay medium was subsequently supplemented with a single substrate (with the exception of the ACSF controls) in the same way as described in the other methods. For the p-S6 expression analysis, 5x10⁵ cells/condition were stained using the PerFix-nc Kit (Beckman Coulter) following the manufacturer’s instructions. The p-S6 expression was detected with direct-labelled monoclonal p-
ACCEPTED MANUSCRIPT
9 S6 antibody (Cell Signaling #5316). The samples were measured on a Navios flow cytometer (Beckman Coulter) and analysed using Kaluza software (Beckman Coulter).
2.9 Statistical Analysis
Data were pooled from a minimum of three individual experiments and are presented as the mean ± SEM. Significant differences between multiple groups were determined via one-way ANOVA and ANOVA on ranks was used, when the normality assumption has been violated. Individually determined p values are presented in Figure legends. Statistical analyses were performed using the Sigmaplot Systat software (RRID:SCR_003210).
ACCEPTED MANUSCRIPT
10
3. Results
3.1 Effects of energy substrates on cellular respiration and glycolytic activity 3.1.1 Effect of single substrates on cellular respiration and glycolytic activity
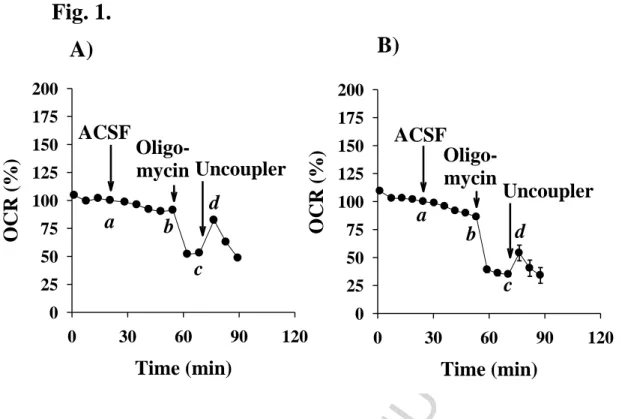
The measurement of the oxygen consumption of intact, adherent cells is one of the most direct, dynamic methods to quantify in situ mitochondrial function. In this study, the effects of different energy substrates, which may be present in the CSF, on the cellular respiration of primary and BV-2 microglia were investigated using a Seahorse XF96 Extracellular Flux Analyzer and the summary of the data is presented in Table 1A and 1B. The values are expressed as a percentage of the basal level of respiration measured in the absence of metabolic fuels. It is important to note that in 30 minutes, the respiratory rate of primary microglia was decreased to 89.76 ± 1.08 % and to 85.29 ± 0.85 % by the BV-2 cells following starvation in ACSF in the absence of exogenous energy donor substrates (Fig. 1 and Table 1, Row b). Thus, BV-2 cells were slightly more sensitive to starvation compared with primary microglial cells. To determine the oxygen consumption associated with ATP synthesis, the mitochondrial F1Fo - ATP synthase was inhibited with oligomycin, which resulted in a decrease in the mitochondrial oxygen consumption (Table 1, Row c). The part of respiration used for oxidative phosphorylation was calculated from i) the oxygen consumption measured in the presence of substrate (b) and ii) the oxygen consumption measured in the presence of an ATP-synthase inhibitor (c) using formula (b-c).
Maximal respiration may be elicited by the addition of the protonophore FCCP, which induces the collapse of the mitochondrial membrane potential. In the presence of FCCP, the mitochondrial electron transport chain may operate without the limitation of respiration by the high electrochemical proton gradient across the inner mitochondrial membrane. Thus, uncoupling the oxidative phosphorylation with FCCP enables the determination of the maximal respiration, which may be limited by the substrate supply. The small response of starving cells to FCCP demonstrates the limited substrate supply (Table 1, Row d). In this condition, cells may only rely on endogenous reserve substrates, potentially amino acids, derived from proteolysis, and fatty acids. Uncoupler on one hand stimulates the respiration, but on the other hand this stimulation accelerates the consumption of reserves, thus the transient stimulation is followed by a fast decay. To address the contribution of fatty acids in the respiration of starving cells, Etomoxir was added to inhibit the mitochondrial long-chain fatty acid transporter CPT-1. A decline was observed in mitochondrial oxygen consumption upon the injection of the inhibitor (data not shown), which may reflect the utilization of endogenous lipids, but other off-target effects are also related to Etomoxir.
ACCEPTED MANUSCRIPT
11 Time (min)
0 30 60 90 120
OCR (%)
0 25 50 75 100 125 150 175 200
Time (min)
0 30 60 90 120
OCR (%)
0 25 50 75 100 125 150 175 200
ACSF
Uncoupler Oligo-
mycin
Fig. 1.
A) B)
ACSF
Uncoupler Oligo-
mycin
a b
c
a b
c d
d
Fig. 1. Representative curves of oxygen consumption rates measured in primary (A) - and BV-2 (B) microglial cells in the absence of additional substrate. Starving conditions were as described in Materials and Methods. Respiratory variables are as indicated in Table 1A and 1B (Column: ACSF control): basal respiration (a); respiration with(out) substrate (b); respiration remaining after the inhibition of ATP-synthase (c). Data show the average values of 8-12 parallel wells ± SEM. Abbreviations: OCR (Oxygen Consumption Rate), ACSF (Artificial Cerebrospinal Fluid)
Glucose is considered a primary energy source of the brain. A decrease was identified in the basal level of oxygen consumption by primary and BV-2 cells (69.88 ± 4.38 and 61.41 ± 1.07,
respectively) following the addition of glucose; these findings suggest that after two hours of starvation, exogenously added glucose reduces the mitochondrial respiration of microglial cells.
The portion of oxygen consumption that is coupled to ATP synthesis was significantly decreased in the glucose-supplied compared with control starving cells (22.29 ± 1.27 versus 35.84 ± 1.31 in primary cells). However, the maximal respiration, elicited by the addition of FCCP, was
significantly increased in the primary and BV-2 cells (111.81 ± 5.35 and 80.44 ± 5.29, respectively) compared with the cells starving in ACSF (Table 1A and 1B, Row d). Similarly, the reserve
respiration (the difference between the maximal (uncoupler stimulated) respiration and the
respiration measured in the presence of substrate) was elevated in the presence of glucose by 41.9 ± 3.0 % in primary microglial cells and by 19.0 ± 5.0 % in BV-2 cells.
ACCEPTED MANUSCRIPT
12 Parallel with the measurement of cellular respiration, the change in the pH in the ACSF was detected and considered a parameter of the glycolytic activity. The basal rate of acidification (100
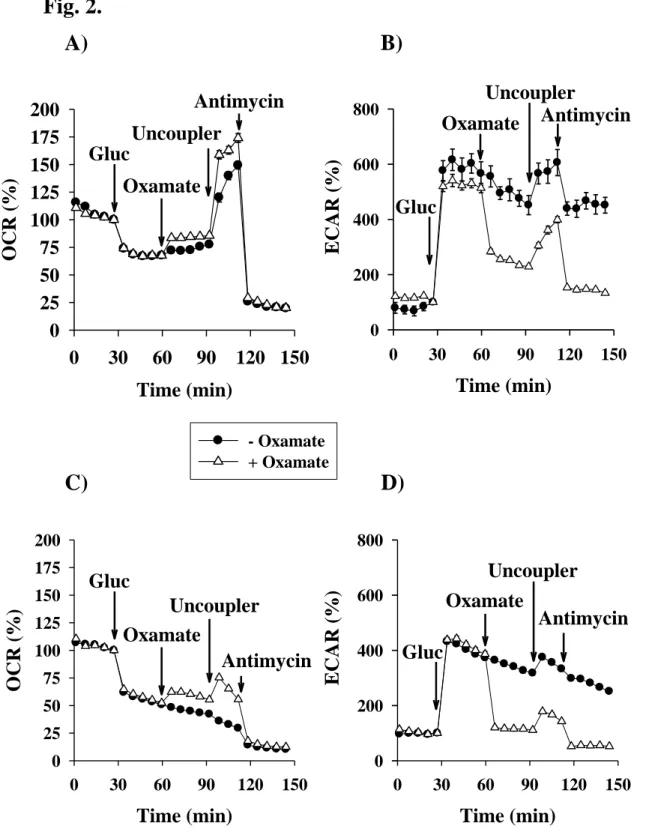
%) was equal to 1.5 mpH/min/40,000 cell extracellular acidification rate by primary cultures of microglia and to 4.0 mpH/min/15,000 cell extracellular acidification rate by BV-2 cells. Glycolytic activity was markedly increased in the primary microglial cells and in the BV-2 microglial cells following the addition of glucose (Fig. 2B and 2D); these findings indicate that pyruvate produced in glycolysis is mainly converted to lactate instead of being oxidized by mitochondria. As expected, this high rate of acidification slowed down after the addition of sodium oxamate (10 mM), an inhibitor of lactate dehydrogenase (LDH). Oxamate reduced the glycolytic rate of the primary microglia from 500 % to 250 %, whereas in the BV-2 cells a complete block of lactate production was observed (Fig. 2B and 2D). Uncoupling the mitochondrial oxidative phosphorylation with FCCP resulted in an increase in acidification; the rate of which was decreased upon addition of the mitochondrial complex III inhibitor, antimycin (Fig. 2B and 2D). Oxamate addition provoked a slight increase in the cellular respiration as well as in the maximal respiration (Fig. 2A and 2C).
ACCEPTED MANUSCRIPT
13 Time (min)
0 30 60 90 120 150
ECAR (%)
0 200 400 600 800
Time (min)
0 30 60 90 120 150
OCR (%)
0 25 50 75 100 125 150 175 200
- Oxamate + Oxamate
Oxamate Uncoupler Gluc
Antimycin
Oxamate
Uncoupler
Gluc
Antimycin
Time (min)
0 30 60 90 120 150
OCR (%)
0 25 50 75 100 125 150 175 200
Time (min)
0 30 60 90 120 150
ECAR (%)
0 200 400 600 800
Oxamate
Uncoupler Gluc
Antimycin
Oxamate
Uncoupler
Gluc
Antimycin
Fig. 2.
A)
C)
B)
D)
Fig. 2. Effect of lactate dehydrogenase inhibitor sodium oxamate on mitochondrial oxygen consumption and on glycolytic activity measured in primary (A, B) - and BV-2 (C, D) microglial cells in the presence of glucose. Starving conditions were as described in Materials and Methods. Metabolic inhibitors were given as indicated on Figures. Data points were obtained from 3 independent experiments and represent the mean values of 8-12 parallel wells ± SEM. Abbreviations: OCR (Oxygen Consumption Rate), ECAR (Extracellular Acidification Rate), Gluc (Glucose)
ACCEPTED MANUSCRIPT
14 Glutamine is abundantly present in the brain; its concentration in the CSF is one order of magnitude higher than that of other amino acids (Albrecht et al. 2007, McGale et al. 1977).
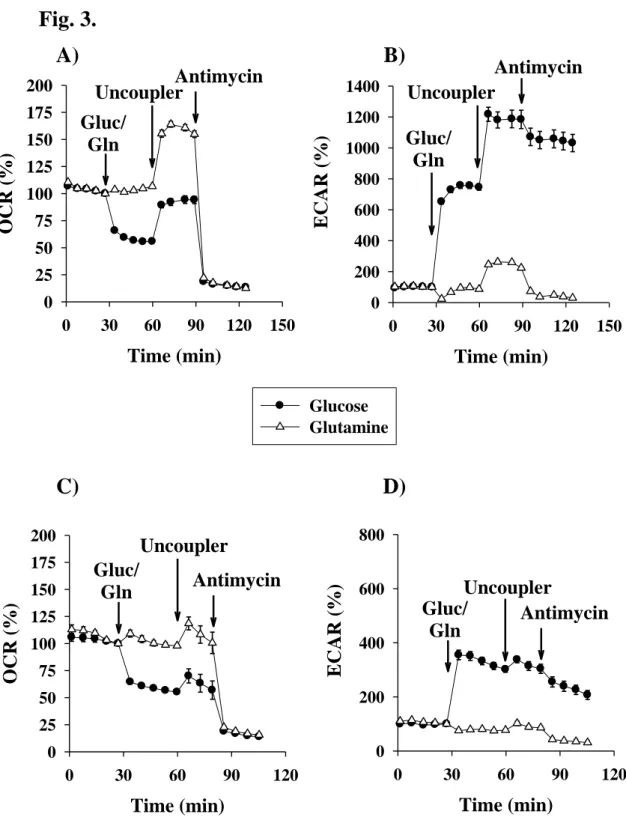
Following transport through the cell membrane and mitochondrial inner membrane, in two steps, glutamine is converted to α-ketoglutarate, which may subsequently enter the TCA-cycle and contribute to the energy provision. The accumulation of ammonium in mitochondria may induce apoptosis in microglial cells when glutamine is present in increased concentrations in the cellular medium (Svoboda & Kerschbaum 2009). To avoid ammonium toxicity, a more physiologic 2.5 mM concentration of glutamine was used in our experiments and no reduction in the cell viability was identified (see later in Fig. 7). In the present study, the addition of glutamine after two hours of starvation slightly increased the basal respiration of primary and BV-2 microglial cells (115.39 ± 6.05 % and 121.54 ± 3.78 %, respectively). After the inhibition of glutamine-driven ATP synthesis with oligomycin, the percentage of remaining respiration (48.79 ± 1.42 %) was significantly increased compared with the starving control oxygen consumption (37.55 ± 0.75 %) in the BV-2 cells. This respiration may reflect the membrane potential dependent transport mechanisms through the inner mitochondrial membrane. The maximal respiration achieved by the addition of FCCP was significantly increased in the glutamine-supported primary and BV-2 microglial cells (148.62 ± 4.14 and 131.57 ± 5.19, respectively). The reserve respiration capacity was stimulated upon adding glutamine as an exogenous substrate by 33.2 ± 5.0 % in primary microglia and by 10.0 ± 3.2 % in BV-2 cell line.
A 2 mpH/min increase in the extracellular acidification was identified in the presence of glutamine following the addition of the uncoupler. The respiratory complex III inhibitor Antimycin A decreased this acidification, which may reflect that the uncoupler mediated acidification was a consequence of an increased rate of oxidative decarboxylation during glutamine metabolism (Fig.
3B and 3D).
ACCEPTED MANUSCRIPT
15 Time (min)
0 30 60 90 120 150
OCR (%)
0 25 50 75 100 125 150 175 200
Glucose Glutamine
Time (min)
0 30 60 90 120 150
ECAR (%)
0 200 400 600 800 1000 1200
Uncoupler 1400
Gluc/
Gln
Antimycin
Uncoupler Gluc/
Gln
Antimycin
Time (min)
0 30 60 90 120
OCR (%)
0 25 50 75 100 125 150 175 200
Time (min)
0 30 60 90 120
ECAR (%)
0 200 400 600
Uncoupler 800
Gluc/
Gln Antimycin Uncoupler
Gluc/
Gln Antimycin
Fig. 3.
A)
C)
B)
D)
Fig. 3. Effect of glutamine and glucose on mitochondrial oxygen consumption and on glycolytic activity measured in primary (A, B) - and BV-2 (C, D) microglial cells upon starvation. Starving conditions were as described in Materials and Methods. Additions were as shown on Figures. Data are pooled at least from 3 independent cell culture preparations and show the average values of 8-12 parallel wells ± SEM.
Abbreviations: OCR (Oxygen Consumption Rate), ECAR (Extracellular Acidification Rate), Gluc (Glucose), Gln (Glutamine)
ACCEPTED MANUSCRIPT
16 Pyruvate may serve as a potential energy substrate in the central nervous system (Peng et al. 1994).
In this study, the basal level of respiration was increased by the addition of pyruvate, which was more pronounced in the primary cultures of microglia (118.23 ± 5.65 %) compared with the BV-2 cells (91.78 ± 3.26 %). The uncoupler mediated stimulation of respiration was the most pronounced in the presence of pyruvate in the primary microglia and was the second highest to glutamine in the BV-2 cells (Table 1A and 1B, Row d). The reserve respiration was increased by 46.3 ± 3.0 % in primary microglia (Table 1A, Rows (d-b)).
Lactate comprises another important energy metabolite in the CSF; it is proposed to be an oxidative substrate for neurons and oligodendrocytes (Rinholm & Bergersen 2014, Magistretti &
Allaman 2015), whereas its contribution to microglial energy metabolism is yet unknown. We found a significant stimulation of basal respiration following the addition of lactate in the primary cultures of microglia and BV-2 cells (105.32 ± 2.05 % and 95.97 ± 3.10 %, respectively) compared with the ACSF control (89.76 ± 1.08 and 85.29 ± 0.85, respectively). The extent of inhibition by oligomycin indicates that approximately 50% of the respiration is associated with ATP synthesis (Table 1A and 1B, Row c). However, the respiration driving ATP synthesis was very low with lactate in the primary cells (49.84 ± 1.67). The administration of the uncoupler FCCP significantly augmented the rate of oxidation in both the primary and BV-2 microglial cells (133.37 ± 3.37 % and 93.39 ± 5.69 %, respectively) compared with the ACSF control cells (Table 1A and 1B, Row d).
Ketone bodies may serve as alternative fuels for cells in the brain under energy-deprived conditions (Izumi et al. 1998, Owen et al. 1967). Beta-hydroxybutyrate (BOHB) is a ketone body that is converted to acetoacetate and subsequently to acetoacetyl-CoA, thereby forming two acetyl- CoA molecules that may enter into the TCA-cycle. The addition of BOHB after two hours of starvation resulted in a small and significant increase in the mitochondrial oxidation identified in primary and BV-2 cells (106.57 ± 2.50 and 98.86 ± 2.10 %, respectively) compared with the ACSF control (89.76 ± 1.08 and 85.29 ± 0.85, respectively). In the primary cultures of microglia, the oxygen consumption driving ATP synthesis was high with BOHB (56.61 ± 2.18 %). Upon addition of FCCP maximal respiration hardly reached basal level in the primary microglia (108.24 ± 5.21) (Table 1A, Row d). Reserve respiratory capacity with BOHB was near to zero in primary microglia, but with BV-2 cells it was negative (-17.0 ± 5.5), i.e. respiration after uncoupler addition was lower than that immediately after substrate addition (Table 1A and 1B, Rows (d-b)).
ACCEPTED MANUSCRIPT
17 3.1.2 Effect of substrate combinations on cellular respiration and glycolytic activity
Combination of acetoacetate and glutamine
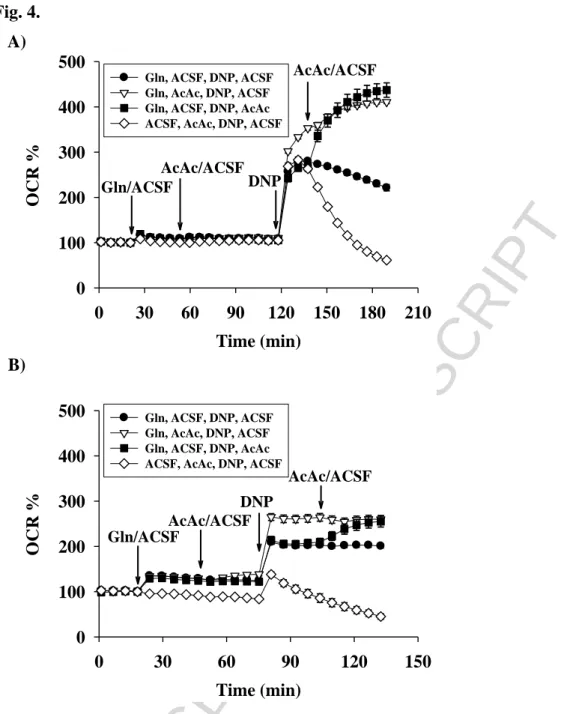
In the first metabolic step in BOHB utilization, acetoacetate is produced, which is further metabolized in the presence of glutamine. The effects of acetoacetate supplementation on the uncoupled rate of oxygen consumption by primary and BV-2 cells in the presence of glutamine are presented in Fig. 4A and 4B. The maximal respiration reached by the addition of DNP was significantly smaller in the absence of acetoacetate than that with the glutamine plus acetoacetate.
The addition of acetoacetate stimulated the uncoupler-mediated respiration by 160 % in the primary cells and 120 % in the BV-2 cells when glutamine was present in the media. Similar acceleration of uncoupler-mediated oxygen consumption was detected when BOHB was applied instead of acetoacetate (data not shown).
ACCEPTED MANUSCRIPT
18 Time (min)
0 30 60 90 120 150 180 210
OCR %
0 100 200 300 400 500
Gln, ACSF, DNP, ACSF Gln, AcAc, DNP, ACSF Gln, ACSF, DNP, AcAc ACSF, AcAc, DNP, ACSF
Gln/ACSF
AcAc/ACSF DNP
AcAc/ACSF
Time (min)
0 30 60 90 120 150
OCR %
0 100 200 300 400
500 Gln, ACSF, DNP, ACSF Gln, AcAc, DNP, ACSF Gln, ACSF, DNP, AcAc ACSF, AcAc, DNP, ACSF
Gln/ACSF
AcAc/ACSF DNP
AcAc/ACSF Fig. 4.
A)
B)
Fig. 4. Effect of acetoacetate on glutamine-driven respiration measured in primary (A) - and BV-2 (B) microglial cells after starvation. Starving conditions were as described in Materials and Methods. Additions were as shown on Figures. Abbreviations: OCR (Oxygen Consumption Rate), ECAR (Extracellular Acidification Rate), Gluc (Glucose), Gln (Glutamine), ACSF (Artificial Cerebrospinal Fluid), AcAc (Acetoacetate), DNP (2,4-dinitrophenol)
Combination of malate or aspartate with substrates contributing to acetyl-CoA formation (glucose, pyruvate or lactate)
Results presented above with substrate combination (glutamine plus oxaloacetate) underline the importance of anaplerosis in starving cells. In further experiments malate or aspartate were used as
ACCEPTED MANUSCRIPT
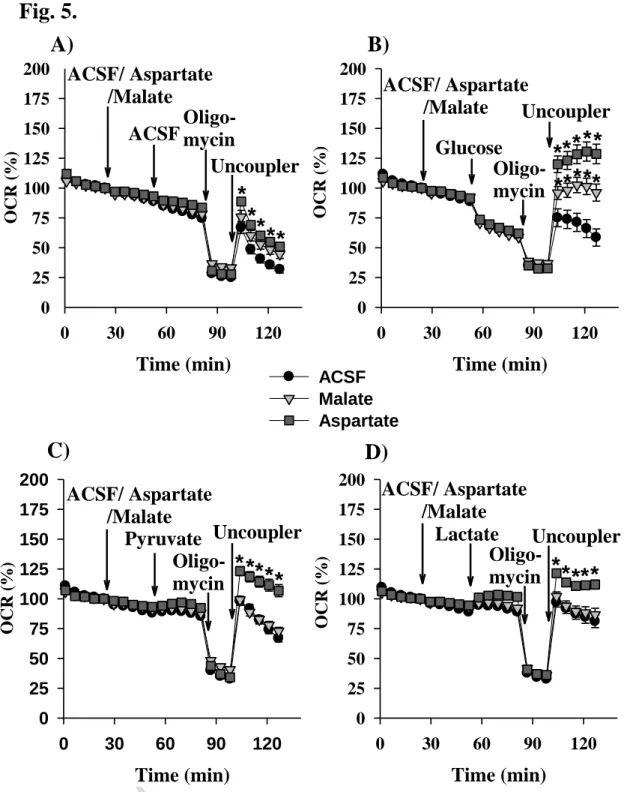
19 possible anaplerotic substrates for the citrate synthase reaction. In order to investigate their anaplerotic capacity ACSF, or glucose, or pyruvate or lactate were added as “test” substrates. Only the aspartate pre-treatment was able to induce significant changes in maximal respiration with all the four test substrates used. In the presence of malate, a significant change in the maximal respiration was detected only with the glucose test substrate (Fig. 5. A-D).
ACCEPTED MANUSCRIPT
20 Time (min)
0 30 60 90 120
OCR (%)
0 25 50 75 100 125 150 175 200
ACSF Malate Aspartate
Time (min)
0 30 60 90 120
OCR (%)
0 25 50 75 100 125 150 175 200
Time (min)
0 30 60 90 120
OCR (%)
0 25 50 75 100 125 150 175 200
Time (min)
0 30 60 90 120
OCR (%)
0 25 50 75 100 125 150 175
200 ACSF/ Aspartate /Malate
Oligo- mycin
Uncoupler Glucose
Oligo- mycin
Uncoupler ACSF
Fig. 5.
A) B)
C) D)
ACSF/ Aspartate /Malate
Oligo- mycin
Uncoupler Pyruvate
ACSF/ Aspartate /Malate
Uncoupler Lactate
Oligo- mycin
* *
*
* *
* ***
** **
****
**** ****
ACSF/ Aspartate /Malate
Fig. 5. Effect of aspartate and malate on starving (A), glucose - (B), pyruvate - (C) and lactate – driven respiration of BV-2 microglial cells. Starving conditions were as described in Materials and Methods.
Additions were as shown on Figures. Data are pooled at least from 3 independent cell culture preparations and show the average values of 12-15 parallel wells ± SEM. Abbreviations: OCR (Oxygen Consumption Rate), ACSF (Artificial Cerebrospinal Fluid)
ACCEPTED MANUSCRIPT
21 Table 1.
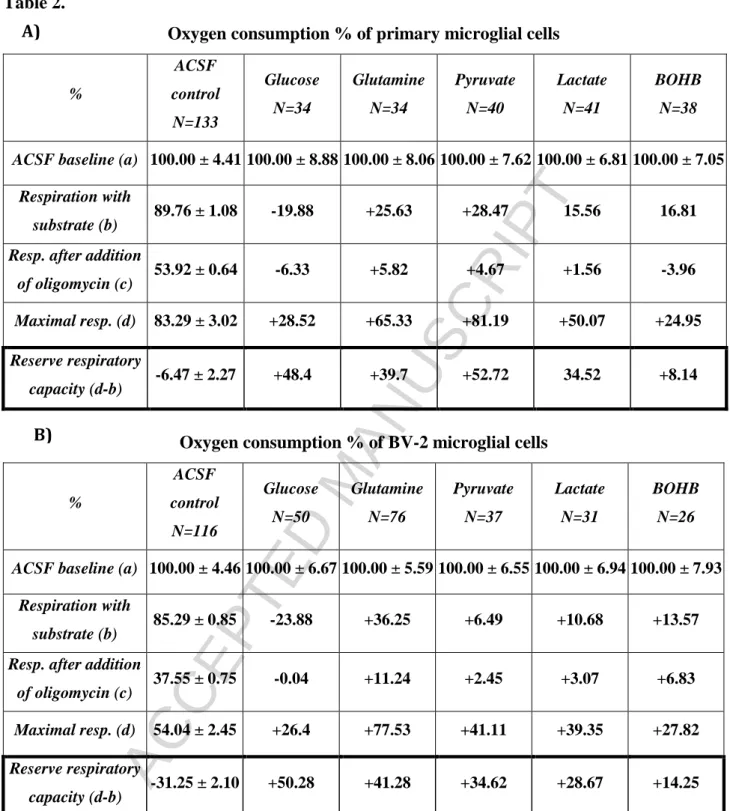
Oxygen consumption % of primary microglial cells
%
ACSF control N=133
Glucose N=34
Glutamine N=34
Pyruvate N=40
Lactate N=41
BOHB N=38
ACSF baseline (a) 100.00 ± 4.41100.00 ± 8.88100.00 ± 8.06100.00 ± 7.62100.00 ± 6.81100.00 ± 7.05 Respiration with
substrate (b) 89.76 ± 1.08 69.88 ± 4.38 115.39 ± 6.05118.23 ± 5.65105.32 ± 2.05106.57 ± 2.50 Resp. after addition
of oligomycin (c) 53.92 ± 0.64 47.59 ± 3.60 59.74 ± 4.28 58.59 ± 4.14 55.48 ± 2.62 49.96 ± 3.19 Maximal resp. (d) 83.29 ± 3.02 111.81 ± 5.35148.62 ± 4.14164.48 ± 5.91133.37 ± 3.37108.24 ± 5.21 Resp. driving ATP
synth. (b-c) 35.84 ± 1.31 22.29 ± 1.27 55.65 ± 2.62 59.64 ± 3.06 49.84 ± 1.67 56.61 ± 2.18 Reserve respiratory
capacity (d-b) -6.47 ± 2.27 41.93 ± 3.00 33.23 ± 5.02 46.25 ± 3.03 28.05 ± 4.92 1.67 ± 7.14 A)
ACCEPTED MANUSCRIPT
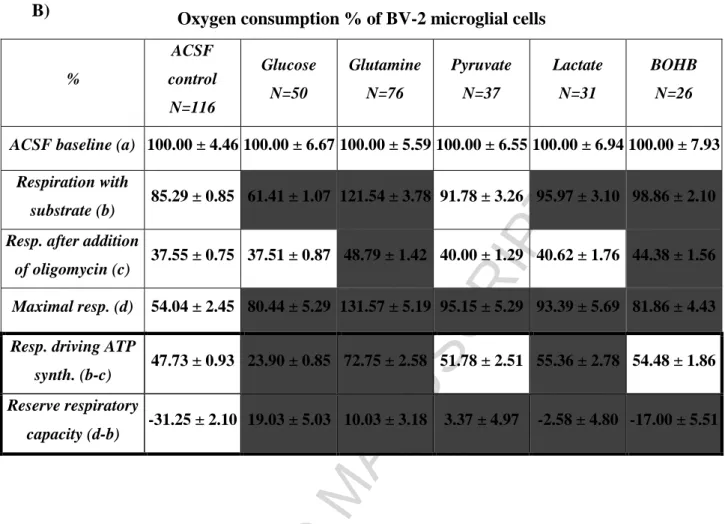
22 Oxygen consumption % of BV-2 microglial cells
%
ACSF control N=116
Glucose N=50
Glutamine N=76
Pyruvate N=37
Lactate N=31
BOHB N=26
ACSF baseline (a) 100.00 ± 4.46100.00 ± 6.67100.00 ± 5.59100.00 ± 6.55100.00 ± 6.94100.00 ± 7.93 Respiration with
substrate (b) 85.29 ± 0.85 61.41 ± 1.07 121.54 ± 3.78 91.78 ± 3.26 95.97 ± 3.10 98.86 ± 2.10 Resp. after addition
of oligomycin (c) 37.55 ± 0.75 37.51 ± 0.87 48.79 ± 1.42 40.00 ± 1.29 40.62 ± 1.76 44.38 ± 1.56 Maximal resp. (d) 54.04 ± 2.45 80.44 ± 5.29 131.57 ± 5.19 95.15 ± 5.29 93.39 ± 5.69 81.86 ± 4.43 Resp. driving ATP
synth. (b-c) 47.73 ± 0.93 23.90 ± 0.85 72.75 ± 2.58 51.78 ± 2.51 55.36 ± 2.78 54.48 ± 1.86 Reserve respiratory
capacity (d-b) -31.25 ± 2.10 19.03 ± 5.03 10.03 ± 3.18 3.37 ± 4.97 -2.58 ± 4.80 -17.00 ± 5.51
Table 1. Respiratory variables obtained with primary - (A) and BV-2 (B) microglial cells using different substrates. ACSF baseline was measured after two hours of incubation in ACSF without any addition of substrates. After starvation glucose, glutamine, pyruvate, lactate or BOHB was added except control wells.
Respiratory variables: (a) basal respiration (average value of measurements before the addition of substrate);
(b) respiration with substrate (average value of measurements prior to the addition of metabolic inhibitors);
(c) respiration remaining after the inhibition of ATP-synthase (average value of measurements after the addition of oligomycin); (d) maximal respiration (average value of measurements after the addition of FCCP); (b-c) respiration driving ATP synthesis; reserve respiratory capacity (d-b). Data are expressed as % of control (ACSF baseline) and means ± SEM. Cells highlighted with black shading indicate statistically significant difference (P < 0.05) versus ACSF control evaluated by one-way ANOVA. 100 % was equal to 94.98 ± 2.58 pmol/min/40,000 cell oxygen consumption by primary cultures of microglia and to 160.82 ± 4.05 pmol/min/15,000 cell oxygen consumption by BV-2 cells. Data are pooled from minimum 3 independent cell culture preparations. N reflects the number of analyzed microcultures.
B)
ACCEPTED MANUSCRIPT
23 Table 2.
Oxygen consumption % of primary microglial cells
%
ACSF control N=133
Glucose N=34
Glutamine N=34
Pyruvate N=40
Lactate N=41
BOHB N=38
ACSF baseline (a) 100.00 ± 4.41100.00 ± 8.88100.00 ± 8.06100.00 ± 7.62100.00 ± 6.81100.00 ± 7.05 Respiration with
substrate (b) 89.76 ± 1.08 -19.88 +25.63 +28.47 15.56 16.81 Resp. after addition
of oligomycin (c) 53.92 ± 0.64 -6.33 +5.82 +4.67 +1.56 -3.96 Maximal resp. (d) 83.29 ± 3.02 +28.52 +65.33 +81.19 +50.07 +24.95 Reserve respiratory
capacity (d-b) -6.47 ± 2.27 +48.4 +39.7 +52.72 34.52 +8.14
Oxygen consumption % of BV-2 microglial cells
%
ACSF control N=116
Glucose N=50
Glutamine N=76
Pyruvate N=37
Lactate N=31
BOHB N=26
ACSF baseline (a) 100.00 ± 4.46100.00 ± 6.67100.00 ± 5.59100.00 ± 6.55100.00 ± 6.94100.00 ± 7.93 Respiration with
substrate (b) 85.29 ± 0.85 -23.88 +36.25 +6.49 +10.68 +13.57 Resp. after addition
of oligomycin (c) 37.55 ± 0.75 -0.04 +11.24 +2.45 +3.07 +6.83 Maximal resp. (d) 54.04 ± 2.45 +26.4 +77.53 +41.11 +39.35 +27.82 Reserve respiratory
capacity (d-b) -31.25 ± 2.10 +50.28 +41.28 +34.62 +28.67 +14.25
Table 2. was created from data of Table 1A and 1B. In every row corresponding ACSF control values were subtracted from ACSF plus substrate rates.
A)
B)
ACCEPTED MANUSCRIPT
24 3.2 Effects of energy substrates on the intracellular ATP and ADP levels
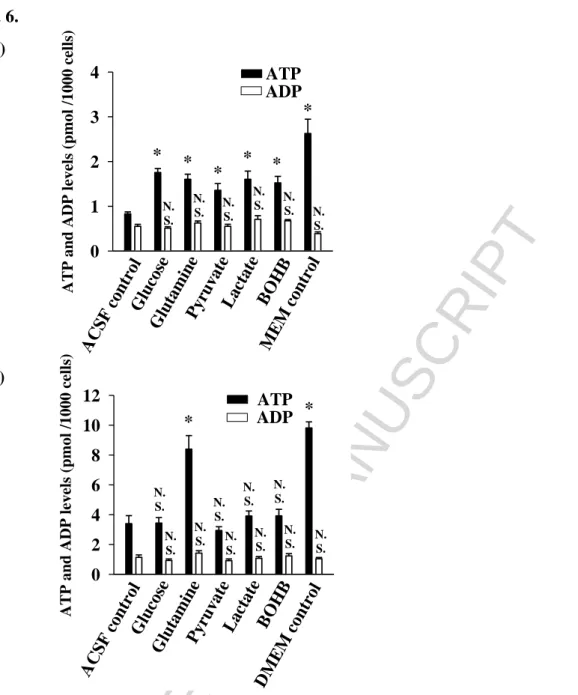
The intracellular ATP and ADP levels were also determined following the incubation of cells with a single glycolytic or oxidative substrate for two hours. Prior to substrate addition starvation was induced as described in Materials and Methods, which substantially decreased the ATP levels both in the primary microglial cells and in the BV-2 (the cellular ATP content of the ACSF control cells compared with the MEM and DMEM controls, respectively). Fig. 6A demonstrates that all substrates added to ACSF were utilized effectively by primary microglial cells to maintain their cellular ATP content, which was higher than that in the absence of substrates. All substrates increased the ATP/ADP ratio in the primary cells compared with the ACSF controls. However, the effects of the substrates on the ATP levels were different in the BV-2 cells; in the presence of glutamine, the BV-2 cells maintained their intracellular ATP and ADP contents at the same levels as the DMEM control cells. In the presence of glucose, pyruvate, lactate and BOHB, the amount of cellular ATP decreased to the same level as the ACSF controls, whereas the ADP content was unaffected (Fig. 6B).
ACCEPTED MANUSCRIPT
25
ATP and ADP levels (pmol /1000 cells)
0 1 2 3 4
ACSF c ontrol
Gluc ose
Pyruva te
Lactate BOHB MEM c
ontrol Glutamine
ATP and ADP levels (pmol /1000 cells)
0 2 4 6 8 10 12
ACSF c ontrol
Gluc ose
Pyruva te
Lactate BOHB
DMEM c ontrol Glutamine
* *
N.
S.
N.
S.
N.
S.
N.
S.
N.
S.
N.
S.
N.
S.
N.
S.
N.
S.
ATP ADP
N.
S.
*
N.
S.
N.
S.
N.
N. S.
S.
N.
N. S.
S.
*
* *
* *
ADP ATP Fig. 6.
A)
B)
Fig. 6. Effect of energy substrates on the intracellular ATP and ADP levels in primary (A) - and BV-2 (B) microglial cells after starvation. Experimental conditions were as described in Materials and Methods. For starving control, microglial cells were incubated in nutrition-free ACSF. MEM and DMEM indicate conditions, where cells were incubated in culture media. Values represent the means ± SEM for at least 3 independent experiments each with 6-8 replicate wells. * P = <0,001 indicate statistically significant difference versus ACSF control evaluated by one-way ANOVA.
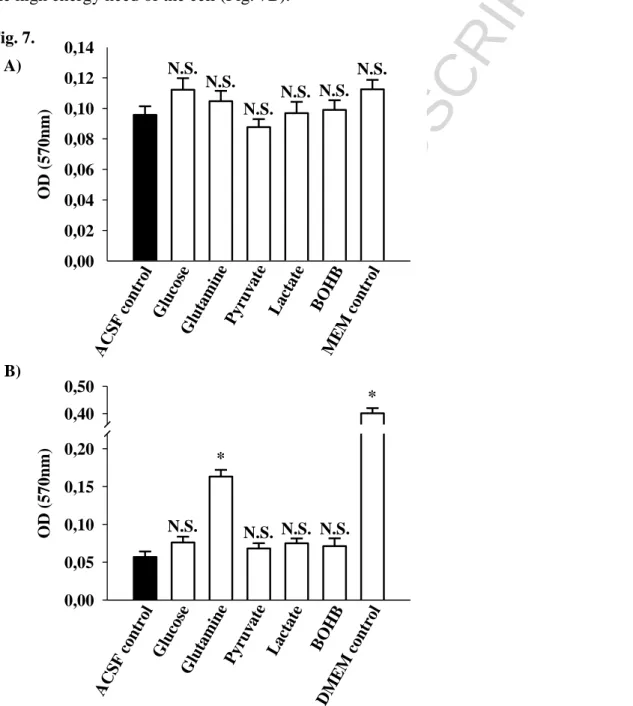
3.3 Effect of energy substrates on cell viability
In the ACSF control condition, starvation had a major impact on the cell viability. In the present study, an MTT test was used to assess cell survival. The amount of formazan crystals, as a result of
ACCEPTED MANUSCRIPT
26 MTT reduction by dehydrogenase enzymes in the cell, was proportional to the number of metabolically active microglial cells. Fig. 7A indicates that the viability of the primary microglial cells was not significantly decreased after starvation, and only slight differences were identified between the effects of substrates on the MTT viability. A substantially reduced MTT level was identified in the BV-2 cells after starvation. However, in the presence of glutamine, which was applied as a single substrate in the ACSF, a significantly increased MTT level was identified compared with the BV-2 cells starving in substrate-free ACSF medium (ACSF control); these findings suggest that glutamine replenishes the TCA-cycle to maintain the cell viability and fulfil the high energy need of the cell (Fig. 7B).
OD (570nm)
0,00 0,02 0,04 0,06 0,08 0,10 0,12 0,14
AC SF control
Gluc ose
Glutamine Pyruvat e
BOHB Lactat
e
ME M control N.S. N.S.
N.S.
N.S. N.S.
N.S.
OD (570nm)
0,00 0,05 0,10 0,15 0,20 0,40 0,50
N.S. N.S. N.S. N.S.
*
*
AC SF control
Gluc ose
GlutaminePyruvat e
BOHB Lactat
e
DMEM control Fig. 7.
A)
B)
Fig. 7. MTT reduction capacity of primary (A) - and BV-2 (B) microglial cells using various substrates in ACSF media. MTT viability was determined as described in Materials and Methods.
ACCEPTED MANUSCRIPT
27 Cells incubated in ACSF were used as starving controls. MEM and DMEM indicate conditions, where cells were incubated in culture media. Data are presented as means of 18-24 replicates from 3 individual experiments ± SEM * P = <0,001 versus ACSF control evaluated by one-way ANOVA.
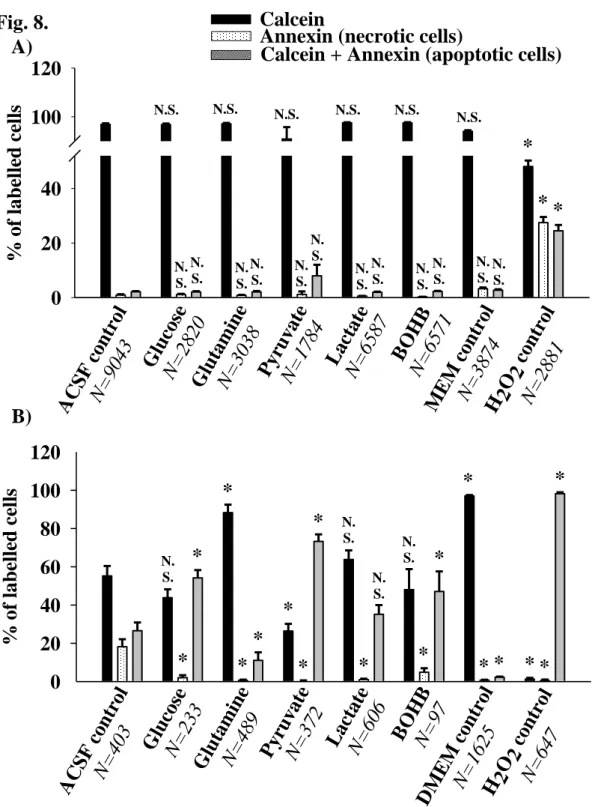
3.4 Effect of energy substrates on cell apoptosis and necrosis
Apoptotic primary and BV-2 microglial cells were detected by double labelling with Annexin V- 352 Cy3.18 and calcein-AM as described in the Materials and Methods. Cells stained only with Annexin V were considered necrotic cells, which exhibited the loss of plasma membrane integrity.
Starvation for four hours in ACSF did not induce apoptosis or necrosis in primary microglia; 95-99
% of these cells were only labelled with calcein, which reflects their viability, and a small portion (1-5 %) were considered apoptotic or necrotic cells. For the positive control, 400 μM H2O2 were administered to the cellular media. The portion of calcein-positive vital cells was decreased to 50%
and the percentages of apoptotic and necrotic cells were increased to 25 – 25 % following exposure to H2O2 (Fig. 8A).
Starvation had a major impact on apoptosis induction in BV-2 cells. The proportion of calcein- positive cells was decreased to less than 60% following starvation in the nutrient-free ACSF.
However, approximately 90% of the cells remained viable in the presence of glutamine (Fig. 8B).
Other respiratory substrates were unable to increase the viability of the BV-2 cells.
ACCEPTED MANUSCRIPT
28
% of labelled cells
0 20 40 100 120
Calcein
Annexin (necrotic cells)
Calcein + Annexin (apoptotic cells)
ACSF con trol
N=904
3 Glucose N=282
0
Gluta mine N=303
8
BOHBN=657 1 Lactate
N=658 7
H2O2 con trol
N=288 1 Pyruv
ate N=178
4
MEM c on
trol
N=387 4
*
* *
N.S. N.S. N.S. N.S. N.S.
N.S.
N.
S.
N.
S. N.
S.
N.
S.
N.
S.
N.
S.
N.
S.
N.
S. N.
S.
N.
S.
N.
S.
N.
S.
% of labelled cells
0 20 40 60 80 100 120
ACSF con trol
N=403
GlucoseN=233 Gluta
mine N=489
BOHBN=97 LactateN=606
H2O2 con trol
N=647 Pyruv
ate N=372
DMEM c ontrol N=162 5 Fig. 8.
A)
B)
*
N.
S.
* *
N.
S. N.
S.
* *
* * *
* *
*
N.
S.
*
*
*
*
*
*
Fig. 8. Induction of apoptotic and necrotic cell death in primary (A) - and BV-2 (B) microglial cells upon starvation. Apoptotic and necrotic cells were visualized by Annexin V - Cy3.18/ calcein-AM double staining as detailed in Materials and Methods. N reflects the number of detected cells. 100
% is the total number of analyzed cells in each condition. Cells incubated in ACSF were used as starving controls. MEM and DMEM indicate conditions, where cells were incubated in culture
ACCEPTED MANUSCRIPT
29 media. * P = <0,001 indicate statistically significant difference versus ACSF control evaluated by one-way ANOVA analysis.
3.5 Effect of energy substrates on the mTOR phosphorylation, AMPK phosphorylation and p-S6 level
The cytoplasmatic protein complex mammalian target of rapamycin C1 (mTORC1) is an essential member in the tight coupling of growth promoting signals and anabolic processes. Studies have demonstrated that lack of amino acids results in a block of the mTORC1 (Sancak et al. 2008, Bar- Peled et al. 2012). It has recently been elucidated that a lysosomal transporter SLC38A9 acts as a molecular sensor of amino acids, such as glutamine and arginine, and it activates/represses the mTOR kinase (Rebsamen et al. 2015, Wang et al. 2015). To investigate the effect of glutamine on mTOR phosphorylation, we performed immunoblot experiments to determine the p-mTOR/t- mTOR ratio. In parallel with that the energy sensing hunger signal protein kinase AMPK phosphorylated (p-AMPK, active) and total (t-AMPK) forms were also detected. Following phosphorylation, the mTORC1 regulates protein synthesis via S6 kinase. Therefore, the p-S6 levels of BV-2 cells were measured via FACS analysis with glucose or glutamine as a substrate. In the nutrient-free ACSF media, reduced levels of p-S6 and the p-mTOR/t-mTOR ratio were identified compared with the DMEM control cells, which indicates a starvation-evoked decrease in protein synthesis. However, the p-S6 expression level was only partially restored by glutamine in the BV-2 microglial cells (Fig. 9 and 10). The p-AMPK/t-AMPK ratio was elevated in starving and glucose- treated cells compared with the cells supplemented with glutamine or DMEM, however, the difference was not significant. (Fig. 10B.).
p-S6 intensity (%)
0 100 200 300 400
ACSF contro l
Gluc ose
Glut am
ine
DMEM contro
l
* *
N.S.
Fig. 9.