1 Hollow organosilica beads as reference particles for optical detection of 1
extracellular vesicles 2
3
Zoltán Varga *, †, Edwin van der Pol ‡, §, ¶, Marcell Pálmai *, Raul Garcia-Diez **,1, 4
Christian Gollwitzer **,2, Michael Krumrey **, Jean-Luc Fraikin ††,Aleksandra Gasecka 5
§§,‡,¶, Najat Hajji ‡, Ton G. van Leeuwen §,¶,Rienk Nieuwland ‡, ¶ 6
7
* Biological Nanochemistry Research Group, Institute of Materials and Environmental 8
Chemistry, Research Centre for Natural Sciences, Hungarian Academy of Sciences, Budapest, 9
Hungary 10
† Semmelweis University, Department of Biophysics and Radiation Biology, Budapest, 11
Hungary 12
‡ Laboratory of Experimental Clinical Chemistry, § Department of Biomedical Engineering 13
and Physics and ¶ Vesicle Observation Center, Academic Medical Centre of the University of 14
Amsterdam, Amsterdam, the Netherlands 15
** Physikalisch-Technische Bundesanstalt (PTB), Berlin, Germany 16
†† Spectradyne LLC, Torrance CA, USA 17
§§ 1st Chair and Department of Cardiology, Medical University of Warsaw, Warsaw, Poland 18
19
1 Present address: Helmholtz-Zentrum Berlin für Materialien und Energie GmbH (HZB), 20
Germany 21
2 Present address: Bundesanstalt für Materialforschung und -prüfung (BAM), Berlin, 22
Germany 23
Correspondence: Biological Nanochemistry Research Group, Institute of Materials and 24
Environmental Chemistry, Research Centre for Natural Sciences, Hungarian Academy of 25
Sciences, Magyar tudósok körútja 2, H-1117, Budapest, Hungary. Tel.: +36 1 382 6568 E- 26
mail: varga.zoltan@ttk.mta.hu (Z. Varga) 27
28
Word count abstract: 243/250 29
Word count text: 3928/4000 30
No. of figures: 5 31
No. of references: 46 32
33
Running head: Hollow silica particles for vesicle detection 34
35
2 Keywords cell-derived microparticles, exosomes, extracellular vesicles, microvesicles, flow 36
cytometry, microspheres 37
38
Essentials 39
• Standardization of extracellular vesicle (EV) measurements by flow cytometry needs 40
improvement 41
• Hollow organosilica beads were prepared, characterized, and tested as reference 42
particles 43
• Light scattering properties of hollow beads resemble that of platelet-derived EVs 44
• Hollow beads are ideal reference particles to standardize scatter flow cytometry research 45
on EVs 46
47
Summary 48
Background: The concentration of extracellular vesicles (EVs) in body fluids is a promising 49
biomarker for disease, and flow cytometry remains the clinically most applicable method to 50
identify the cellular origin of single EVs in suspension. To compare concentration 51
measurements of EVs between flow cytometers, solid polystyrene reference beads and EVs 52
were distributed in the first ISTH organized inter-laboratory comparison studies. The beads 53
were used to set size gates based on light scatter, and the concentration of EVs was measured 54
within the size gates. However, polystyrene beads lead to false size determination of EVs due 55
to the mismatch in refractive index between beads and EVs. Moreover, polystyrene beads gate 56
different EV sizes on different flow cytometers. Objective: To prepare, characterize and test 57
hollow organosilica beads (HOBs) as reference beads to set EV size gates in flow cytometry 58
investigations. Methods: HOBs were prepared by a hard template sol-gel method and 59
extensively characterized for morphology, size and colloidal stability. The applicability of 60
HOBs as reference particles was investigated by flow cytometry using HOBs and platelet- 61
derived EVs. Results: HOBs proved monodisperse with homogeneous shell thickness. Two 62
angle light scattering measurements by flow cytometry confirmed that HOBs have light 63
3 scattering properties similar to platelet-derived EVs. Conclusions: Because HOBs resemble 64
the structure and light scattering properties of EVs, HOBs with a given size will gate EVs of 65
the same size. Therefore, HOBs are ideal reference beads to standardize optical measurements 66
of the EV concentration within a predefined size range.
67 68
Introduction 69
Extracellular vesicles (EVs), including exosomes, microvesicles and other membrane 70
surrounded structures released from cells, are in the forefront of biomedical research. Because 71
EVs contribute to many physiological processes, EVs may serve as biomarkers for diseases, 72
including cancer, neurological diseases, and thrombosis [1–4]. Despite the potential of EVs 73
for diagnostic applications, gold standard techniques and reference materials for EV detection 74
are lacking [5]. Detection of EVs is difficult because EVs are heterogeneous in size and 75
composition, and most EVs are smaller than 500 nm [6–8]. Throughout this manuscript, size 76
is defined as the diameter of the particle. Furthermore, the most widely studied body fluid 77
with regard to EVs is blood, which contains not only EVs but similar-sized lipoprotein 78
particles [9].
79
Because clinically relevant EVs are outnumbered by other EVs and lipoprotein 80
particles, EVs are preferably characterized one by one. A recent international survey showed 81
that optical methods are widely used to characterize single EVs [10]. Of all respondents who 82
specified their single EV detection method, 80% used nanoparticle tracking analysis (NTA), 83
18% used tunable resistive pulse sensing (TRPS), and 29% used flow cytometry (bead capture 84
assays excluded). Because only flow cytometry can identify single EVs at high throughput 85
(>5,000 events/s) in a reproducible manner, flow cytometers hold most promise for clinical 86
applications.
87
4 A flow cytometer detects light scattering and fluorescence of single particles in a 88
hydrodynamically focused fluid stream. Because flow cytometers are designed to detect cells, 89
which are much larger than EVs, commercially available flow cytometers do not detect all 90
EVs. The detected concentration of EVs therefore strongly depends on the sensitivity of the 91
flow cytometer, especially because the concentration of EVs increases with decreasing size 92
[5]. To standardize flow cytometry measurements and enable data comparison, laboratories 93
should detect the concentration of EVs within a well-defined size range. However, the 94
arbitrary units of flow cytometry data preclude access to the EV size, thereby impeding 95
standardization and comparison of measurement results.
96
The light scattering signals of two sizes of polystyrene beads are commonly used to 97
gate EVs [11,12]. However, light scattering depends on the size, refractive index (RI), shape 98
and structure of the particle, the RI of the medium, and the optical configuration of the flow 99
cytometer. At a wavelength of 405 nm, which is used in modern flow cytometers to illuminate 100
particles, polystyrene has an RI of 1.63 whereas EVs have an effective RI below 1.40 [13,14].
101
Due to this RI mismatch, 200 nm EVs scatters 40 to 300-fold less light than 200 nm 102
polystyrene beads, as illustrated in Figure 1. Also 200 nm silica beads, which have an RI 103
between 1.44 and 1.47, scatter 5 to 50-fold more light than similar-sized EVs [14–16]. Thus, 104
the use of solid synthetic reference beads to standardize optical measurements of EVs leads to 105
false size assignment.
106
Correct sizing of EVs by scattering flow cytometry requires reference particles with 107
light scattering properties similar to EVs. EVs are concentric particles containing a ~4 nm 108
phospholipid bilayer [6,17] with an RI of 1.46 ± 0.06 to 1.48 [18,19], surrounding an aqueous 109
core with RI close to that of water (RI = 1.34 at a wavelength of 405 nm). The ideal reference 110
particles are therefore stable, monodisperse, concentric particles with a high-RI shell and a 111
low-RI core.
112
5 In this manuscript, we prepared, characterized and applied hollow organosilica beads 113
(HOBs) with nominal sizes of 200 nm (HOB200) and 400 nm (HOB400) as reference 114
materials for optical detection of EVs. Due to their concentric structure and organosilica shell, 115
HOBs have an RI distribution resembling EVs. Based on Mie theory, HOBs are expected to 116
have similar light scattering properties as EVs, as illustrated in Figure 1. The goals of this 117
manuscript are to (1) determine the size distribution, concentration, structure, colloidal 118
stability, and light scattering properties of the prepared HOBs, (2) confirm that HOBs have 119
light scattering properties similar to EVs from blood plasma, and (3) use the HOBs to set a 120
size gate that is independent of the collection angles of a flow cytometer.
121 122
Methods 123
Preparation of hollow organosilica beads (HOBs) 124
1,2-bis(triethoxysilyl)ethane (BTEE, 96%, Sigma-Aldrich, St. Louis, MO), cyclohexane 125
(G.R., 99.99 %, Lach-Ner, Neratovice, Czech Republic), L-arginine (reagent grade, ≥98 %, 126
TLC, Sigma-Aldrich) were used. Silica dispersions of 200 nm [PSI-0.2] and 400 nm [PSI- 127
0.4]) in water were obtained from Kisker Biotech (Steinfurt, Germany). High purity deionized 128
water (18.2 MΩ·cm) was used during synthesis.
129
HOBs were synthesized by combining a basic amino acid catalysis route with a hard template 130
approach in a 4 mL glass vial [20,21]. Briefly, 2.6 mg of L-arginine and 300 µL of silica 131
dispersion (50 mg mL-1) serving as the template particles were added to 1.7 mL of water.
132
Next, 130 µL of cyclohexane was overlayered on the aqueous phase and 134 µL of BTEE, the 133
precursor of the organosilica shell, was injected into the non-polar phase. The reaction 134
mixture was allowed to react under vigorous stirring (500 rpm) at 60 °C for 24 hours.
135
Afterwards, cyclohexane was removed, the pH was adjusted to 12.75 ± 0.05 by adding 150 136
6 µL 1M NaOH solution and the dispersion was stirred for 24 hours at room temperature in 137
order to etch the template silica core. The mesoporous shell structure and hydrolytic stability 138
of organosilica under basic conditions enables etching of the silica core while maintaining the 139
shell integrity. Finally, the sample was transferred into a 2 mL Slide-A-LyzerTM MINI 140
Dialysis Device (20K MWCO, Thermo Fisher Scientific, Waltham, MA) and dialysed against 141
42.5 mL of water for 4 times in 2 days to remove NaOH and side products.
142
143
Preparation and storage of cell-depleted plasma 144
Citrate-anticoagulated blood (0.32%) was collected from 10 healthy individuals [5 males and 145
5 females; age 45 ± 12 (mean ± standard deviation)] with informed consent by venipuncture 146
without a tourniquet through a 21-gauge needle using a vacutainer system. To remove cells, 147
blood was centrifuged twice (1,550 g, 20 minutes, 20˚C) using a Rotina 380 R centrifuge 148
equipped with a swing-out rotor and a radius of 155 mm (Hettich Zentrifugen, Tuttlingen, 149
Germany). The centrifugation parameters were 1,550 g for 20 minutes at 20˚C, acceleration 150
speed 1, no brake. After a single centrifugation, plasma was transferred to a new 5 ml plastic 151
tube, leaving ~1 cm plasma above the buffy layer. After the second centrifugation, plasma 152
was collected and transferred carefully to a new 5 ml plastic tube, leaving ~100 µL at the 153
bottom of the old tube. The number of remaining platelets after the second centrifugation is 154
on average 0.5% of the initial platelet count in whole blood (n=4; data not shown), which is 155
similar to the recommended ISTH protocol (2x 2,500 g for 15 minutes at 20˚C) [11].
156
Although our protocol and the ISTH protocol give similar results with regard to remaining 157
platelets, we recommend to use the ISTH protocol to circumvent confusion and to enable the 158
comparison of results between studies and laboratories [22]. Aliquots of 100 µL cell-depleted 159
plasma were snap-frozen in liquid nitrogen for 15 minutes and stored at -80 °C until use.
160
7 After thawing on ice, 20 µL of plasma was incubated in the dark for 120 minutes at 20 °C 161
with 2.5 µL phycoerythrin (PE)-conjugated CD61 or IgG1-PE control (555754 and 340013, 162
respectively; both 6.25 µg/ mL, Becton Dickinson, CA). Labeling was stopped by addition of 163
200 µL, 50 nm filtered (Whatman, Maidstone, UK), citrate-containing (0.32%) phosphate 164
buffered saline (PBS; pH 7.4). To verify the presence of EVs, cell-depleted plasma was 165
characterized by NTA and TEM (Details in Supplementary Information).
166
167
Transmission electron microscopy (TEM) 168
Morphological investigations of HOBs were carried out on a MORGAGNI 268D (FEI, 169
Eindhoven, Netherlands) transmission electron microscope. Diluted sample was dropped and 170
dried on a carbon coated copper grid. The supplementary information contains the TEM 171
protocol for EVs from cell-depleted plasma.
172
173
Dynamic light scattering (DLS) 174
HOBs were characterized by DLS (W130i Dynamic Light Scattering System, AvidNano, 175
High Wycombe, UK). Samples were diluted 50-fold with ultrapure water (Merck Millipore, 176
Billerica, MA). Low volume disposable plastic cuvette was used for the DLS measurements 177
(UVette, Eppendorf Austria GmbH, Austria), and data evaluation was performed using the 178
iSize 3.0 software (AvidNano) utilizing the CONTIN algorithm.
179
180
8 Small-angle X-ray scattering (SAXS)
181
HOBs were characterized by SAXS at the four-crystal monochromator beamline of PTB 182
[23,24] at the synchrotron radiation facility BESSY II (Helmholtz-Zentrum Berlin, Germany).
183
The mean size, size distribution, and shell thickness of HOBs were determined by using a 184
least-squares fitting of a model function to the experimentally measured scattering curves 185
(details in Supplementary Information) [25,26].
186
187
Zeta potential 188
Zeta potential measurements of HOBs were performed by using a Malvern Zetasizer Nano ZS 189
(Malvern, Worcestershire, UK) equipped with He-Ne laser (λ = 633 nm) and backscatter 190
detector at fixed angle of 173°.
191
192
Nanoparticle tracking analysis (NTA) 193
A dark-field microscope (NS500; Nanosight, Amesbury, UK) with a 45-mW 405-nm laser 194
and an electron multiplying charge-coupled device was used to determine the size and 195
concentration of HOBs by NTA. Samples were diluted 10,000-fold (HOB200) or 100-fold 196
(HOB400) in 50 nm filtered (Whatman) de-ionized water. Per sample, 30 videos of 10 s were 197
captured at 22.0 °C using camera level 15 (HOB200) or 12 (HOB400) [22]. Data were 198
analysed by NTA 3.1 Build 3.1.54 (Nanosight), assuming a medium viscosity of 0.95 cP and 199
using a threshold of 10 gray values. The supplementary information contains the NTA 200
protocol for EVs from cell-depleted plasma.
201
202
9 Tunable resistive pulse sensing (TRPS)
203
TRPS (qNano, Izon Science, Oxford, UK) was used to determine the size and concentration 204
of HOBs. Samples were diluted 500-fold (HOB200) or 50-fold (HOB400) in 50 nm filtered 205
(Whatman) PBS. HOBs were measured with NP200 (HOB200) and NP400 (HOB400) 206
nanopores. The voltage was adjusted between 0.40 and 0.70 V to obtain a baseline current of 207
125 nA using a nanopore stretch of 47.00 mm [27]. Next, the stretch was adjusted such that 208
the amplitude of the resistive pulses of reference beads (Izon Science) is within the range 209
recommended by the manufacturer. This resulted in a stretch between 45.50 and 47.00 mm.
210
Finally, the voltage was adjusted between 0.40 and 0.70 V to get the baseline current as close 211
as possible to 125 nA. Samples were measured with an external pressure of 7.0 mbar and at 212
least 1,000 beads per sample were analyzed. Particle size and concentration were calibrated 213
with reference beads (Izon Science). Data acquisition and processing were done with Izon 214
control suite version 3.2.2.268.
215
216
Microfluidic resistive pulse sensing (MRPS) 217
MRPS (nCS1, Spectradyne LLC, Torrance, CA) was used to determine the size and 218
concentration of HOBs [28]. Samples were diluted 1,000-fold (HOB200) or 100-fold 219
(HOB400) in 50 nm filtered (Whatman) PBS containing 0.6 mM sodium dodecyl sulfate. All 220
samples were measured with a TS-900 cartridge at a voltage of 4 V. To relate the frequency 221
of resistive pulses to the particle concentration, 695 nm reference beads (Spectradyne) with a 222
concentration of 2∙108 mL-1 were used.
223
224
10 Flow cytometry
225
A flow cytometer (A60-Micro; Apogee, Hemel Hempstead, UK) equipped with a 200 mW 226
405 nm laser was used to detect forward scattered light (FSC), side scattered light (SSC) and 227
fluorescence of beads and EVs. SSC was used as the trigger channel with the threshold at 14 228
arbitrary units. For the FSC, SSC and PE fluorescence channel, the gain was 1 and the 229
voltages were 380 V, 375 V, and 520 V, respectively. Samples were measured for 1 minute at 230
a flow rate of 3.01 µL/minute and with a sheath pressure of 150 mbar. Rosetta Calibration 231
(Exometry, Amsterdam, The Netherlands) was used to relate side scatter to the size and RI of 232
nanoparticles by Mie theory [29]. To validate this relation, side scatter of silica beads (Kisker 233
Biotech, Steinfurt, Germany) was measured at a concentration of 107 mL-1. Median 234
fluorescent intensity was related to molecules of equivalent soluble fluorochrome (MESF) for 235
phycoerythin (PE) using the SPHERO PE Calibration kit (ECFP-F2-5K, Spherotech). Figure 236
S3 shows the relation between the measured PE intensity in arbitrary units and MESF, which 237
was obtained by least square fitting the logarithm of the data. The gate of the PE channel was 238
set at 51 MESF. HOB200 and HOB400 were diluted 105-fold and 103-fold in purified water 239
to a detected concentration of 6.7∙106 mL-1 and 1.4∙107 mL-1, respectively. Cell-depleted 240
plasma was diluted 66-fold in PBS to avoid swarm detection, as confirmed by serial dilutions 241
[30]. For the cell-depleted plasma, data of 5 measurements were combined to create the 242
scatter plot shown in Fig. 5. Data acquisition was done with Apogee software and processed 243
using FlowJo v.10.3 (FlowJo LLC, Ashland, OR).
244
245
11 Results
246
Size distribution of HOBs 247
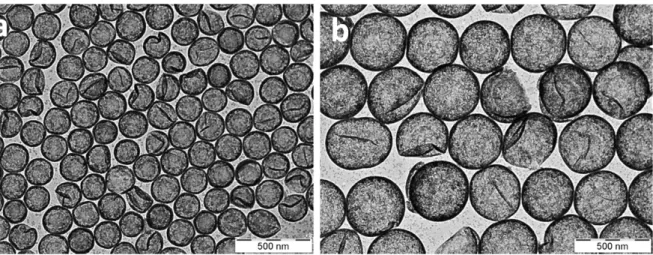
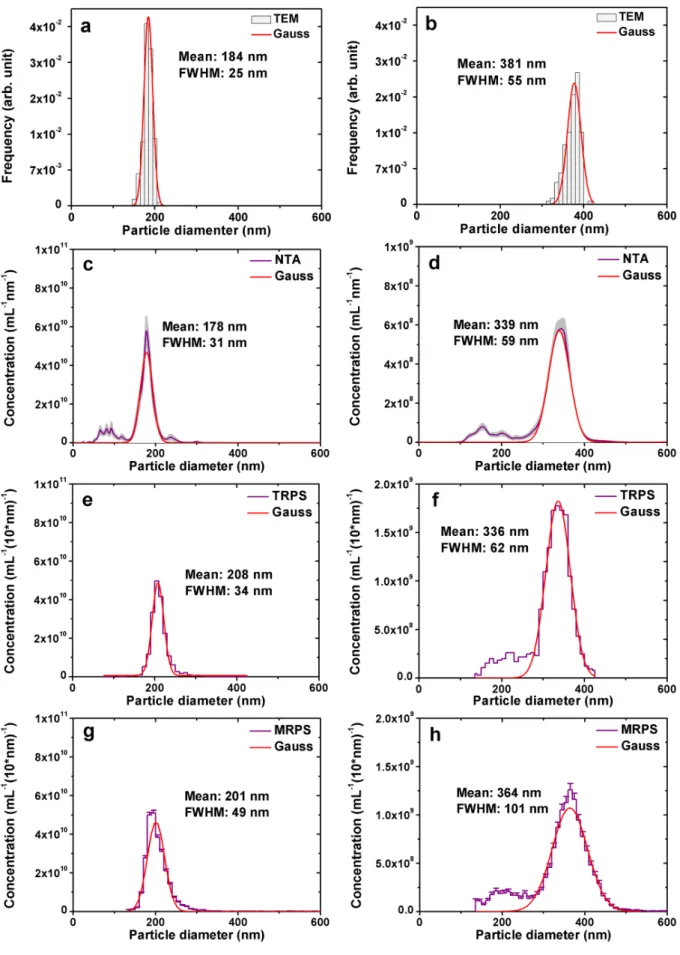
The prepared HOBs were characterized by TEM, NTA, TRPS, MRPS, DLS and SAXS. TEM 248
images show that HOBs have homogeneous morphology and uniform layer thicknesses 249
(Figure 2). Figure 3 shows the size distributions of HOBs obtained by the single particle 250
detection methods TEM, NTA, TRPS, and MRPS. Among ensemble techniques, DLS 251
resulted mean sizes of 188 nm and 356 nm, and full-width-at-half-maximum (FWHM) values 252
of 52 nm and 118 nm for HOB200 and HOB400, respectively. SAXS, which is the only 253
traceable method used in this study, resulted in mean sizes (value ± uncertainty) of 189±2 nm 254
and 374±10 nm for HOB200 and HOB400, respectively. SAXS obtained a polydispersity 255
(FWHM/mean) below 15%. Table S1 shows a summary of all size measurements.
256 257
Concentration, structure and stability of HOBs 258
NTA, TRPS, MRPS and flow cytometry measured concentrations of 2.2·1012, 259
2.0·1011, 2.7·1011, and 6.7·1011 particles/ml for HOB200 and 4.4·1010, 1.6·1010, 1.4·1010 and 260
1.4·1010 particles/ml for HOB400, respectively.
261
Besides size, SAXS also provides information on the structure and electron density 262
distribution of HOBs. By fitting a core-shell model to the measured scattering curves we 263
obtained a shell thickness of (8.1 ± 0.5) nm for HOB200 and (6.4 ± 0.7) nm for HOB400.
264
Furthermore, we obtained an average electron density of the core of 345 nm-3 for both 265
samples, which is close to the electron density of water (333 nm-3). This observation confirms 266
the successful etching of the template silica core.
267
The colloidal stability of the HOBs, which describes the aggregation properties of the 268
beads, was evaluated by Zeta potential measurements. We found highly negative zeta 269
12 potentials (-56.6 mV for HOB200 and -58.1 mV for HOB400), which we associate to the 270
dissociation of surface silanol groups [31]. The highly negative zeta potentials suggest that 271
HOBs exhibit excellent colloidal stability in water at pH 7.4.
272
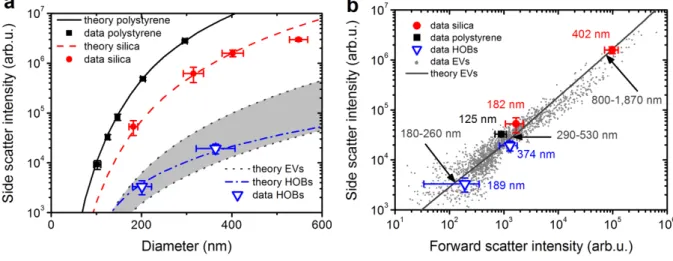
Light scattering properties of HOBs measured by flow cytometry 273
To test the applicability of HOBs as reference particles for characterization of EVs by 274
flow cytometry, we compared light scattering properties of HOBs and EVs. Figure 4 (a) 275
shows the side scattering intensity of polystyrene beads, silica beads, and HOBs measured by 276
flow cytometry and calculated by Mie theory. Whereas the polystyrene (coefficient of 277
determination, R2=1.00) and silica beads (R2=0.97) are well-described by a solid sphere Mie 278
model, the HOBs (R2=0.95) are well-described by a hollow sphere Mie model. By least 279
square fitting the theory to the data, we obtained a shell thickness of 10.1 nm for the HOBs, 280
which is close to the shell thickness determined by SAXS. Due to the hollow structure, HOBs 281
scatter at least an order of magnitude less light than similar-sized solid silica beads. The 282
scattering intensity of HOBs thereby overlaps with the scattering intensity expected from 283
EVs. We modelled EVs as concentric particles with a 4 nm shell (RI = 1.48) [32–36] and a 284
core (1.35 ≤ RI ≤ 1.37) [37–40]. The RI range of the core corresponds to a realistic protein 285
concentration between 10% and 20% [41]. Our model parameters result in scattering 286
intensities similar to platelet-derived EVs with a median RI of 1.37 and a mode RI of 1.39 at 287
405 nm, which was previously measured under the assumption that EVs have a homogeneous 288
RI distribution [13,42]. More accurate estimates of the RI distribution of EVs require 289
monodisperse EV populations, which are hitherto unavailable.
290
To demonstrate that HOBs have light scattering properties similar to EVs, Fig. 4 (b) 291
shows the measured side scatter (SSC) intensity versus forward scatter (FSC) intensity for 292
HOBs, platelet-derived (CD61+) EVs from cell-depleted plasma, and, for comparison, 125 293
nm polystyrene beads and 182 nm and 402 nm silica beads. As a reference, the arrows relate 294
13 the size range of EVs expected from Mie theory to their FSC and SSC values. The data show 295
that for a given FSC of this flow cytometer, HOBs have low SSC whereas polystyrene and 296
silica beads have high SSC compared to EVs. However, HOBs are within the theoretical EV 297
size range and are therefore expected to be better reference materials to standardize flow 298
cytometry measurements on EVs.
299 300
HOBs outperform solid beads to standardize EV flow cytometry 301
To demonstrate that HOBs can be used to determine the EV concentration independent of the 302
light scattering collection angles of a flow cytometer, we determined the concentration of 303
platelet-derived EVs using the FSC or SSC detector within size gates set by HOBs. Because 304
the sensitivity and the scatter to size relationship differ between the FSC and SSC detectors of 305
our flow cytometer [5], while the flow rate and sample composition are the same for both 306
detectors, this experiment may demonstrate that HOBs set an EV size gate independent of the 307
collection angles. Fig. 5 shows the concentration of platelet-derived EVs within gates set by 308
polystyrene beads, silica beads, and HOBs for the FSC and SSC detector. Figure S4 shows the 309
applied gates at FSC versus SSC scatter plots. The percentage difference in the gated 310
concentration relative to the mean concentration is smallest for the gates set by HOBs 311
compared to solid beads, suggesting that HOBs outperform solid beads to standardize EV 312
flow cytometry.
313 314
Discussion 315
Standardization of flow cytometry measurements is essential to explore the diagnostic 316
potential of EVs. Since the scattering intensities measured by flow cytometry are in arbitrary 317
units, there is a need for reference beads with known size and light scattering properties 318
14 similar to those of EVs. The optical properties of a particle depend not only on the size, but 319
also on the RI distribution within the particle. EVs typically have a 4 nm thick shell of high RI 320
and a core of low RI. In contrast, polystyrene and silica beads consist of a homogeneously 321
distributed high RI material and therefore scatter orders of magnitude more light than similar- 322
sized EVs (Fig. 4a). In this manuscript, we introduce HOBs with similar light scattering 323
properties as EVs to standardize optical measurements on EVs.
324
HOBs with smooth surfaces were produced by optimizing the existing hard template 325
approach proposed by Koike et al. [20]. All established particle measurement methods (TEM, 326
NTA, TRPS, SAXS) confirmed a narrow size distribution (FWHM/MEAN < 0.25) of HOBs.
327
The relative standard deviation of the mean size values obtained by the different methods is 328
below 10%, which indicate good agreement between used methods. All methods indicate the 329
presence of contaminants, which are smaller than and have a lower concentration than HOBs.
330
These contaminants might originate from incomplete particles or from the polycondensation 331
of the organosilica precursor. Introducing a further purification step during the synthesis may 332
eliminate these contaminants.
333
The hollow core-shell structure of the prepared HOBs was confirmed by TEM and 334
SAXS, and indirectly by flow cytometry. NTA, TRPS, MRPS and flow cytometry were 335
further used to determine the concentrations of the prepared HOBs. The obtained values show 336
an order of magnitude deviation for the HOB200 and a factor of 3.4 deviation for HOB400.
337
However, concentration measurements require careful interpretation, especially because no 338
standards or primary methods exist and no certified reference materials are available for the 339
concentration determination of nanoparticles [43].
340
Flow cytometry measurements show that HOBs scatter approximately an order of 341
magnitude less light than similar sized solid silica beads (Fig. 4a). The measured light scatter 342
of HOBs thereby overlaps with the expected light scatter for EVs, which is also expected 343
15 based on the spatial RI distribution within both particle types. To demonstrate that HOBs and 344
EVs indeed have similar light scattering properties, we measured the FSC and SSC of HOBs 345
and platelet-derived EVs from blood plasma (Fig. 4b). We found that HOBs have a low SSC 346
(or high FSC) whereas polystyrene and silica beads have high SSC (or low FSC) compared to 347
EVs. However, the shell thickness of HOBs can in principle be tuned to exactly match the 348
FSC and SSC properties of EVs. Moreover, HOBs are closer to the theoretical EV size, which 349
emphasizes the wrong size assignment of EVs when solid reference beads are used to set 350
gates. For example, 182 nm solid silica beads produce comparable SSC and FSC signals to 351
374 nm HOBs, meaning that a 2-fold difference in size assignment between solid and hollow 352
silica beads exists.
353
As proof of the pudding, we applied HOBs to set size gates on FSC and SSC, which 354
collect light over different collection angles, resulting in totally different scatter to size 355
relations [5]. Fig. 5 shows that the variation in the gated EV concentration of these detectors 356
was minimal for gates set by HOBs, confirming that HOBs have similar optical properties to 357
EVs and in fact define an EV gate in nanometers. A multicenter and multi flow cytometer 358
follow-up study is required to demonstrate the superiority of HOBs over solid beads.
359
The illumination wavelength of our flow cytometer is 405 nm. We expect that EV size 360
gates set by HOBs are also applicable to flow cytometers with other common illumination 361
wavelengths, such as 375 nm and 488 nm. The refractive indices of glass and water at 375 nm 362
are almost 0.01 higher than the refractive indices of glass and water at 488 nm. However, 363
scattering depends on the RI contrast, in this case between water and the shell of the HOBs or 364
EVs. Because within this wavelength range the dispersion relations of glass and water have 365
similar slopes, the RI contrast between water and glass remains similar at 375 nm and 488 nm 366
[44,45]. The dispersion relation of the shell of EVs is unknown, but based on the dispersion 367
16 relations of organic materials, negligible changes in the RI contrast between water and the 368
shell of EVs is expected between 375 nm and 488 nm.
369
An alternative to setting EV size gates with HOBs, is to relate the scattering intensity 370
of solid polystyrene and silica reference beads to that of EVs by Mie theory [29]. Mie theory 371
accounts for RI differences, but requires complex software and knowledge of the optical 372
configuration of the flow cytometer. HOBs are more practical in use because HOBs can 373
directly be used to set an EV size gate in nanometers, due to the almost similar light scattering 374
properties of EVs and HOBs. Perhaps the best solution would be the use of Mie theory in 375
combination with HOBs to allow the user flexibility in selection of an EV size gate by flow 376
cytometry.
377 378
Conclusions 379
In summary, we introduced HOBs to be used as reference beads for optical 380
characterization of EVs. Thorough characterization of the prepared HOBs revealed narrow 381
size distributions, colloidal stability, and homogeneous hollow core-shell structure of HOBs.
382
Compared to potential biological reference particles [46], which like HOBs resemble the light 383
scattering properties of EVs, safety, monodispersity and stability of HOBs are superior. The 384
performed flow cytometry investigations confirm that HOBs have similar light scattering 385
properties as EVs and therefore are more suitable as reference beads for flow cytometry 386
characterization of EVs than solid polystyrene or silica beads. HOBs can be used to set size 387
gates in nanometers independent from the optical configuration of a flow cytometer.
388
Therefore, HOBs are ideal reference beads to standardize optical measurements of the EV 389
concentration within a predefined size range, which may facilitate the comparison of EV 390
measurements between instruments and institutes.
391 392
17 Addendum
393
Z. Varga and E. van der Pol designed and performed the research and wrote the paper; M.
394
Pálmai contributed to the synthesis and characterization; R. Garcia-Diez, C. Gollwitzer, and 395
M. Krumrey performed the SAXS analysis and contributed to writing the paper; J-L. Fraikin 396
performed MRPS analysis, A. Gasecka and N. Hajji contributed to characterization; T. G. van 397
Leeuwen contributed to writing the paper; R. Nieuwland designed the research and 398
contributed to writing the paper.
399
400
Acknowledgements 401
We thank Chi Hau and Linda Rikkert (Laboratory of Experimental Clinical 402
Chemistry, Academic Medical Center , University of Amsterdam, Amsterdam, The 403
Netherlands) for the TEM investigation of the cell-depleted plasma sample. This work was 404
supported by the National Research, Development and Innovation Office (Hungary) under 405
grant numbers PD 121326 and NVKP_16-1-2016-0007. ZV was supported by the János 406
Bolyai Research Fellowship of the Hungarian Academy of Sciences. Part of this work was 407
supported by the Cancer-ID program (www.utwente.nl/tnw/cancer-id), the MEMPHISII 408
program of the Netherlands Technology Foundation STW, and the VENI program (15924, 409
Edwin van der Pol) of the Netherlands Organisation for Scientific Research - Domain Applied 410
and Engineering Sciences (NWO-TTW).
411 412
Disclosure of Conflict of Interest 413
E. van der Pol is co-founder and shareholder of Exometry B.V. The authors declare no further 414
competing financial interests.
415 416
18 Supporting Information
417
Additional Supporting Information may be found in the online version of this article:
418
Fig. S1. NTA and TEM characterization of cell-depleted plasma 419
Table S1. Summary of size distribution parameters of HOBs 420
Data S1. Details of the SAXS analysis of HOBs.
421
Fig. S2. SAXS curves of HOBs.
422
Fig. S3. MESF calibration of Phycoerythrin (PE) channel.
423
Fig. S4. Flow cytometry data of extracellular vesicles from plasma 424
425
References 426
1 van Eijndhoven MAJ, Zijlstra JM, Groenewegen NJ, Drees EEE, van Niele S, Baglio 427
SR, Koppers-Lalic D, van der Voorn H, Libregts SFWM, Wauben MHM, de Menezes RX, 428
van Weering JRT, Nieuwland R, Visser L, van den Berg A, de Jong D, Pegtel DM. Plasma 429
vesicle miRNAs for therapy response monitoring in Hodgkin lymphoma patients. JCI Insight 430
2016; 1: e89631.
431
2 Hoshino A, Costa-Silva B, Shen T-L, Rodrigues G, Hashimoto A, Tesic Mark M, 432
Molina H, Kohsaka S, Di Giannatale A, Ceder S, Singh S, Williams C, Soplop N, Uryu K, 433
Pharmer L, King T, Bojmar L, Davies AE, Ararso Y, Zhang T, et al. Tumour exosome 434
integrins determine organotropic metastasis. Nature 2015; 527: 329–35.
435
3 Melo SA, Luecke LB, Kahlert C, Fernandez AF, Gammon ST, Kaye J, LeBleu VS, 436
Mittendorf EA, Weitz J, Rahbari N, Reissfelder C, Pilarsky C, Fraga MF, Piwnica-Worms D, 437
Kalluri R. Glypican-1 identifies cancer exosomes and detects early pancreatic cancer. Nature 438
2015; 523: 177–82.
439
4 van der Pol E, Böing AN, Gool EL, Nieuwland R. Recent developments in the 440
nomenclature, presence, isolation, detection and clinical impact of extracellular vesicles. J 441
Thromb Haemost JTH 2016; 14: 48–56.
442
5 van der Pol E, Coumans F a. W, Grootemaat AE, Gardiner C, Sargent IL, Harrison P, 443
Sturk A, van Leeuwen TG, Nieuwland R. Particle size distribution of exosomes and 444
microvesicles determined by transmission electron microscopy, flow cytometry, nanoparticle 445
tracking analysis, and resistive pulse sensing. J Thromb Haemost JTH 2014; 12: 1182–92.
446
6 Arraud N, Linares R, Tan S, Gounou C, Pasquet J-M, Mornet S, Brisson AR.
447
Extracellular vesicles from blood plasma: determination of their morphology, size, phenotype 448
and concentration. J Thromb Haemost JTH 2014; 12: 614–27.
449
19 7 Brisson AR, Tan S, Linares R, Gounou C, Arraud N. Extracellular vesicles from 450
activated platelets: a semiquantitative cryo-electron microscopy and immuno-gold labeling 451
study. Platelets 2017; 28: 263–71.
452
8 Varga Z, Yuana Y, Grootemaat AE, van der Pol E, Gollwitzer C, Krumrey M, 453
Nieuwland R. Towards traceable size determination of extracellular vesicles. J Extracell 454
Vesicles 2014; 3.
455
9 Sódar BW, Kittel Á, Pálóczi K, Vukman KV, Osteikoetxea X, Szabó-Taylor K, 456
Németh A, Sperlágh B, Baranyai T, Giricz Z, Wiener Z, Turiák L, Drahos L, Pállinger É, 457
Vékey K, Ferdinandy P, Falus A, Buzás EI. Low-density lipoprotein mimics blood plasma- 458
derived exosomes and microvesicles during isolation and detection. Sci Rep 2016; 6: 24316.
459
10 Gardiner C, Di Vizio D, Sahoo S, Théry C, Witwer KW, Wauben M, Hill AF.
460
Techniques used for the isolation and characterization of extracellular vesicles: results of a 461
worldwide survey. J Extracell Vesicles 2016; 5: 32945.
462
11 Lacroix R, Robert S, Poncelet P, Kasthuri RS, Key NS, Dignat-George F, ISTH SSC 463
Workshop. Standardization of platelet-derived microparticle enumeration by flow cytometry 464
with calibrated beads: results of the International Society on Thrombosis and Haemostasis 465
SSC Collaborative workshop. J Thromb Haemost JTH 2010; 8: 2571–4.
466
12 Cointe S, Judicone C, Robert S, Mooberry MJ, Poncelet P, Wauben M, Nieuwland R, 467
Key NS, Dignat-George F, Lacroix R. Standardization of microparticle enumeration across 468
different flow cytometry platforms: results of a multicenter collaborative workshop. J Thromb 469
Haemost JTH 2017; 15: 187–93.
470
13 Gardiner C, Shaw M, Hole P, Smith J, Tannetta D, Redman CW, Sargent IL.
471
Measurement of refractive index by nanoparticle tracking analysis reveals heterogeneity in 472
extracellular vesicles. J Extracell Vesicles 2014; 3: 25361.
473
14 van der Pol E, Coumans FA, Sturk A, Nieuwland R, van Leeuwen TG. Refractive 474
index determination of nanoparticles in suspension using nanoparticle tracking analysis. Nano 475
Lett 2014; 14: 6195–201.
476
15 Parida BK, Garrastazu H, Aden JK, Cap AP, McFaul SJ. Silica microspheres are 477
superior to polystyrene for microvesicle analysis by flow cytometry. Thromb Res 2015; 135:
478
1000–6.
479
16 Chandler WL, Yeung W, Tait JF. A new microparticle size calibration standard for 480
use in measuring smaller microparticles using a new flow cytometer. J Thromb Haemost JTH 481
2011; 9: 1216–24.
482
17 Issman L, Brenner B, Talmon Y, Aharon A. Cryogenic transmission electron 483
microscopy nanostructural study of shed microparticles. PLoS One 2013; 8: e83680.
484
18 van Manen H-J, Verkuijlen P, Wittendorp P, Subramaniam V, van den Berg TK, Roos 485
D, Otto C. Refractive index sensing of green fluorescent proteins in living cells using 486
20 fluorescence lifetime imaging microscopy. Biophys J 2008; 94: L67-69.
487
19 Beuthan J, Minet O, Helfmann J, Herrig M, Müller G. The spatial variation of the 488
refractive index in biological cells. Phys Med Biol 1996; 41: 369–82.
489
20 Koike N, Ikuno T, Okubo T, Shimojima A. Synthesis of monodisperse organosilica 490
nanoparticles with hollow interiors and porous shells using silica nanospheres as templates.
491
Chem Commun 2013; 49: 4998–5000.
492
21 Hartlen KD, Athanasopoulos APT, Kitaev V. Facile Preparation of Highly 493
Monodisperse Small Silica Spheres (15 to >200 nm) Suitable for Colloidal Templating and 494
Formation of Ordered Arrays. Langmuir 2008; 24: 1714–20.
495
22 Coumans FAW, Brisson AR, Buzas EI, Dignat-George F, Drees EEE, El-Andaloussi 496
S, Emanueli C, Gasecka A, Hendrix A, Hill AF, Lacroix R, Lee Y, van Leeuwen TG, 497
Mackman N, Mäger I, Nolan JP, van der Pol E, Pegtel DM, Sahoo S, Siljander PRM, et al.
498
Methodological Guidelines to Study Extracellular Vesicles. Circ Res 2017; 120: 1632–48.
499
23 Krumrey M, Ulm G. High-accuracy detector calibration at the PTB four-crystal 500
monochromator beamline. Nucl Instrum Methods Phys Res Sect Accel Spectrometers Detect 501
Assoc Equip 2001; 467: 1175–8.
502
24 Gleber G, Cibik L, Haas S, Hoell A, Müller P, Krumrey M. Traceable size 503
determination of PMMA nanoparticles based on Small Angle X-ray Scattering (SAXS). J 504
Phys Conf Ser 2010; 247: 012027.
505
25 Varga Z, Yuana Y, Grootemaat AE, van der Pol E, Gollwitzer C, Krumrey M, 506
Nieuwland R. Towards traceable size determination of extracellular vesicles. J Extracell 507
Vesicles 2014; 3: 23298.
508
26 van der Pol E, Coumans F, Varga Z, Krumrey M, Nieuwland R. Innovation in 509
detection of microparticles and exosomes. J Thromb Haemost 2013; 11: 36–45.
510
27 Coumans FAW, van der Pol E, Böing AN, Hajji N, Sturk G, van Leeuwen TG, 511
Nieuwland R. Reproducible extracellular vesicle size and concentration determination with 512
tunable resistive pulse sensing. J Extracell Vesicles 2014; 3: 25922.
513
28 Fraikin J-L, Teesalu T, McKenney CM, Ruoslahti E, Cleland AN. A high-throughput 514
label-free nanoparticle analyser. Nat Nanotechnol 2011; 6: 308–13.
515
29 van der Pol E, ISTH-SSC-VB Working group, Hau C, Sturk A, van Leeuwen TG, 516
Nieuwland R, Coumans FAW. Standardization of extracellular vesicle measurements by flow 517
cytometry through vesicle diameter approximation. J Thromb Haemost : (submitted).
518
30 de Rond L, van der Pol E, Hau CM, Varga Z, Sturk A, van Leeuwen TG, Nieuwland 519
R, Coumans FAW. Comparison of Generic Fluorescent Markers for Detection of 520
Extracellular Vesicles by Flow Cytometry. Clin Chem 2018; . 521
31 Pálmai M, Nagy LN, Mihály J, Varga Z, Tárkányi G, Mizsei R, Szigyártó IC, Kiss T, 522
21 Kremmer T, Bóta A. Preparation, purification, and characterization of aminopropyl-
523
functionalized silica sol. J Colloid Interface Sci 2013; 390: 34–40.
524
32 Mitra K, Ubarretxena-Belandia I, Taguchi T, Warren G, Engelman DM. Modulation 525
of the bilayer thickness of exocytic pathway membranes by membrane proteins rather than 526
cholesterol. Proc Natl Acad Sci U S A 2004; 101: 4083–8.
527
33 Lewis BA, Engelman DM. Lipid bilayer thickness varies linearly with acyl chain 528
length in fluid phosphatidylcholine vesicles. J Mol Biol 1983; 166: 211–7.
529
34 Balgavý P, Dubnicková M, Kucerka N, Kiselev MA, Yaradaikin SP, Uhríková D.
530
Bilayer thickness and lipid interface area in unilamellar extruded 1,2- 531
diacylphosphatidylcholine liposomes: a small-angle neutron scattering study. Biochim 532
Biophys Acta 2001; 1512: 40–52.
533
35 Tahara Y, Fujiyoshi Y. A new method to measure bilayer thickness: cryo-electron 534
microscopy of frozen hydrated liposomes and image simulation. Micron Oxf Engl 1993 1994;
535
25: 141–9.
536
36 Lambert O, Gerke V, Bader MF, Porte F, Brisson A. Structural analysis of junctions 537
formed between lipid membranes and several annexins by cryo-electron microscopy. J Mol 538
Biol 1997; 272: 42–55.
539
37 Horváth R, Fricsovszky G, Papp E. Application of the optical waveguide lightmode 540
spectroscopy to monitor lipid bilayer phase transition. Biosens Bioelectron 2003; 18: 415–28.
541
38 Ducharme D, Max JJ, Salesse C, Leblanc RM. Ellipsometric study of the physical 542
states of phosphatidylcholines at the air-water interface. J Phys Chem 1990; 94: 1925–32.
543
39 Mashaghi A, Swann M, Popplewell J, Textor M, Reimhult E. Optical anisotropy of 544
supported lipid structures probed by waveguide spectroscopy and its application to study of 545
supported lipid bilayer formation kinetics. Anal Chem 2008; 80: 3666–76.
546
40 Kienle DF, de Souza JV, Watkins EB, Kuhl TL. Thickness and refractive index of 547
DPPC and DPPE monolayers by multiple-beam interferometry. Anal Bioanal Chem 2014;
548
406: 4725–33.
549
41 Barer R, Joseph S. Refractometry of living cells: Part I. Basic principles. J Cell Sci 550
1954; 3: 399–423.
551
42 van der Pol E, de Rond L, Coumans FAW, Gool EL, Böing AN, Sturk A, Nieuwland 552
R, van Leeuwen TG. Absolute sizing and label-free identification of extracellular vesicles by 553
flow cytometry. Nanomedicine Nanotechnol Biol Med 2018; 14: 801–10.
554
43 Shang J, Gao X. Nanoparticle counting: towards accurate determination of the molar 555
concentration. Chem Soc Rev 2014; 43: 7267–78.
556
44 Handbook of Optics, 3rd edition, Vol. 4. McGraw-Hill; 2009.
557
22 45 Daimon M, Masumura A. Measurement of the refractive index of distilled water from 558
the near-infrared region to the ultraviolet region. Appl Opt 2007; 46: 3811–20.
559
46 Valkonen S, van der Pol E, Böing A, Yuana Y, Yliperttula M, Nieuwland R, Laitinen 560
S, Siljander PRM. Biological reference materials for extracellular vesicle studies. Eur J 561
Pharm Sci Off J Eur Fed Pharm Sci 2017; 98: 4–16.
562
23 Figures
563
564
Figure 1 Theoretical forward and side scattering cross sections (FSC and SSC, respectively) 565
of polystyrene beads, silica beads, dim and bright extracellular vesicles (EVs), and hollow 566
organosilica beads (HOB) for an Apogee A60-Micro flow cytometer. The model calculations 567
were performed using the Mie scattering theory. The following refractive indices at a 568
wavelength of 405 nm were used for the calculations: 1.63 for polystyrene, 1.46 for silica, 569
1.48 for the EV shell, 1.34 for core of dim EV, 1.38 for the core of bright EV, 1.46 for the 570
HOB shell, and 1.34 for the HOB core. The particle size (diameter) was 200 nm in all cases, 571
and the shell thickness was set to 5 nm for EVs and 10 nm for HOBs.
572
573
Figure 2 Transmission electron microscopy (TEM) analysis of hollow organosilica beads 574
(HOBs) prepared by using nominal 200 nm (a) and 400 nm (b) sized silica templates.
575
24 576
Figure 3. Size (diameter) distributions of nominal 200 nm and 400 nm sized hollow 577
organosilica beads (HOBs) by single particle detection methods: transmission electron 578
25 microscopy (TEM; a, b; 10 nm bin width), particle tracking analysis (NTA; c, d; 1 nm bin 579
width; the grey area represents the standard deviation), tunable resistive pulse sensing (TRPS;
580
e, f; 10 nm bin width) and microfluidic resistive pulse sensing (MRPS; g, h; the error bars 581
represents the standard deviation, 10 nm bin width). Mean sizes and full-width-at-half- 582
maximum values from Gaussian fits of the distributions are indicated for each method. In 583
case of HOB400, a shoulder can be seen on the distributions which might be attributed to 584
incomplete particles or polycondensation of the organosilica precursor during the synthesis.
585
586
Figure 4 Light scattering properties of polystyrene beads (squares), silica beads (circles), 587
hollow organosilica beads (HOBs; triangles), and platelet-derived (CD61+) extracellular 588
vesicles (EVs; dots) from human plasma measured (symbols) by flow cytometry and 589
calculated (lines) by Mie theory. (a) Side scatter versus size (diameter). Whereas 590
polystyrene and silica beads scatter orders of magnitudes more light than similar-sized EVs, 591
HOBs resemble the expected side scatter properties of EVs (gray area). (b) Side scatter versus 592
forward scatter. In contrast to polystyrene and silica beads, HOBs have forward and side 593
scatter intensities similar to EVs of the same size. Data points and error bars represent the 594
mean and standard deviation, respectively. The arrows relate the size range of EVs expected 595
from Mie theory to their FSC and SSC values. Size ranges are based on the SSC confidence 596
interval (gray area) for EVs in (a). The following refractive indices at a wavelength of 405 nm 597
26 were used for the calculations: 1.63 for polystyrene, 1.46 for silica, 1.48 for the EV shell, 1.35 598
and 1.37 for the EV core to obtain the lower and upper boundary of the grey area in (a), 599
respectively, 1.36 for the EV core in (b), 1.48 for the HOB shell, and 1.34 for the water. Least 600
square fitting resulted in a shell thickness of 10.1 nm for the HOBs.
601
602
Figure 5. Concentration of platelet-derived extracellular vesicles (EVs) within gates set by 603
polystyrene beads, silica beads, and hollow organosilica beads (HOBs) for the forward 604
scattered light (FSC) and side scattered light (SSC) detector. Concentrations are corrected for 605
sample dilutions. For the first 4 gates, the indicated bead is used as the lower size gate and no 606
upper size gate is applied. For the HOB200-HOB400 gate, HOB200 and HOB400 are used as 607
the lower and upper size gate, respectively. The numbers above the bars indicate the 608
percentage difference in the gated concentration relative to the mean concentration.
609