RESEARCH PAPER
Fast optical method for characterizing plasmonic nanoparticle adhesion on functionalized surfaces
László Mérai1&László Janovák1&Dániel Sándor Kovács1&Imre Szenti2&Lívia Vásárhelyi2&Ákos Kukovecz2&
Imre Dékány1&Zoltán Kónya2&Dániel Sebők2
Received: 30 September 2019 / Revised: 11 November 2019 / Accepted: 27 November 2019 / Published online: 24 December 2019
Abstract
In this paper, a rapid optical method for characterizing plasmonic (gold) nanoparticle (AuNP) adhesion is presented. Two different methods were used for AuNP preparation: the well-known Turkevich method resulted in particles with negative surface charge; for preparing AuNPs with positive surface charge, stainless steel was used as reducing agent. The solid surface for adhesion was provided by a column packed with pristine or surface-modified glass beads. The size of the nanoparticles was studied by trans- mission electron microscopy (TEM) and small-angle X-ray scattering (SAXS); the surface charge of the components was deter- mined by streaming potential measurements. The characterization of adhesion was performed in a flow system by UV-Vis spectroscopy. During the adhesion experiments, the role of the surface charge, the particle size, and the pH were studied, as well as the adhered amount of gold nanoparticles and the surface coverage values. The latter was estimated by theoretical calculations and defined by the quotient of the measured and the maximal adhered amount of nanoparticles, which could be determined by the cross-sectional area of the NPs and the specific surface area of the glass beads. The results are verified by the polarization reflectometric interference spectroscopy (PRIfS) method: silica nanoparticles with diameters of a few hundred (d~450) nanometers were immobilized on the surface of glass substrate by the Langmuir–Blodgett method, the surface was modified similar to the 3D (continuous flow packed column) system, and gold nanoparticles from different pH solutions were adhered during the measure- ments. These kinds of modified surfaces allow the investigation of biomolecule adsorption in the same reflectometric setup.
Keywords Plasmonic nanoparticles . Adhesion . Optical method . Flow system . Surface charge . Reflectometric interference spectroscopy
Introduction
Plasmonic particles are widely investigated due to their optical trapping capabilities. In the last few decades, several fields of
application arose, including sensitized solar cells [1], optical circuits [2], and analytical methods, such as surface-enhanced raman spectroscopy and surface plasmon resonance spectros- copy [3,4]. Visible-light photocatalysis also deserves a men- tion: the presence of Au or Ag nanoparticles can tune the bandgap energy of semiconductors like anatase TiO2, which is originally excitable by near-UV electromagnetic radiation [5–7].
As the popularity of this field grew, many simple and scal- able methods have been published discussing the preparation of plasmonic nanostructures, including, for example, bottom- up solvent-phase syntheses [8,9] and top-down lithographic methods [10], which both offer good control over morpholog- ical properties and functionalization. While there are many plasmonic materials to apply including Al, Pt, or Ag, the use of Au dominates these fields [11].
In most of their sensing applications, plasmonic metal nanoparticles require an adhesion layer made of another metal such as Cr or Ti to promote their binding to common Published in the topical collectionAdvances in Direct Optical Detection
with guest editors Antje J. Baeumner, Günter Gauglitz, and Jiri Homola.
Electronic supplementary materialThe online version of this article (https://doi.org/10.1007/s00216-019-02307-x) contains supplementary material, which is available to authorized users.
* Dániel Sebők
sebokd@chem.u-szeged.hu
1 Interdisciplinary Excellence Centre, Department of Physical Chemistry and Materials Science, University of Szeged, Rerrich Bela sqr 1, Szeged 6720, Hungary
2 Interdisciplinary Excellence Centre, Department of Applied and Environmental Chemistry, University of Szeged, Rerrich Bela sqr 1, Szeged 6720, Hungary
https://doi.org/10.1007/s00216-019-02307-x
#The Author(s) 2019
substrates like glass [12]. The adhesion can be improved for example by thermal annealing [13] or binding the nanoparti- cles to the surface covalently [14]. Although the adhesive forces between the plasmonic particles and glass are generally weak, porous glass substrates with high specific surface area were proven to be effective in sensing capability enhancement [15]. If the adhesion takes place at a solid/liquid (S/L) inter- face, one must consider the effect of surface charges of both the particles and the substrate and the particle-particle interac- tions. Kállay and his co-workers extensively studied the pH- and functionalization-dependent adhesion strength, kinetics, and stability of colloidal and nanoparticles in continuous- flow packed column systems. Using continuously rinsed packed columns, they provided information on the interaction energy profiles and diffusion characteristics of their model systems, studying the particle attachment and detachment ki- netics [16–20]. As the concentration of plasmonic Au nano- particles is easily traceable and the stability of their disper- sions is strongly dependent on their chemical environment (pH, ionic strength, complexing agents, etc.) [21], they could be excellent test subjects in such model systems.
In this paper, we present a methodology to character- ize pH-, shape-, and functionalization-dependent adhe- sion strength of model AuNPs as plasmonic nanoparti- cles, and theoretically any other plasmonic metal and even metal-oxide nanoparticles in simple continuous flow systems. As the modern enhanced oil recovery processes (EOR) utilize metal-oxide nanoparticles beside surfactants and polymers to further increase the oil re- covery rate [22, 23], the presented methodology could potentially be helpful during the optimization of novel EOR processes. Furthermore, in this work also the po- larization reflectometric interference spectroscopy (polar- ization RIfS, PRIfS) method [24] is used to verify the results. The concept of the PRIfS technique is similar to the well-known label-free optical analytical methods, such as RIfS [25–36] and surface plasmon resonance (SPR) [37–40]. To the best of our knowledge, this is the first report of applying PRIfS technique for the characterization of nanoparticle adhesion in an aqueous flow system.
Experimental
MaterialsPreparation of gold nanoparticlesNegatively surface charged gold nanoparticles [AuNP(−)] with an average diameter of 14 nm were synthesized by the well-known Turkevich method [41]. Positively surface charged AuNP(+) with an average diameter of 51 nm were synthesized by the method presented in [42]. The pH of the AuNP(−) gold sol (pH = 5) was
adjusted by addingc= 0.1 M HCl (for pH = 3) orc= 0.1 M NaOH (for pH = 7 and 9) solutions to the original sol.
Preparation of the SiO2particlesMonodispersedav= 450-nm silica particles were prepared by the modified method of Jezequel et al. according to [43].
Surface functionalization of the glass beadsGlass beads (<
106 μm and 212–300μm, average diameters ~ 50 and ~ 250 μm, respectively, acid-washed, Sigma–Aldrich; density 2.52 g/cm3) were used as a solid surface for gold nanoparticle adhesion experiments. Cationic polyethylenimine (PEI, branched, MW~8000, Aldrich) was used as a positively charged polyelectrolyte for functionalization (and charge al- teration) of the glass beads.
Instrumental methods
Transmission electron microscopyTEM measurements were carried out by a FEI TECNAI G2 20 X-Twin high-resolution transmission electron microscope (equipped with electron dif- fraction apparatus) operating at an accelerating voltage of 200 kV.
Small-angle X-ray scatteringThe small-angle X-ray scattering (SAXS) curve was recorded with a slit-collimated Kratky compact small-angle system (KCEC/3 Anton-Paar KG, Graz, Austria) equipped with a position-sensitive detector (PSD 50 M from M. Braun AG Munich, Germany) containing 1024 channels 55μm in width. CuKαradiation (λCuKα= 0.1542 nm) was generated by a Philips PW1830 X-ray gen- erator operating at 40 kV and 30 mA.
Computed tomography Micro-CT measurements were car- ried out with a Bruker SkyScan 2211 nanoTomograph instru- ment (source voltage,U= 110 kV; source current,I= 150μA;
pixel resolution 1.6 μm). A capillary (Markröhrchen, Hilgenberg) 2 mm in diameter was filled with the d-
av= 250 μm glass beads. After the reconstruction proce- dure (NRecon software, Bruker), CTVox and CTAn (Bruker) softwares were used to generate the 3D- rendered image and calculate the size distribution and porosity (ε).
Streaming potential The streaming potential values of the stationary phase (glass beads), the AuNP(−)s and AuNP(+)s were measured applying a PCD-04 Particle Charge Detector (Mütek Analytic GmbH, Germany). The negative surface charge excess of the glass beads and the AuNP(−)s were neu- tralized by 0.01 g/100 cm3(0.01%) polyethylene imine (PEI) and 0.01% hexadecylpyridinium chloride (HDPCl) solutions, respectively, while the positive surface charge excess of AuNP(+)s was neutralized by 0.01% sodium dodecylsulfate
(NaDS) surfactant solution during particle charge titrations.
The charge compensation states were achieved at streaming potentials of 0 mV. The surface charge excess values were calculated according to the following equation:
q1¼V20;01c2q2
c1V1M1 ð1Þ
where q1and q2are the specific charge excess of the examined specimen and the titrant, respectively (meq/g)V2andc2are the volume (cm3) and the concentration (g/100 cm3) of the charge-neutralizing agent solution,V1andc1are the volume (cm3) and the concentration (mol/dm3) of the examined dis- persion, whileM1is the molar mass (g/mol) of the examined specimen. The reversal of surface charge excess is also avail- able by adding an excess amount of titrant to the initial dispersion.
SpectrophotometryThe visible range extinction spectra of the gold sols were recorded by an ADC1000-USB diode array spectrophotometer (Ocean Optics, Duiven, Netherlands).
The data points of the extinction vs. concentration calibration curves are the average of five repeated measurements, the uncertainty of the measured extinction values is ± 0.025.
Adhesion measurementFigure1shows the principle (a) and the schematic view of the adhesion measurement setup (b).
The flow of the gold sol (c= 20 mg/L) is driven by a peristaltic pump (Ismatech Reglo Digital) with a flow rate ofI= 500μL/
min through a stationary phase (L= 60 mm long andd= 8 mm in diameter glass tube filled with glass beads,V= 3.016 mL), while the extinction of the gold sol is measured both before (flow-in) and after (flow-out) the column withV= 400 μL flow-through cells. The difference between the flow-in and flow-out concentrations is due to the adhesion. In dilute sys- tems the extinction of the sol is proportional to the concentra- tion of the plasmonic particles; therefore, the former can be converted to the latter by calibration (see Electronic Supplementary Material (ESM) Fig.S1). It has to be noted that the uncertainty of ± 0.025 in the extinction value causes uncertainties of 1.47 and 3.26 mg/L in the concentration of AuNP(−) and AuNP(+) sols, respectively, during the adhesion
measurements, which are indicated by the X- and Y-error bars on Fig.S1(see ESM). During the measurement the extinction values corresponding to the characteristic plasmonic peaks are monitored in real time, the signal/noise ratio is improved by polynomial fitting, as described in [31]. The point-by-point substraction of the flow-out curve from the flow-in curve re- sults in the difference curve (see Fig.1). The (extinction-) difference (E) curve can be converted to mass flow (MF) by eq. (2):
MF tð Þ ¼c tð Þ I¼E tð Þ k cð Þ I ð2Þ
whereMFis the mass flow,cis the concentration andEis the extinction in a giventmoment,k(c)is the slope of thecvs.E calibration curve (see ESM Fig. S1) andIis the constant flow rate (0.5 mL/min). This curve can be divided into three char- acteristic ranges: (1) in the first range (I. on Fig.1) the mass flow through the flow-out cell is zero, i.e., all of the gold nanoparticles are adhered to the GB surface, the extent and rate of the adhesion process is maximal; (2) in the second regime (II. on Fig.1) the adhesion rate decreases, more and more gold nanoparticles are passing through the stationary phase; (3) the third region (III. on Fig.1) is the saturation range, the adhered amount of AuNPs reached the maximal adhesion capacity of the GBs, all of the particles pass through the column. The adhered amount of gold nanoparticles (mNPexp) can be obtained by the numerical integration of this mass flow curve. It has to be noted that there are two sources of inaccuracy in the flow system: on one hand, there is a path, therefore a time difference between the two flow-through cells, which wast= 170 ± 5 s depending on the space filling of the column (1-ε). The flow-out curves were corrected by this delay. On the other hand, the saturation of the concentra- tion profile in the flow-through cells is not an instantaneous process; it takes t= 50 s, which causes ca. mNPexp= 10 μg AuNP/g GB deviation. This inaccuracy is indicated in the tables.
Thin film preparationLangmuir films at the air/liquid inter- face and LB films on glass substrates (for the reflectometric interference spectroscopy measurements) were prepared in a Kibron MicroTroughS Langmuir-trough. Spreading sols were Fig. 1 The principle of the gold
nanoparticle adhesion measurement (a) and the schematic view of the measurement setup (b)
obtained by mixing the original sol with chloroform (Sigma–
Aldrich, Chromasolv®, ≥99.9%) in the volume ratio 1:1.
Glass substrates for LB films were cleaned in piranha solution and rinsed with deionized water before film preparation. The monolayer films were pulled out at constant pressure (π= 10 mN/m), only in the upstroke direction. The surface of the thin films was modified (with PEI) similarly to the 3D system.
PRIfSPolarization reflectometric interference spectroscopy measurements were carried out according to the phenomenon and optical setup described in [24]. RIfS and PRIfS methods are hardly different, the only difference lies in the measure- ment techniques. While in the former case the detector mea- sures the average of all the polarization states, the ratio of the s- and p-polarized reflected intensity is measured by using a polarizer in the latter. Therefore, the sensor response (R) is defined by the ratio of the p- and s-polarized components of the reflected light, as described in eq. (3):
R¼IR;p
IR;s ð3Þ
Results and discussion
Characterization of the gold nanoparticles
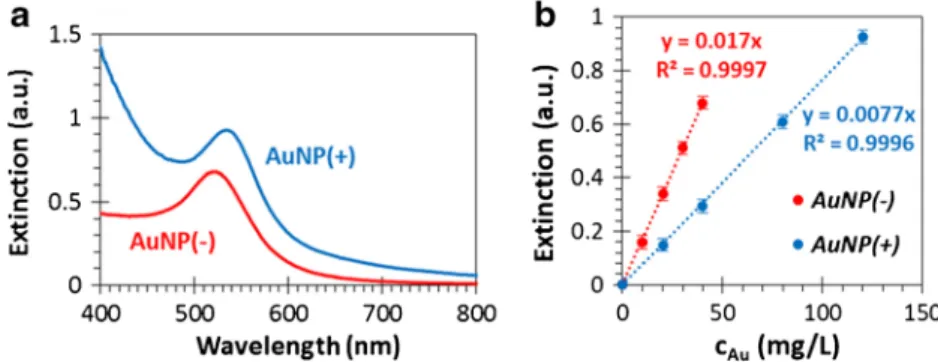
Figure2ashows the representative UV-Vis extinction spectra of the synthesized gold nanoparticles/sols. There is a character- istic plasmonic band atλ= 490–550 nm (with a maximum at λ= 520 nm) in the case of the monodisperse AuNP(−) sol with narrow size distribution. The plasmonic band appears atλ= 505–565 nm (with a maximum atλ= 532 nm) for the AuNP(+) sol, which corresponds to the formation of larger particles com- pared with the AuNP(−) sol. During the adhesion measure- ments in the flow system the extinction values corresponding to these wavelengths (λ= 520 and 532 nm for AuNP− and AuNP+, respectively) are monitored, because the calibration curves (i.e., extinction vs concentration, see Fig.2b) were mea- sured and plotted on these same wavelength values.
The size of the AuNP(−) and AuNP(+) plasmonic gold nanoparticles were determined by TEM measurements (ESM Fig. S2A-D), moreover, in the case of the AuNP(−) sample, due to its monodispersity, the results could have been confirmed by SAXS measurements (ESM Fig.S2.E). On the TEM image and size distribution diagram the nearly mono- disperse character of the AuNP(−) sample with an average diameter ofd= 14 ± 1 nm can be observed, however, the pos- itively charged gold particles have a broad size distribution between 30 and 80 nm with an average of ~ 51 ± 13 nm.
Furthermore, the Guinier plot [44] of the AuNP(−) sample’s SAXS curve shows the monodispersity with a diameter ofd= 14.7 nm; the slight difference can be explained by the citrate as a stabilizing agent.
Characterization of the glass beads
Determining the size distribution of the used glass beads con- tributes to the accurate estimation of the specific surface area, the surface coverage (Θ) of the AuNPs and space filling of the stationary phase. Size distributions of the smaller (~ 50μm) and larger (~ 250μm) glass beads were determined by optical microscopy (ESM Fig. S3.a). The average diameter of the smaller fraction is 55.7 ± 9.2μm and it is 273.7 ± 37.6 μm for the larger glass beads (ESM Fig. S3.b). Therefore, for practical reasons the notations of the used glass beads will be GB56 and GB274, respectively. Similarly, the notations of the surface-modified samples are GB56(+) and GB274(+
), respectively. The size distribution of the GB274 glass beads was verified by micro-CT measurements: ESM Fig. S3c shows the 3D-rendered volume of the capillary filled by GB274 spheres, while ESM Fig.S3drepresents the selected volume of interest (VOI) for further calculations (red: GB274, blue: void). Based onμCT measurements the size distribution of the larger fraction was determined (which hardly differs from the optical microscopy results), as well as, the average porosity of the stationary phase was calculated (ε= 36.8%, ESM Fig.S3e). This data is consistent with the values pre- sented later, namely the porosity of the different stationary phases determined by mass measurement.
Fig. 2 Representative UV-Vis spectra of the AuNP(−) (red) and AuNP(+) (blue) sols (a) and the extinction vs. concentration (calibration) curves atλ= 520 (red) and 532 nm (blue) for AuNP(−) and AuNP(+) sols, respectively
Streaming potential measurements
The specific surface charge excess value of the AuNP(−) particles was calculated according to charge compensation method described in Chapt. 2.2. The charge compensation required 295 μL of 0.01%
HDPCl solution, which according to our equation gives a specific surface charge excess value of −4.18 × 10⁻² meq/g, while the value of the independently deter- mined ζ-potential is −43.2 mV. In the case of AuNP(+) particles, 0.01% NaDS solution was used during the surface charge measurements: the volume of the solu- tion required for charge neutralization turned out to be 9.5 mL, indicating a specific surface charge value of 1.64 eq/g, while the ζ-potential was 47.6 mV.
The surface charge excess of the GB56 glass beads, used as adhesion surfaces was also reversed applying excess amount of PEI (0.01 wt. PEI solution). In this case, the consumed 350μL of 0.01% HDPCl solution during charge compensa- tion measurements indicated the specific surface charge value of−1.96 ×10⁻⁵meq/g. However, this charge neutralization method cannot be applied on GB274 glass beads because of the fast sedimentation of the beads.Therefore, we assumed lower specific surface charge excess values (for geometric reasons, assuming that the same amount (mass) of the larger GBs has a smaller total surface area), keeping the same amount of used PEI as in the case of the smaller GB56 glass beads during the surface charge reversal process.
Theoretical calculations
Theoretical calculations were performed to estimate the spe- cific surface area (Asφ, m2/g) of the glass beads and the cross- sectional surface area (asNP, m2/g) of the gold nanoparticles.
The ratio of these two values is in correlation with the maxi- mal (monoparticular) surface coverage (Θ) of the AuNP/GB system. The specific surface area of a spherical particle de- pending on the particle diameter can be determined by eq. (4):
ASφ¼A mφ¼ A
ρVφ¼ 4r2π ρ4r3π
3 φ¼ 3
ρrφ¼φ 6 ρd
m2
kg ¼φ6000 dρ
m2 g
ð4Þ whereAis the surface area andVis the volume of a particle, 2r = dis the particle diameter [nm],ρis the particle density (g/cm3,ρSiO2= 2.32 g/cm3) andφ= 0.9069 (reducing the area with the glass beads’contact points in 3D), assuming hexag- onal and monoparticular adhesion of spherical particles (see ESM Fig.S5a and b). Similarly, the cross-sectional surface area of a particle with a diameter ofd [nm]and density ofρ (g/cm3,ρAu= 19.3 g/cm3) can be determined by eq. (5) (ESM Fig.S5c):
asNP¼Ap
m ¼ r2π ρ4r3π
3
¼ 3
ρ4r¼ 3 ρ2d
m2
kg ¼3000 2dρ
m2 g
ð5Þ whereApis the projection area of a sphere. The (theoretically calculated) maximal monoparticular (Θ= 1) adhered amount of nanoparticles can be determined by the ratio of these two values, as described by eq. (6). The results are presented in Table1.
mNPmp;th¼ Asφ
asNP ð6Þ
Adhesion in equilibrium
The adhesion of the gold nanoparticles on the surface of GB274(+) glass beads was investigated in equilibrium conditions (in a non-flow system), as described in [45], at different pH values.
Before measurement the GB274(+) samples were placed into an oven at 373 K for 4 h. Measured amounts (m = 0.5 ± 0.009 mg) of heat-treated GB274(+) sample was placed into vessels followed by introduction of the pre-prepared AuNP(−) gold sols (V = 10 mL) with known concentrations (N= 5, c0= 20, 40, 50, 60 and 80 mg/L; three series were investigated at different pH values: pH = 3, 5 and 7). The vessel was closed and equilibrated for 5 h with slight magnetic stirring, while the equilibrium pH value was checked and corrected to the initial value in every hour. The change in the concentration of the gold sol due to adsorption was determined by UV-Vis pho- tometry, measuring the extinction values of the supernatant (ce). The amount corresponding to the decrease in concentra- tion (c0-ce) is equal to the specific adhered mass of AuNP(−)s (mNPexp, mg/g).
mNPexp¼ðc0−ceÞ V
mGB ð7Þ
The surface coverage can be calculated as the ratio of this value and the theoretically calculated maximally Table 1 The cross-sectional surface area of the AuNPs (asNP), GB di- ameter (dGB), specific surface area of GB (AS) and the maximal adhered mass of AuNP (mNPmp,th) in the case of the different plasmonic NPs with different diameters (dNP)
Sol dNP
[nm]
asNP
[m2/g]
dGB
[μm]
AS [m2/g]
mNPmp,th
[mg/g]
AuNP(−) 14 ± 1 5.6 ± 0.4 55.7 ± 9.2 0.042 ± 0.008 7.6 ± 1.9 273.7 ± 37.6 0.009 ± 0.001 1.5 ± 0.3 AuNP(+) 51 ± 13 1.5 ± 0.4 55.7 ± 9.2 0.042 ± 0.008 27.6 ± 12.9
273.7 ± 37.6 0.009 ± 0.001 5.6 ± 2.4
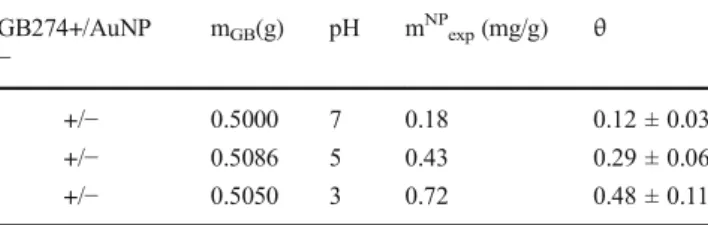
adhered amount: Θ= mNPexp / mNPmp,th. Table 2 shows the systematic increase of the adhered amount (and the surface coverage) due to the pH decrease, which result was verified by the flow system measurements.
Adhesion in a flow system
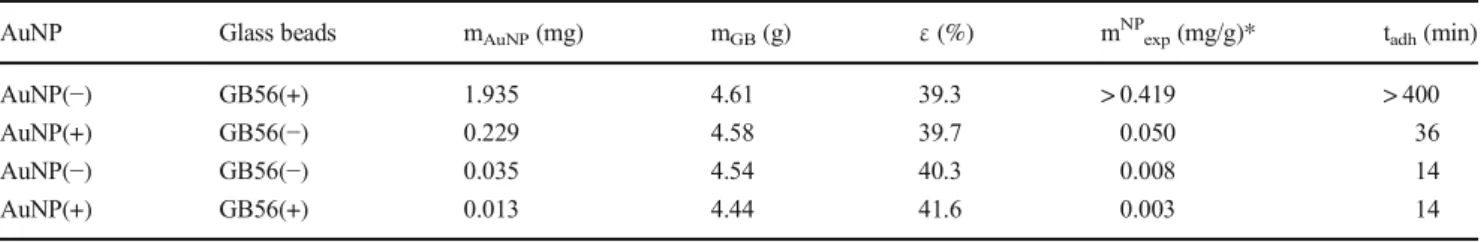
Charge dependencyFigure3shows the results of the surface charge dependency experiments in the case of AuNP/GB56:
−/+, ±,−/−and +/+ pairs. As expected, both the time and the extent of the adhesion are negligible in the case of the uni- formly charged units: the adhered mass of AuNPs is in the few μg/g range, while the adhesion time is less than 15 min.
Slightly stronger interaction was observed for the AuNP(+
)/GB56(−) pair, and a significant adhesion interaction was found between the AuNP(−)s and GB56(+)s. The results are summarized in Table3. Having regard to the extremely high adhered amount of AuNP(−) particles due to the strong attrac- tion between the negatively charged AuNPs and the PEI mod- ified, therefore positively charged GBs even at pH = 7 value, and assuming that decreasing the pH will cause a significant increase in the adhered amount of gold nanoparticles, the pH dependency experiments were carried out by using the
GB274(+) glass beads, because they have lower surface ener- gy and specific surface charge.
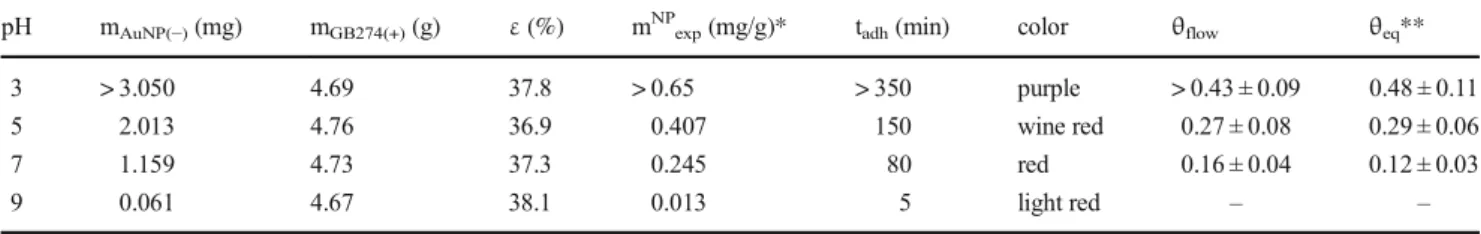
pH dependencyFor the investigation of the pH dependency of the adhesion process gold sols of 20 mg/ml concentration were used, at different pH levels (pH = 3, 5, 7, and 9) on the larger (GB274) glass beads. A rapid increase in the adhesion time was observed with the decreasing pH, while with increasing the pH the amount of adhered gold greatly decreased, which can be explained by the pendant -NH2 groups of the PEI, which covers the sur- face of the glass beads becoming increasingly protonat- ed with the decreasing pH, while the –COOH and – COO− groups of the citrates that covers the gold nano- particles are neutrally or slightly negatively charged (pKA = 2) [21], thus allowing the formation of a strong interaction. Obviously, the increasing pH causes a de- protonation on the –NH2 groups of the PEI, the net positive charges are compensated by the negative sur- face charges of the glass beads, thus the adhesion inter- action weakens. There is also a visually detectable color change of the adhered gold at different pH levels (Fig. 4): at pH = 9 the color barely changes, at pH = 7 and 5 the specific wine red color of the citric gold nanoparticles could be observed, with a deeper color at the lower pH, which indicated the larger amount of adhered gold, while at pH = 3 the color became dark purple, which can be an evidence of the strong aggregation of the particles on the surface of the glass beads (the degree of gold nanoparticle aggregation both in the sol and on the surface can be checked by the color, i.e. by the shape of the extinction spectra.
During the measurements no change was observed, nei- ther in the flow-in nor in the flow-out branch, indicating an unchanged aggregation state and nanoparticle size, Table 2 Specific adhered mass of gold nanoparticles (mNPexp) and
surface coverage (Θ) values in the case of GB274(+) glass beads and d= 14 nm AuNP(−) gold nanoparticles, at different pH values, in equi- librium conditions
GB274+/AuNP
− mGB(g) pH mNPexp(mg/g) θ
+/− 0.5000 7 0.18 0.12 ± 0.03
+/− 0.5086 5 0.43 0.29 ± 0.06
+/− 0.5050 3 0.72 0.48 ± 0.11
Fig. 3 Results of the charge dependency of the gold nanoparticle adhesion experiments for AuNP(−)/
GB56(+) (a), AuNP(+)/GB56(−) (b), AuNP(−)/GB56(−) (c) and AuNP(+)/GB56(+) (d) pairs (AuNP: nanoparticle, GB:
stationary phase): flow-in (red), flow-out (blue) and difference curves (green)
except in the case of pH = 3, but only for the adhered NPs, not in the sol). The state of the column shows that this process did not saturated even after more than 300 min. The results are summarized and compared with the data obtained from the experiments carried out in the equilibrium conditions in Table 4. The result of the static and dynamic investigations are in a good agreement, the slight differences in the surface coverage values can be explained by the inaccuracy of the measurement.
Reflectometric interference spectroscopy measurementsThe experiments in the aqueous flow system (bulk, 3D) were verified by polarization reflectometric interference spec- troscopy (PRIfS) measurements, with the difference that the surface for the adhesion was not GB, but a thin film formed by d = 450 nm SiO2 particles. After the prepa- ration of the thin film the surface was modified by PEI by dip-coating technique [31]. Given the fact that this method is based on thin film technique, both the flow rate and the concentration of the AuNP(−) sol were reduced compared with the previously presented flow- system. The flow rate in these experiments was I= 50 μL/min and the concentration of the gold sol was 2 mg/L. Figure 5 shows the results: similarly to the results presented in Ch. “pH dependency”, significantly
increasing adhered amounts of AuNP(−)s and adhesion process times were observed with the decrease in pH, as expected. The explanation is the same: the decreasing pH causes a protonation on the –NH2 groups of the PEI; thus, the adhesion interaction between the proton- ated –NH3+ groups and the AuNP(−)s intensifies.
Conclusions
In this work a model experiment of adhesion of gold nanopar- ticles on glass bead solid surfaces was presented, addressing the effect of the charge state of the components (±,−/+,−/−, +/+), the glass bead size (d = 56 and 274μm) and the pH (= 3, 5, 7, and 9) on the adhesion process in both (static) equilibri- um and (dynamic) flow systems. The dynamic measurements were carried out in a liquid-flow platform, which consists of a column containing glass beads as a solid phase, with a con- centration detection on both ends, which allows the investiga- tion of the adhered amount of gold nanoparticles and the strength of the adhesion. The size of the glass beads seemed to have a significant effect on the amount of adhered gold:
with the increasing size, the adhered amount decreased, due to the smaller surface energy and charge density of the larger glass beads. The investigation of the effect of charge served the expected results: the interaction between the equally Table 3 Summarizing table of the data obtained from the experiments
carried out by using GB56 glass beads and pH = 7 AuNP sols with different surface charge combinations: mAuNPis the calculated adhered
mass of AuNPs, mGBandεare the mass and the porosity of the stationary phase, respectively, mNPexpis the calculated specific adhered mass of AuNPs and tadhis the adhesion process time
AuNP Glass beads mAuNP(mg) mGB(g) ε(%) mNPexp(mg/g)* tadh(min)
AuNP(−) GB56(+) 1.935 4.61 39.3 > 0.419 > 400
AuNP(+) GB56(−) 0.229 4.58 39.7 0.050 36
AuNP(−) GB56(−) 0.035 4.54 40.3 0.008 14
AuNP(+) GB56(+) 0.013 4.44 41.6 0.003 14
*Inaccuracy 10μg/g
Fig. 4 Results of the pH dependency of the gold nanoparticle adhesion experiments for AuNP(−)/
GB274(+) pairs in the case of pH = 9 (a), 7 (b), 5 (c), and 3 (d) (AuNP: nanoparticle, GB:
stationary phase): flow-in (red), flow-out (blue) and difference curves (green)
charged component was negligible, while the interaction of the opposing charges was significantly stronger, especially in case of the AuNP(−) and the PEI-modified glass beads, due to the protonatable groups of the polymer. A similar effect was observed in the case of the pH dependency investigation, where the decrease of the pH resulted in a rapid increase of the protonation of the polyelectrolyte, as well as the adhered amount of gold and the level of aggregation. The result of the static and dynamic investigations were in good agreement, despite the non-equilibrial nature of the dynamic system;
therefore, the adhesion of these components seems to be irre- versible. The slight differences in the surface coverage values can be explained by the inaccuracy of the measurement.
During the static measurements, a precipitation reaction oc- curred in the case of the gold sol produced by a metal-matrix reduction reaction, which prohibited the measurement of ad- hesion; however, in the case of the gold sol reduced and sta- bilized by citrate and the PEI-modified glass beads, the adhe- sion was easily observable and the outcome showed good agreement with the results of the dynamic measurements. In this case, the precipitant formation was restrained by the brief interaction of the nanoparticles and the glass beads, which
prevented the occurrence of the surface reaction. The results of the 3D measurements were verified by using reflectometric interference technique: both the adhered amount of AuNP(−)s and the adhesion process time were significantly increased with the decrease in pH of the gold sol, because the decreasing pH causes a protonation on the–NH2groups of the PEI, thus the adhesion interaction between the–NH3+
groups and the AuNP(−)s intensifies.
Acknowledgments Open access funding provided by University of Szeged (SZTE). The project presented in this article was supported by The Hungarian Scientific Research Fund (NKFIH OTKA) grant number PD 116224 (DS) and the UNKP-19-3 New National Excellence Program of the Ministry of Human Capacities (LM). This study was supported also by the European Union and the Government of Hungary through grants GINOP-2.3.2-15-2016-00013 and GINOP-2.3.3-15-2016-00010, The Ministry of Human Capacities, Hungary grant 20391-3/2018/
FEKUSTRAT and by the János Bolyai Research Scholarship of the Hungarian Academy of Sciences.
Author contributions Conceptualization, methodology, software, SAXS measurements, writing—original draft preparation, D. Sebők; Synthesis, optical measurements, and evaluation, D. Sebők and D.S. Kovács;
Surface modification, streaming potential measurements, L. Mérai;
writing—review and editing, L. Janovák and L. Vásárhelyi; micro-CT measurement, D. Sebők; micro-CT evaluation, L. Vásárhelyi. and I.
Szenti; supervision, Á. Kukovecz., I. Dékány., Z. Kónya.
Compliance with ethical standards
Conflict of interest The authors declare that they have no conflict of interest.
Open Access This article is licensed under a Creative Commons Attribution 4.0 International License, which permits use, sharing, adaptation, distribution and reproduction in any medium or format, as long as you give appropriate credit to the original author(s) and the source, provide a link to the Creative Commons licence, and indicate if changes were made. The images or other third party material in this article are included in the article's Creative Commons licence, unless indicated otherwise in a credit line to the material. If material is not included in the article's Creative Commons licence and your intended use is not permitted by statutory regulation or exceeds the permitted use, you will need to obtain permission directly from the copyright holder. To view a copy of this licence, visit http://creativecommons.org/licenses/by/4.0/.
Table 4 Summarizing table of the data obtained from the experiments carried out by using GB274(+) glass beads and pH = 3, 5, 7 and 9 AuNP(−) sols:εis the porosity of the stationary phase, mAuNP(−)is the calculated adhered mass and mNPexpis the calculated specific adhered
mass of AuNPs, tadhis the adhesion process time, color shows the color of the stationary phase after the adhesion process,ΘflowandΘeqshow the calculated surface coverage values obtained by the flow system and equilibrium experiments
pH mAuNP(−)(mg) mGB274(+)(g) ε(%) mNPexp(mg/g)* tadh(min) color θflow θeq**
3 > 3.050 4.69 37.8 > 0.65 > 350 purple > 0.43 ± 0.09 0.48 ± 0.11
5 2.013 4.76 36.9 0.407 150 wine red 0.27 ± 0.08 0.29 ± 0.06
7 1.159 4.73 37.3 0.245 80 red 0.16 ± 0.04 0.12 ± 0.03
9 0.061 4.67 38.1 0.013 5 light red – –
*Inaccuracy 10μg/g,**data fromTable2
Fig. 5 Results of the nanoparticle adhesion measurements on the surface of d = 450 nm in diameter SiO2NPs: polarization reflectometric interference spectroscopy sensorgrams for pH = 9 (green), 7 (blue), 5 (red) and 3 (black) AuNP(−) sols
References
1. Mokari G, Heidarzadeh H. Efficiency enhancement of an ultra-thin silicon solar cell using plasmonic coupled core-shell nanoparticles.
Plasmonics, Published online. 2019. https://doi.org/10.1007/
s11468-018-0891-3.
2. Dragoman D, Vladescu E. Ring-shaped plasmonic logic gates.
Plasmonics. 2019;14:71–8.https://doi.org/10.1007/s11468-018- 0779-2.
3. Agarwal NR, Tommasini M, Ciusani E, Lucotti A, Trusso S, Ossi PM. Protein-metal interactions probed by SERS: lysozyme on nanostructured gold surface. Plasmonics. 2018;13:2117–24.
https://doi.org/10.1007/s11468-018-0728-0.
4. Hottin J, Wijaya E, Hay L, Maricot S, Bouazaoui M, Vilcot JP.
Comparison of gold and silver/gold bimetallic surface for highly sensitive near-infrared SPR sensor at 1550 nm. Plasmonics. 2012;8:
619–24.https://doi.org/10.1007/s11468-012-9446-1.
5. Abed J, Alexander F, Taha I, Rajput N, Aubry C, Jouiad M.
Investigation of broadband surface plasmon resonance of dewetted Au structures on TiO2by aperture-probe SNOM and FDTD simu- lations. Plasmonics. 2018;14:205–18. https://doi.org/10.1007/
s11468-018-0794-3.
6. Merai L, Deak A, Sebok D, Csapo E, Kolumban TS, Hopp B, et al.
Photoreactive composite coating with composition dependent wet- ting properties. Express Polym Lett. 2018;12:1061–71.https://doi.
org/10.3144/expresspolymlett.2018.93.
7. Farbod M, Khademalrasool M, Talebzadeh MD. Plasmon- enhanced photocatalysis based on Ag plasmonic nanospheres and ZnO nanoparticles: synthesis and study mechanisms governing the plasmonic photocatalytic performance. Plasmonics. 2016;12:759– 69.https://doi.org/10.1007/s11468-016-0323-1.
8. Veres Á, Rica T, Janovák L, Dömök M, Buzás N, Zöllmer V, et al.
Silver and gold modified plasmonic TiO2hybrid films for photo- catalytic decomposition of ethanol under visible light. Catal Today.
2012;181:156–62.https://doi.org/10.1016/j.cattod.2011.05.028.
9. Lu X, Rycenga M, Skrabalak SE, Wiley B, Xia Y. Chemical syn- thesis of novel plasmonic nanoparticles. Annu Rev Phys Chem.
2009;60:167–92. https://doi.org/10.1146/annurev.physchem.
040808.
10. Choi B, Iwanaga M, Miyazaki HT, Sakoda K, Sugimoto Y.
Emission-enhanced plasmonic substrates fabricated by nano- imprint lithography. Proc Spie. 2014.https://doi.org/10.1117/12.
2037190.
11. Wu N. Plasmonic metal-semiconductor photocatalysts and photoelectrochemical cells: a review. Nanoscale. 2018;10:2679– 96.https://doi.org/10.1039/c7nr08487k.
12. Roxworthy BJ, Toussaint KC. Plasmonic nanotweezers: strong in- fluence of adhesion layer and nanostructure orientation on trapping performance. Opt Express. 2012;20:9591–603.https://doi.org/10.
1364/oe.20.009591.
13. Karakouz T, Maoz BM, Lando G, Vaskevich A, Rubinstein I.
Stabilization of gold nanoparticle films on glass by thermal anneal- ing. ACS Appl Mater Interfaces. 2011;3:978–87.https://doi.org/10.
1021/am100878r.
14. Lamy de la Chapelle M, Shen H, Guillot N, Frémaux B, Guelorget B, Toury T. New gold nanoparticles adhesion process opening the way of improved and highly sensitive plasmonics technologies.
Plasmonics. 2012;8:411–5.https://doi.org/10.1007/s11468-012- 9405-x.
15. Pshenova AS, Sidorov AI, Antropova TV, Nashchekin AV.
Luminescence enhancement and SERS by self-assembled plas- monic silver nanostructures in nanoporous glasses. Plasmonics.
2018;14:125–31.https://doi.org/10.1007/s11468-018-0784-5.
16. Haque MF, Kallay N, Privman V, Matijevic E. Magnetic effects in particle adhesion: I. Kinetics of hematite deposition on stainless
steel. J Colloid Interface Sci. 1990;137:36–47.https://doi.org/10.
1016/0021-9797(90)90041-L.
17. Kallay N, Biskup B, Tomic M, Matijevic E (1986) Particle adhesion and removal in model systems: X. The effect of electrolytes on particle detachment. J Colloid Interface Sci 114:357–362. doi:
https://doi.org/10.1016/0021-9797(86)90421-2
18. Kallay N, Torbic Z, Golic M, Matijevic E. Determination of the isoelectric points of several metals by an adhesion method. J Phys Chem. 1991;95:7028–32.
19. Ryde N, Kallay N, Matijevic E. Particle adhesion in model systems:
part 14.–experimental evaluation of multilayer deposition. J Chem Soc Faraday Trans. 1991;87:1377–81.
20. Kallay N, TomićM, Biškup B, KunjašićI, MatijevićE. Particle adhesion and removal in model systems: XI. Kinetics of attachment and detachment for hematite - glass systems. Colloid Surf. 1987;28:
185–97.https://doi.org/10.1163/156856190X00234.
21. Csapó E, Sebők D, Makrai Babic J, Supljika F, Bohus G, Dékány I, et al. Surface and structural properties of gold nanoparticles and their biofunctionalized derivatives in aqueous electrolytes solution.
J Dispers Sci Technol. 2014;35:815–25.https://doi.org/10.1080/
01932691.2013.817314.
22. Zaid HM, Latiff NRA, Yahya N, Soleimani H, Shafie A.
Application of electromagnetic waves and dielectric nanoparticles in enhanced oil recovery. J Nano Res. 2014;26:135–42.https://doi.
org/10.4028/www.scientific.net/JNanoR.26.135.
23. Ragab AMS. Investigating the potential of nanomaterial for en- hanced oil recovery: state of art. J Sci Technol. 2015;6:25–40.
24. Janovák L, Dékány I, Sebők D. The theoretical concept of polari- zation reflectometric interference spectroscopy (PRIFS): an optical method to monitor molecule adsorption and nanoparticle adhesion on the surface of thin films. Photonics. 2019;6:76.https://doi.org/
10.3390/photonics6030076.
25. Gauglitz G, Krause-Bonte J, Schlemmer H, Matthes A. Spectral interference refractometry by diode array spectrometry. Anal Chem. 1988;60:2609–12.https://doi.org/10.1021/ac00174a015.
26. Gauglitz G, Brecht A, Kraus G, Mahm W. Chemical and biochem- ical sensors based on interferometry at thin (multi-) layers. Sensors Actuators B Chem. 1993;11:21–7.https://doi.org/10.1016/0925- 4005(93)85234-2.
27. Reichl D, Krage R, Krummel C, Gauglitz G. Sensing of volatile organic compounds using a simplified Reflectometric interference spectroscopy setup. Appl Spectrosc. 2000;54:583–6.
28. Hänel C, Gauglitz G. Comparison of reflectometric interference spectroscopy with other instruments for label-free optical detection.
Anal Bioanal Chem. 2002;372:91–100.
29. Zimmermann R, Osaki T, Gauglitz G, Werner C. Combined microslit electrokinetic measurements and reflectometric interfer- ence spectroscopy to study protein adsorption processes.
Biointerphases. 2007;2:159–64.
30. Rau S, Gauglitz G. Reflectometric interference spectroscopy (RIfS) as a new tool to measure in the complex matrix milk at low analyte concentration. Anal Bioanal Chem. 2012;402:529–36.https://doi.
org/10.1007/s00216-011-5470-9.
31. Sebők D, Dékány I. ZnO2nanohybrid thin film sensor for the de- tection of ethanol vapour at room temperature using reflectometric interference spectroscopy. Sensors Actuators B Chem. 2015;206:
435–42.https://doi.org/10.1016/j.snb.2014.09.087.
32. Sebők D, Janovák L, Kovács D, Sápi A, Dobó D, Kukovecz Á, et al. Room temperature ethanol sensor with sub-ppm detection limit: improving the optical response by using mesoporous silica foam. Sensors Actuators B Chem. 2016;243:1205–13.https://doi.
org/10.1016/j.snb.2016.12.097.
33. Kumeria T, Parkinson L, Losic D. A nanoporous interferometric micro-sensor for biomedical detection of volatile sulphur com- pounds. Nanoscale Res Lett. 2011;6:634.https://doi.org/10.1186/
1556-276X-6-634.
34. Kumeria T, Kurkuri MD, Diener KR, Parkinson L, Losic D. Label- free reflectometric interference microchip biosensor based on nanoporous alumina for detection of circulating tumour cells.
Biosens Bioelectron. 2012;35:167–73.https://doi.org/10.1016/j.
bios.2012.02.038.
35. Choi HW, Takahashi H, Ooyaa T, Takeuchi T. Label-free detection of glycoproteins using reflectometric interference spectroscopy- based sensing system with upright episcopic illumination. Anal Methods. 2011;3:1366–70.https://doi.org/10.1039/C0AY00762E.
36. Choi HW, Sakata Y, Kurihara Y, Ooya T, Takeuchi T. Label-free detection of C-reactive protein using reflectometric interference spectroscopy-based sensing system. Anal Chim Acta. 2012;728:
64–8.https://doi.org/10.1016/j.aca.2012.03.030.
37. Homola J, Yee S, Gauglitz G. Surface plasmon resonance sensors:
review. Sensors Actuators B Chem. 1999;54:3–15.https://doi.org/
10.1016/S0925-4005(98)00321-9.
38. Homola J. Surface plasmon resonance sensors for detection of chemical and biological species. Chem Rev. 2008;1082:462–93.
https://doi.org/10.1021/cr068107d.
39. Vaisocherová H,Šípová H, Víšová I, Bocková M,Špringer T, Ermini ML, et al. Rapid and sensitive detection of multiple microRNAs in cell lysate by low-fouling surface plasmon reso- nance biosensor. Biosens Bioelectron. 2015;70:226–31.https://
doi.org/10.1016/j.bios.2015.03.038.
40. Špacková B, Wrobel BM, Homola J. Optical biosensors based on plasmonic nanostructures: a review. Proc IEEE. 2016;104:2380– 408.https://doi.org/10.1109/JPROC.2016.2624340.
41. Turkevich J, Stevenson PC, Hiller J. A study of the nucleation and growth process in the synthesis of colloidal gold. Discus Faraday Soc. 1951;11:55–75.https://doi.org/10.1039/DF9511100055.
42. Khan MM, Kalathil S, Han TH, Lee J, Cho MH. Positively charged gold nanoparticles synthesized by electrochemically active biofilm - a biogenic approach. J Nanosci Nanotechnol. 2013;9:6079–85.
https://doi.org/10.1166/jnn.2013.7666.
43. Ábrahám N, Sebők D, Sz P, Kőrösi L, Dékány I. Two-dimensional arrangement of monodisperse ZnO particles with Langmuir– Blodgett technique. Colloid Surf A. 2011;384:80–9.https://doi.
org/10.1016/j.colsurfa.2011.03.025.
44. Guinier A, Fournet G. Small angle scattering of X-rays. New York:
John Wiley and Son; 1955.
45. Kanyo T, Konya Z, Berger F, Dekany I, Kiricsi I. Binary solvent mixture adsorption as a characterisation tool to determine the hydrophilic/hydrophobic properties of multiwall carbon nanotubes.
Chem Commun. 2003;7:2746–7. https://doi.org/10.1039/
b310066a.
Publisher’s note Springer Nature remains neutral with regard to jurisdic- tional claims in published maps and institutional affiliations.