1 1
Sensitive method for glycosaminoglycan analysis of tissue sections
2
3
Lilla Turiák1*, Gábor Tóth1, Oliver Ozohanics2, Ágnes Révész1, András Ács1,3, Károly Vékey1,
4
Joseph Zaia4, László Drahos1,2 5
6
1MS Proteomics Research Group, Research Centre for Natural Sciences, Hungarian Academy of 7
Sciences, Magyar tudósok körútja 2., H-1117, Budapest, Hungary 8
2MTA TTK NAP B MS Neuroproteomics Group, Hungarian Academy of Sciences, Magyar 9
tudósok körútja 2., H-1117, Budapest, Hungary 10
3Semmelweis University, PhD School of Pharmaceutical Sciences, Üllői út 26., Budapest, 11
Hungary 12
4Department of Biochemistry, Center for Biomedical Mass Spectrometry, Boston University, 13
Boston, Massachusetts 02215, United States 14
15
Corresponding author:
16
Lilla Turiák 17
Research Centre for Natural Sciences, Hungarian Academy of Sciences, 18
Magyar tudósok körútja 2., H-1117, Budapest, Hungary 19
Email: turiak.lilla@ttk.mta.hu 20
Tel: +36 1 382 6516 21
22 23 24 25
2 Abstract
26
A simple, isocratic HPLC method based on HILIC-WAX separation, has been developed for 27
analyzing sulfated disaccharides of glycosaminoglycans (GAGs). To our best knowledge, this is 28
the first successful attempt using this special phase in nano-HPLC-MS analysis. Mass 29
spectrometry was based on negative ionization, improving both sensitivity and specificity.
30
Detection limit for most sulfated disaccharides were approximately 1 fmol; quantitation limits 10 31
fmol. The method was applied for glycosaminoglycan profiling of tissue samples, using surface 32
digestion protocols. This novel combination provides sufficient sensitivity for GAG disaccharide 33
analysis, which was first performed using prostate cancer tissue microarrays. Preliminary results 34
show that GAG analysis may be useful for identifying cancer related changes in small amounts of 35
tissue samples (ca. 10 g).
36 37
Keywords: glycosaminoglycan, heparan sulfate, hydrophilic interaction chromatography, mass 38
spectrometry, prostate cancer, tissue microarray 39
40 41
3 42
1. Introduction 43
Nano-scale liquid chromatography (nano-LC) coupled to mass spectrometry (MS) is an excellent 44
technique used in routine characterization of different types of molecules (e.g. peptides[1,2], 45
glycans [3], etc.), with still growing application areas. The field of proteomics greatly benefited 46
from its constant improvements; however, a similar breakthrough is still waiting to occur in case 47
of glycomics and especially glycosaminoglycan (GAG) analysis. GAGs are an often overlooked 48
class of compounds, characterized by highly sulfated, long, linear polysaccharide chains. Their 49
characterization poses several challenges [4]. The saccharide units can be sulfated at various 50
positions and epimerization may also occur along the chain. Most GAGs are covalently attached 51
to core proteins and form proteoglycans (PGs). They are localized in the extracellular matrix, cell 52
surfaces and intercellular granules and mediate various physiological and pathophysiological 53
processes including coagulation, cancer metastasis, and inflammation [5-8]. Involvement of both 54
GAGs and PGs in cancer progression has been reported [7,9,10]. GAG chains may interact with 55
different effector proteins (e.g. chemokines, cytokines and growth factors) and thus regulate 56
processes such as tumor cell growth, metastasis, and angiogenesis [10]. Interaction between the 57
GAG chains and the effector proteins strongly depends on sulfation motifs within the chain.
58
The building blocks of GAG chains are repeating disaccharide units of a uronic acid or galactose 59
unit and an amino sugar (often abbreviated as HexA/Gal-HexNAc). GAGs are divided into four 60
different classes: hyaluronan (HA), heparan sulfate (HS)/heparin, chondroitin sulfate/dermatan 61
sulfate (CS/DS) and keratan sulfate (KS). Perhaps the most widely known group is HS, consisting 62
of a hexuronic acid (HexA) and N-acetyl glucosamine (GlcNAc) disaccharide units.
63
Analytical characterization of GAGs is usually performed after hydrolysis of the polymeric chain 64
into the constituent disaccharide units. Bacterial polysaccharide lyase enzymes can cleave the 65
glycosidic bond between the HexA and HexNAc sugars via an eliminative mechanism and produce 66
Δ4,5-unsaturated disaccharides with varying degrees of sulfation; HS disaccharides may be sulfated 67
by up to three sulfate groups. The structures, masses and nomenclature [11] of HS disaccharides 68
are summarized in Table 1. Determining the ratio of these different structures is important in 69
understanding mechanisms underlying diseases such as cancer.
70
4
Several different chromatographic techniques can be used to analyze Δ4,5-unsaturated, and 71
variously sulfated disaccharide units of HS. These include derivatization followed by reversed- 72
phase chromatography (RP) [12-17]; reversed-phase ion-pairing chromatography (RPIP) [18-20];
73
size exclusion chromatography (SEC) [21-23]; graphitized carbon [24,25]; amide-HILIC [26,27];
74
or HILIC-WAX [28] chromatography. These separation methods can be on-line coupled to mass 75
spectrometry (MS) and yield useful information about the involvement of GAGs in various 76
biochemical processes [29][30]. These analytical approaches have been reviewed recently [31].
77
The main disadvantage of the above mentioned methods is their relatively low sensitivity, which 78
is generally in the low pmol range [23,28]. Perhaps the currently most sensitive method for GAG 79
disaccharide profiling is fluorescent labelling and HPLC separation [15]. Limit of detection of this 80
method for most HS disaccharides was ca. 0.3 pmol (~0.1 ng); for the trisulfated D2S6 it was ca.
81
2 pmol (~1 ng). This sensitivity is sufficient to study bulk tissues, but is insufficient to study tissue 82
slices or tissue microarrays (TMAs). In fact, recent examples of GAG analysis as much as 1 g 83
tissue amount were required [16].
84
The main reason for developing our method was the need to have a technology capable of GAG 85
analysis of small size tissue slices. Our plan is utilizing tissue microarrays (set of 1.5 mm diameter, 86
5 m thick tissue slices arranged in array format, ca. 10 µg tissue), which provide an opportunity 87
to study relatively large number of well characterized, well matched human cancer tissue samples.
88
Target sensitivity is the low fmol range (for individual disaccharides), which is the amount 89
foreseen to be present in tissue microarray digests. To achieve this goal, special, self-packed, 90
commercially unavailable capillary columns were designed. A mixed mode resin combining 91
hydrophilic interaction (HILIC) and weak anion exchange (WAX) retention mechanisms was 92
chosen as packing material, as it enables separation of glycans based on charge, size and polarity 93
[28,32]. Use of capillary columns allows the use of on-line nano-UHPLC-MS coupling; needed to 94
achieve the necessary sensitivity. The packing material was obtained by opening a commercially 95
available analytical (2.1 mm diameter) column, and repacked into 100 µm i.d. capillaries.
96 97 98 99
5 2. Materials & Methods
100 101
2.1 Chemicals and reagents 102
The following standards and enzymes were purchased from Iduron (Cheshire, UK): unsaturated 103
heparan sulfate disaccharides, heparinase I, II and III enzymes. LC-MS grade solvents, ammonium 104
formate solution were purchased from Sigma-Aldrich (Sigma-Aldrich Kft., Budapest, Hungary).
105 106
2.2 Capillary column packing 107
A GlycanPac™ AXH-1 1.9 µm analytical column (2.1x100mm, Thermo Fisher Scientific, 108
Waltham, MA USA) was unpacked and repacked into 100 µm internal diameter capillaries using 109
a pressure injection cell (Next Advance Inc., NY, USA). For this purpose, 20-30 cm 100 µm 110
internal diameter capillaries were cut and fritted as previously reported [33]. Briefly, capillaries 111
were dipped in a solution containing Kasil® 1624, Kasil 1 and formamide in a ratio of 3:1:1. The 112
capillaries were then placed in an oven at 80 °C for 4 hours. Capillaries were examined under a 113
microscope and in case of fully porous frit the excess was trimmed to 0.5 cm in order to reduce 114
dead volume. Capillary was then placed in the pressure injection cell and was washed with 115
methanol. A 1 mg/mL suspension was prepared from the GlycanPac™ AXH-1 resin in 75%
116
Acetonitrile - 25% Methanol. The slurry was continuously vortexed using a magnetic stir bar and 117
the column was packed using nitrogen at 2000 psi. After reaching the desired length – generally 118
between 10 and 11 cm – the pressure was carefully released overnight. Due to the pressure drop 119
inhomogeneity may appear, therefore 30 minute long compression step (at 5000 psi) was necessary 120
following mounting the column on the nano-HPLC.
121 122
2.3 Liquid chromatography-mass spectrometry 123
The in-house packed capillary column was mounted on a Waters® nanoAcquity UPLC system 124
(Waters, Milford, MA, USA) coupled to a high resolution Waters® Q-Tof Premier™ Mass 125
Spectrometer (Waters, Milford, MA, USA) via nanoelectrospray ionization source. Precut silica 126
6
tips (360 µm OD, 20 µm ID, 10 µm tip ID, DNU - MS GbR, Berlin, Germany) were used as 127
emitters.
128 129
2.3.1 LC parameters 130
A flow rate of 0.6 µL/min was found to give stable signal and gave reasonable back pressure (2000 131
psi). Solvent A was 50 mM ammonium formate pH 4.4 (pH adjusted with formic acid) and solvent 132
B was 95% acetonitrile and 5% water, without any buffer. Method optimization was performed on 133
the self-packed columns using commercially available Δ4,5-unsaturated HS disaccharide standards.
134
The following isocratic methods were tested: 90%B, 85%B, 80%B, 75%B and 70% B.
135 136
2.3.2 MS parameters 137
Negative ionization mode was used. Correct tuning of MS parameters is critical when analyzing 138
labile molecules such as sulfated sugars. The instrument was tuned by direct infusing the most 139
labile triply sulfated heparan sulfate disaccharide (D2S6). Decreasing the cone voltage to 15 eV 140
from the generally used 35 eV resulted in minimal (<5%) sulfate loss. Extraction cone voltage was 141
also lowered to 1 V. MS data was acquired in the m/z 180-800 mass range.
142 143
2.4 Enzymatic digestion of TMA cores 144
Prostate cancer tissue microarrays T191a and T196 were obtained from US Biomax, Inc.
145
(Derwood, MD, USA). Tissue sections were processed (dewaxing and antigen retrieval) as 146
previously described [34]. TMA cores corresponding to normal (healthy prostate tissue, male, 33 147
years), grade 1 (adenocarcinoma, male, 72 years) and grade 2-3 (adenocarcinoma, male, 60 years) 148
cancer were chosen for the current analysis. In case of each patient the TMA contained 3 cores/case 149
allowing to assess the reproducibility of the developed method. Heparinase I, II and III digestion 150
was performed on the surface of the TMA cores as previously described [34]. Following 5 cycles 151
of enzyme addition (40 min 37 °C incubation/cycle) two additional cycles were carried out by 152
pipetting the enzyme solution without the enzymes to ensure completion of the enzymatic 153
7
digestion process. The HS disaccharides were extracted from the individual cores using 0.3%
154
ammonium-hydroxide solution, dried down and re-suspended in the LC starting conditions.
155
During the experiments a quality control sample followed by two blank injections was ran before 156
the tissue microarray samples.
157 158
2.5 Data analysis 159
Data acquisition was controlled by MassLynx, quantitative results were evaluated by QuanLynx 160
software (Waters, Milford, MA). Non-supervised PCA analysis was performed by XLStat 161
software (Addinsoft, New York, USA).
162 163
8 164
3. Results & discussion 165
Detection of both neutral and highly acidic disaccharides by mass spectrometry presents a 166
challenge; initial trials showed that negative electrospray ionization provides the best sensitivity.
167
High mass resolution was needed to improve selectivity of disaccharide analysis as extracts of 168
tissue surface digestion contain a large amount of impurities, the target disaccharides being minor 169
components only. Sulfated disaccharides fragment easily in the mass spectrometer ion source 170
under conventional conditions, compromising analysis. In order to avoid this problem ion source 171
conditions have to be specially tuned. The most critical parameter is the cone voltage, which, in 172
our instrument, had to be reduced from the conventionally used 30-35 eV to as low as 15 eV.
173
Based on the literature [28] we have selected a mixed mode HILIC-WAX stationary phase, which 174
was shown to be efficient for analysis of acidic oligosaccharides [32]. Capillary columns were 175
packed in-house with this packing material. We have used medium ion strength ammonium 176
formate buffer and acetonitrile solvents. Method development was carried out using commercially 177
available standards with the goal of analyzing small amounts of tissue digests (tissue microarrays) 178
containing disaccharides in the low fmol range.
179
Initial trials using gradient elution showed that mass spectrometry sensitivity significantly changes 180
with solvent composition; as a result, the late-eluting doubly and triply sulfated disaccharides had 181
the lowest sensitivity among those tested. For example, in equimolar mixtures the signal intensity 182
for the trisulfated HS disaccharide was 30 times less than those of the neutral or the monosulfated 183
disaccharides, due to changes in solvent composition. For this reason, we have decided to develop 184
an isocratic elution method.
185 186
3.1 Method optimization 187
First, the required ion strength of the strong eluent was established. It was found that the method 188
is very sensitive to the salt concentration: sulfated (especially highly sulfated) disaccharides do not 189
elute from the column neither at lower (10-40 mM) nor at higher (80 mM) ammonium formate 190
concentration. Medium ion strength (50 mM ammonium formate) resulted in a reasonable 191
9
chromatogram; and this was used in the following. The next step was the adjustment of the pH of 192
the buffer, using formic acid. We tested pH values of 4.0, 4.4 and 4.6, respectively. At pH 4.0 193
resolution of monosulfated, at pH 4.6 resolution of disulfated disaccharides were unsatisfactory.
194
The best results were achieved at pH 4.4 for which it was possible to detect and resolve the HS 195
disaccharides according to composition.
196
Subsequently we evaluated five different isocratic conditions (90% B, 85% B, 80%B, 75%B and 197
70% B, Fig.1). Note, Fig. 1 shows the sum of the peak intensities (sum of selected ion 198
chromatograms at high resolution) of the HS disaccharides. When the eluent contained a high 199
percentage of acetonitrile (90 and 85% B) the corresponding peaks were broad and shallow (Fig.
200
1E and Fig. 1D) for the highly sulfated structures and the triply sulfated disaccharide did not elute 201
within 15 minutes. In case of 75% and 70% B partial co-elution of various peaks was observed 202
(Fig. 1A and Fig. 1B). The isocratic method at 80% B was optimal (Fig. 1C) because it resolved 203
the HS disaccharides based on composition; peak shapes were symmetric, and all peaks eluted 204
within 15 minutes. Individual selected ion chromatograms of the HS disaccharides are shown in 205
Fig. 2. This isocratic method ameliorated the problem of low signal intensity for the triply sulfated 206
HS. The main reason was that using gradient separation water and buffer concentration is increased 207
at the elution of the triply sulfated disaccharide. Under such conditions the MS sensitivity 208
decreases, resulting in low sensitivity for the highly sulfated derivatives. Note that D2S6 (the triply 209
sulfated derivative) elutes in a fairly wide peak. This is due to the highly polar nature of this 210
compound, which binds strongly to the HILIC-WAX resin.
211
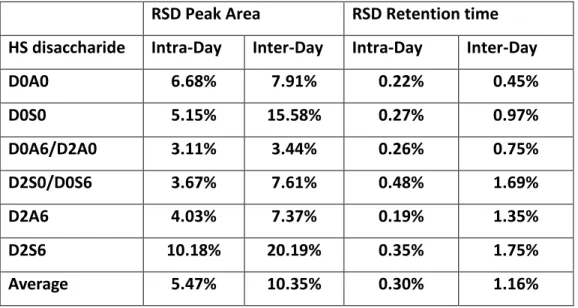
We have determined the repeatability of analysis as well (Table 2). For the 500 fmol sample 212
mixture intra-day repeatability of relative peak areas was 5% on average; inter-day repeatability 213
was 10% (relative standard deviation; 5 measurements in a day, measured on 3 different days).
214
Repeatability (relative standard deviation) of retention times was, on average 0.3% within a day, 215
and 1.2% between days.
216 217
3.2 Linearity studies 218
We also demonstrated the linearity (Fig. 3 and Supplementary material Fig. S1) of signal intensity 219
with increasing sample amount, and the limits of quantitation. The following concentrations of HS 220
10
disaccharide mixtures were tested with 80% B isocratic method: 10 fmol, 20 fmol, 50 fmol, 100 221
fmol, 200 fmol, 500 fmol and 1000 fmol. As 1 L sample volume was injected always, these 222
sample amounts correspond to 10, 20, 50, 100 200, 500 and 1000 pmol/mL concentrations. Each 223
concentration was measured in triplicate. For the mono and disulfated components at 10 fmol 224
injection the signal-to-noise ratio was greater than 20:1 (indicating that the limit of quantitation 225
(LOQ, defined as S/N>10) is slightly better than 10 fmol). We estimate the limit of detection for 226
these components (S/N>3) to be approximately 1 fmol. For the non-sulfated D0A0 disaccharide, 227
the detection limit was ca. 10 fmol (due to interference from an abundant background ion at a 228
similar mass and retention time). The quantitation limit was ca. 20 fmol in this case. The trisulfated 229
compound gave very low signal intensity at low concentration, detection limit was ca. 20 fmol, 230
and quantitation limit was 50 fmol. We evaluated linearity of peak areas over a 10-1000 fmol range 231
that is appropriate for biological samples. Excellent linearity was observed for four disaccharides 232
in the 10-1000 fmol range (Fig. 3B, Fig. 3C, Fig. 3D and Fig. 3E), with an R2 value > 0.99 for 233
each. The non-sulfated D0A0 disaccharide was measured in the 20-1000 fmol range (Fig. 3A), the 234
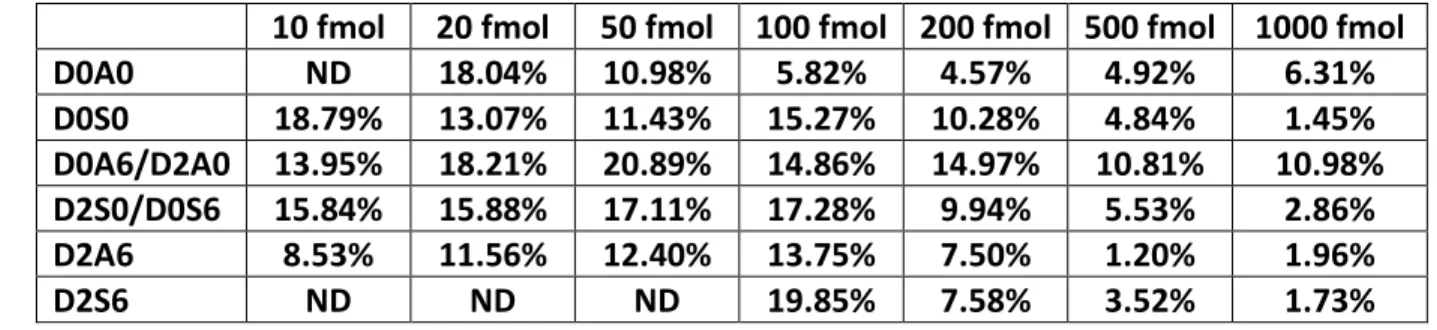
trisulfated HS in the 50-500 fmol range (Fig. 3F), both with R2>0.99 linearity. Average standard 235
deviation of the HS disaccharides, as expected, decreased with increasing concentration of the 236
standard mixture (Table 3). Average standard deviations were found to be 4.2% for the 1000 fmol 237
mixture and 14% for the 100 fmol mixture. The present experiments do not distinguish the 238
positional isomers (D2A0/D0A6 and D2S0/D0S6). We have checked, that the ionization 239
efficiencies of the two isomer pairs are within 15%; well within the intended accuracy of the 240
present study. For this reason, quantitation will determine the sum of the two positional isomers.
241
Relative sensitivity of the isomers is shown in Supplementary material Table S1.
242 243
3.3 Analysis of tissue microarrays 244
The next phase of method development was establishing, whether the method developed on 245
standards would be suitable for analyzing small amounts of biological material. As test examples 246
we have chosen tissue microarrays (TMA), which are gaining importance in biomedical 247
workflows; the main challenge being the limited sample amount (1.5 mm diameter, 5 m thin 248
cores). Sample amount in such cores is sufficient for proteomics workflows based on nanoLC-MS 249
methodologies. TMA cores were digested using heparinase enzymes on their surface (see details 250
11
in the Materials & Methods section), yielding Δ4,5-unsaturated HS disaccharides. The digestion 251
products were pipetted off the cores, and analyzed by the LC-MS method described above.
252
Selected example chromatograms are shown in Fig. 4 for a grade 2-3 prostate cancer TMA cores.
253
Based on the calibration curve obtained using the standards it was possible to estimate the amount 254
of the extracted disaccharides (Fig. 4).
255
In this study TMA sections were analyzed corresponding to prostate tissue biopsy from one healthy 256
individual, one grade 1 and one grade 2-3 patient, respectively. Three serial biopsies were analyzed 257
for each TMA sample. We observed the 4 most abundant disaccharides in these samples. Among 258
these, one doubly sulfated and the triply sulfated disaccharide were not detected. Approximate 259
quantitation based on Fig. 3 indicated that the most abundant component is the non-sulfated D0A0 260
disaccharide being in the 20-80 fmol range in the various samples. The big peak in the D0A0 ion 261
chromatogram, before the sample at Rt=3.5-6.5 min is coming from the background. This does not 262
interfere with detecting and quantifying D0A0. The two mono-sulfated components are present in 263
comparable amounts; 10-40 fmol in the case of D0S0 and 5-20 fmol in the case of D0A6/D2A0.
264
Among the higher sulfated components only the disulfated D2S0/D0S6 HS disaccharide was 265
observed in each case, but only in low amounts (less than 10 fmol).
266
Three biological samples were analyzed in triplicates. The results showed an increased abundance 267
in cancer of the mono-sulfated D0S0 and the D0A6/D2A0 components (Fig. 5).
268 269
12 270
4. Conclusion 271
We demonstrated that sulfated HS disaccharides can be advantageously studied using LC-MS with 272
isocratic nano-chromatography conditions. Isocratic elution is advantageous for mass 273
spectrometry analysis, as ion spray conditions and sensitivity issues do not complicate analysis. It 274
is of particular importance in those cases, when the analyte has unfavorable MS characteristics.
275
Using a combination of nano-HPLC and negative ionization, we detected HS disaccharides in the 276
low fmol range.
277
We used the technique to analyze HS in tissue slices, using digestion directly on the tissue surface.
278
Both sensitivity and specificity were sufficient to analyze small, ca. 2 mm2 size areas on the tissue 279
surface, opening up the possibility of studying tissue microarrays. We expect that this will allow 280
systematic studies of human disease biospecimens. In the present paper, as an illustrative example, 281
we studied TMA of healthy, grade 1 and grade 2-3 prostate tissue biopsies. These pilot studies 282
demonstrated the ability to differentiate the biospecimens based on HS disaccharide abundances.
283
This is consistent with known roles of HS proteoglycans in dysregulation of receptor tyrosine 284
kinase signaling in cancer phenotypes [35-37]. In the future studies, we will extend to analyze 285
GAGs from a large number of TMA cores, in order to build statistically relevant models correlating 286
with disease progression.
287 288
Acknowledgments 289
Lilla Turiák acknowledges support of the National Research Development and Innovation Office 290
(OTKA PD 121187); Lilla Turiák and Ágnes Révész the János Bolyai Research Scholarship of 291
the Hungarian Academy of Sciences.
292 293
Appendix A. Supplementary data 294
Figure S1. Linearity of the method (log-log plot), calibration curves for the individual HS 295
disaccharide standards: D0A0 (A), D0S0 (B), D0A6/D2A0 (C), D2S0/D0S6 (D), 296
13
D2A6 (E), and D2S6 (F). Excellent linearity was observed for four disaccharides 297
(B, C, D and E) in the 10-1000 fmol range with an R2 value > 0.99 for each. The 298
non-sulfated disaccharide D0A0 (A) was measured in the 20-1000 fmol range, the 299
trisulfated HS (F) in the 50-500 fmol range, both with R2>0.99 linearity.
300 301
Table S1. Signal intensities of D0A6, D2A0, D2S0 and D0S6, and relative sensitivity of the 302
D0A6/D2A0 and D0S6/D2S0 isomer pairs. Data were measured using direct 303
infusion of the individual isomers in 20%A and 80%B eluent mixture, under the 304
same mass spectrometric tuning, as in the LC-MS studies described. Values are 305
given as the sum of singly and doubly deprotonated ion counts. Concentration of 306
the standards were 5 µM.
307 308
14 309
HS disaccharide structure Traditional name Lawrence code [11]
m/z in negative
mode
ΔHexA-GlcNAc D0A0 378.1
ΔHexA2S-GlcNAc D2A0 458.1
ΔHexA-GlcNAc6S D0A6 458.1
ΔHex-GlcNS D0S0 416.1
ΔHexA2S-GlcNAc6S D2A6 538.1
ΔHexA2S-GlcNS D2S0 496.1
ΔHex-GlcNS6S D0S6 496.1
ΔHexA2S-GlcNS6S D2S6 576.1
310
Table 1. Structure and nomenclature of the most common unsaturated HS disaccharides 311
obtained following heparin lyases digestion. Note, that D2A0/D0A6 and 312
D2S0/D0S6 are positional isomers and are not distinguished in the present study.
313
15 314
RSD Peak Area RSD Retention time HS disaccharide Intra-Day Inter-Day Intra-Day Inter-Day
D0A0 6.68% 7.91% 0.22% 0.45%
D0S0 5.15% 15.58% 0.27% 0.97%
D0A6/D2A0 3.11% 3.44% 0.26% 0.75%
D2S0/D0S6 3.67% 7.61% 0.48% 1.69%
D2A6 4.03% 7.37% 0.19% 1.35%
D2S6 10.18% 20.19% 0.35% 1.75%
Average 5.47% 10.35% 0.30% 1.16%
315
Table 2. Repeatability of analysis. Intra-Day and Inter-Day relative standard deviation of 316
peak areas and retention times for the unsaturated HS disaccharides.
317 318
16
10 fmol 20 fmol 50 fmol 100 fmol 200 fmol 500 fmol 1000 fmol D0A0 ND 18.04% 10.98% 5.82% 4.57% 4.92% 6.31%
D0S0 18.79% 13.07% 11.43% 15.27% 10.28% 4.84% 1.45%
D0A6/D2A0 13.95% 18.21% 20.89% 14.86% 14.97% 10.81% 10.98%
D2S0/D0S6 15.84% 15.88% 17.11% 17.28% 9.94% 5.53% 2.86%
D2A6 8.53% 11.56% 12.40% 13.75% 7.50% 1.20% 1.96%
D2S6 ND ND ND 19.85% 7.58% 3.52% 1.73%
319
Table 3. Relative standard deviation of peak areas for the unsaturated HS disaccharides at 320
different concentrations measured in triplicates 321
322
17 323
List of Figures 324
Figure 1. Sum of selected ion chromatograms of 500 fmol heparan sulfate disaccharide 325
standards (D0A0, D0S0, D0A6, D2A0, D2A6, D2S0, D0S6 and D2S6) on an in- 326
house packed 100 µm i.d. capillary column packed with 1.9 µm particle size 327
GlycanPac™ AXH-1 resin using the following isocratic methods: 70% B (A), 75%
328
B (B), 80% B (C), 85% B (D), 90% B (E). Note, that D2A0/D0A6 and D2S0/D0S6 329
are positional isomers.
330
Figure 2. Extracted ion chromatograms of 500 fmol heparan sulfate disaccharide standards 331
(D0A0, D0S0, D0A6/D2A0, D2A6, D2S0/D0S6 and D2S6) on an in-house packed 332
100 µm i.d. capillary column packed with 1.9 µm particle size GlycanPac™ AXH- 333
1 resin using isocratic separation (80% B).
334
Figure 3. Linearity of the method, calibration curves for the individual HS disaccharide 335
standards: D0A0 (A), D0S0 (B), D0A6/D2A0 (C), D2S0/D0S6 (D), D2A6 (E), and 336
D2S6 (F). Excellent linearity was observed for four disaccharides (B, C, D and E) 337
in the 10-1000 fmol range with an R2 value > 0.99 for each. The non-sulfated 338
disaccharide D0A0 (A) was measured in the 20-1000 fmol range, the trisulfated HS 339
(F) in the 50-500 fmol range, both with R2>0.99 linearity.
340
Figure 4. Extracted ion chromatograms of heparan sulfate disaccharides extracted from the 341
surface of a grade 2-3 prostate cancer tissue microarray core following on surface 342
heparinase I, II, III digestion. The amount of the extracted disaccharides were 343
estimated based on the calibration curve obtained using the standards.
344
Figure 5. Average amount of various GAG related HS disaccharides in normal, grade 1 and 345
grade 2-3 prostate cancer TMA cores. The error bars represent standard deviation 346
of the method.
347
References 348
[1] Choi YS. Reaching for the deep proteome: Recent nano liquid chromatography coupled with tandem 349
mass spectrometry-based studies on the deep proteome. Arch Pharm Res, 35 (2012) 1861-1870.
350
18
[2] Wilson SR, Vehus T, Berg HS, Lundanes E. Nano-LC in proteomics: recent advances and approaches.
351
Bioanalysis, 7 (2015) 1799-1815.
352
[3] Hua S, Lebrilla C, An HJ. Application of nano-LC-based glycomics towards biomarker discovery.
353
Bioanalysis, 3 (2011) 2573-2585.
354
[4] Zaia J. Principles of mass spectrometry of glycosaminoglycans. Journal of Biomacromolecular Mass 355
Spectrometry, 1 (2005) 3-36.
356
[5] Berretta S. Extracellular matrix abnormalities in schizophrenia. Neuropharmacology, 62 (2012) 1584- 357
1597.
358
[6] Ariga T, Miyatake T, Yu RK. Role of Proteoglycans and Glycosaminoglycans in the Pathogenesis of 359
Alzheimer's Disease and Related Disorders: Amyloidogenesis and Therapeutic Strategies-A 360
Review. J Neurosci Res, 88 (2010) 2303-2315.
361
[7] Binder MJ, McCoombe S, Williams ED, McCulloch DR, Ward AC. The extracellular matrix in cancer 362
progression: Role of hyalectan proteoglycans and ADAMTS enzymes. Cancer Lett, 385 (2017) 55- 363
64.
364
[8] Gill S, Wight TN, Frevert CW. Proteoglycans: Key Regulators of Pulmonary Inflammation and the 365
Innate Immune Response to Lung Infection. Anatomical Record-Advances in Integrative 366
Anatomy and Evolutionary Biology, 293 (2010) 968-981.
367
[9] Yip GW, Smollich M, Goette M. Therapeutic value of glycosaminoglycans in cancer. Mol Cancer Ther, 368
5 (2006) 2139-2148.
369
[10] Sanderson RD, Yang Y, Purushothaman A, Khotskaya YB, Ritchie JP, et al., Proteoglycans and Cancer, 370
in: Zent R, Pozzi A (Eds.), Cell-Extracellular Matrix Interactions in Cancer, Springer-Verlag, New 371
York, 2010, pp. 191-215.
372
[11] Lawrence R, Lu H, Rosenberg RD, Esko JD, Zhang L. Disaccharide structure code for the easy 373
representation of constituent oligosaccharides from glycosaminoglycans. Nat Methods, 5 (2008) 374
291-292.
375
[12] Ramsay SL, Meikle PJ, Hopwood JJ. Determination of monosaccharides and disaccharides in 376
mucopolysaccharidoses patients by electrospray ionisation mass spectrometry. Mol Genet 377
Metab, 78 (2003) 193-204.
378
[13] Galeotti F, Volpi N. Online Reverse Phase-High-Performance Liquid Chromatography-Fluorescence 379
Detection-Electrospray Ionization-Mass Spectrometry Separation and Characterization of 380
Heparan Sulfate, Heparin, and Low-Molecular Weight-Heparin Disaccharides Derivatized with 2- 381
Aminoacridone. Anal Chem, 83 (2011) 6770-6777.
382
[14] Volpi N, Galeotti F, Yang B, Linhardt RJ. Analysis of glycosaminoglycan-derived, precolumn, 2- 383
aminoacridone-labeled disaccharides with LC-fluorescence and LC-MS detection. Nat Protoc, 9 384
(2014) 541-558.
385
[15] Yang B, Chang Y, Weyers AM, Sterner E, Linhardt RJ. Disaccharide analysis of glycosaminoglycan 386
mixtures by ultra-high-performance liquid chromatography-mass spectrometry. J Chromatogr A, 387
1225 (2012) 91-98.
388
[16] Shrikanth CB, Sanjana J, Chilkunda ND. One-pot analysis of sulfated glycosaminoglycans. Glycoconj 389
J, (2017).
390
[17] Pan Y, Wang P, Zhang F, Yu Y, Zhang X, et al. Glycosaminoglycans from fish swim bladder: isolation, 391
structural characterization and bioactive potential. Glycoconj J, (2017).
392
[18] Yang B, Weyers A, Baik JY, Sterner E, Sharfstein S, et al. Ultra-performance ion-pairing liquid 393
chromatography with on-line electrospray ion trap mass spectrometry for heparin disaccharide 394
analysis. Anal Biochem, 415 (2011) 59-66.
395
[19] Wang B, Buhse LF, Al-Hakim A, Ii MTB, Keire DA. Characterization of currently marketed heparin 396
products: Analysis of heparin digests by RPIP-UHPLC-QTOF-MS. J Pharmaceut Biomed, 67-68 397
(2012) 42-50.
398
19
[20] Zhang ZQ, Xie J, Liu HY, Liu J, Linhardt RJ. Quantification of Heparan Sulfate Disaccharides Using Ion- 399
Pairing Reversed-Phase Microflow High-Performance Liquid Chromatography with Electrospray 400
Ionization Trap Mass Spectrometry. Anal Chem, 81 (2009) 4349-4355.
401
[21] Hitchcock AM, Costello CE, Zaia J. Glycoform quantification of chondroitin/dermatan sulfate using a 402
liquid chromatography-tandem mass spectrometry platform. Biochemistry, 45 (2006) 2350- 403
2361.
404
[22] Shi XF, Zaia J. Organ-specific Heparan Sulfate Structural Phenotypes. J Biol Chem, 284 (2009) 11806- 405
11814.
406
[23] Shao C, Shi X, Phillips JJ, Zaia J. Mass spectral profiling of glycosaminoglycans from histological tissue 407
surfaces. Anal Chem, 85 (2013) 10984-10991.
408
[24] Barroso B, Didraga M, Bischoff R. Analysis of proteoglycans derived sulphated disaccharides by 409
liquid chromatography/mass spectrometry. J Chromatogr A, 1080 (2005) 43-48.
410
[25] Karlsson NG, Schulz BL, Packer NH, Whitelock JM. Use of graphitised carbon negative ion LC-MS to 411
analyse enzymatically digested glycosaminoglycans. J Chromatogr B, 824 (2005) 139-147.
412
[26] Takegawa Y, Araki K, Fujitani N, Furukawa J, Sugiyama H, et al. Simultaneous Analysis of Heparan 413
Sulfate, Chondroitin/Dermatan Sulfates, and Hyaluronan Disaccharides by Glycoblotting- 414
Assisted Sample Preparation Followed by Single-Step Zwitter-Ionic-Hydrophilic Interaction 415
Chromatography. Anal Chem, 83 (2011) 9443-9449.
416
[27] Gill VL, Aich U, Rao S, Pohl C, Zaia J. Disaccharide Analysis of Glycosaminoglycans Using Hydrophilic 417
Interaction Chromatography and Mass Spectrometry. Anal Chem, 85 (2013) 1138-1145.
418
[28] Chen JH, Kawamura T, Sethi MK, Zaia J, Repunte-Canonigo V, et al. Heparan sulfate: Resilience 419
factor and therapeutic target for cocaine abuse. Sci Rep, 7 (2017).
420
[29] Ucakturk E, Akman O, Sun XJ, Baydar DE, Dolgun A, et al. Changes in composition and sulfation 421
patterns of glycoaminoglycans in renal cell carcinoma. Glycoconjugate J, 33 (2016) 103-112.
422
[30] Bruinsma IB, Riet LT, Gevers T, ten Dam GB, van Kuppevelt TH, et al. Sulfation of heparan sulfate 423
associated with amyloid-beta plaques in patients with Alzheimer's disease. Acta Neuropathol, 424
119 (2010) 211-220.
425
[31] Zaia J. Glycosaminoglycan Glycomics Using Mass Spectrometry. Mol Cell Prot, 12 (2013) 885-892.
426
[32] Aich U, Saba J, Liu X, Pohl C. Structural Analysis of Native N-Glycans Released from Proteins Using a 427
Novel Mixed-Mode Column and a Hybrid Quadrupole-Orbitrap Mass Spectrometer. Thermo 428
Fisher Scientific Application Note 20827.
429
[33] Maiolica A, Borsotti D, Rappsilber J. Self-made frits for nanoscale columns in proteomics.
430
Proteomics, 5 (2005) 3847-3850.
431
[34] Turiak L, Shao C, Meng L, Khatri K, Leymarie N, et al. Workflow for Combined Proteomics and 432
Glycomics Profiling from Histological Tissues. Anal Chem, 86 (2014) 9670-9678.
433
[35] Mundhenke C, Meyer K, Drew S, Friedl A. Heparan sulfate proteoglycans as regulators of fibroblast 434
growth factor-2 receptor binding in breast carcinomas. Am J Pathol, 160 (2002) 185-194.
435
[36] Kwabi-Addo B, Ozen M, Ittmann M. The role of fibroblast growth factors and their receptors in 436
prostate cancer. Endocrine-Related Cancer, 11 (2004) 709-724.
437
[37] Afratis N, Gialeli C, Nikitovic D, Tsegenidis T, Karousou E, et al. Glycosaminoglycans: key players in 438
cancer cell biology and treatment. FEBS J, 279 (2012) 1177-1197.
439 440 441