Bioresource Technology 333 (2021) 125223
Available online 27 April 2021
0960-8524/© 2021 University of Szeged. Published by Elsevier Ltd. This is an open access article under the CC BY license
(http://creativecommons.org/licenses/by/4.0/).
Methane production from green and woody biomass using short rotation willow genotypes for bioenergy generation
Bal ´ azs Kakuk
a,b, Zolt ´ an Bagi
b, G ´ abor R ´ akhely
b,d, Gergely Mar oti ´
c, D ´ enes Dudits
c,*, Korn ´ el L. Kov ´ acs
b,e,*aDepartment of Medical Biology, University of Szeged, Hungary
bDepartment of Biotechnology, University of Szeged, Hungary
cInstitute of Plant Biology, Biological Research Center, Szeged, Hungary
dEnvironmental Research Institute, University of Szeged, Szeged, Hungary
eDepartment of Oral Biology and Experimental Dental Research, University of Szeged, Szeged, Hungary
H I G H L I G H T S G R A P H I C A L A B S T R A C T
•Use of green willow biomass (GWB) for biogas fermentation for energy production.
•Depending on vegetation period, GWB can be superior methane source than woody tissues.
•Willow genotype dependence of biogas fermentation efficiency demonstrated.
•Biogas energy productivity in terms of unit area can surpass maize silage.
A R T I C L E I N F O Keywords:
Biogas
Anaerobic Digestion Energy Crops Willow Green Biomass
A B S T R A C T
Short rotation plantations of willow genotypes, harvested in vegetative growth phases, were tested as an alternative biomass for methane production. The substrate characteristics, maximal methane yields (K) and highest methane production rates (µmax) were determined. Leaves and stems from diploid Energo (EN) and tetraploid (PP) plants, harvested in June were superior methane sources to woody tissue. This could be related to the lower lignin contents in green willow. Fermentation of pooled biomasses from tetraploid genotypes harvested in June-August was more efficient than methane production from diploid tissues. Microbial community analyses by 16S rRNA genes showed a dominance of the order Clostridiales. In field study, based on Energo plantation, the maximum in green biomass accumulation was in early month 9 of the vegetation period. A theoretical calcu- lation showed similar or better energy potential per unit area for willow than in the case of maize silage. This study encourages the use of green willow biomass as feedstock in biomethanation processes due to its relatively low production costs and uncomplicated agricultural practice.
* Corresponding authors at: Department of Biotechnology, University of Szeged, Hungary (K.L. Kov´acs), Institute of Plant Biology, Biological Research Center, Szeged, Hungary (D. Dudits).
E-mail addresses: dudits.denes@brc.hu (D. Dudits), kovacs.kornel@bio.u-szeged.hu (K.L. Kov´acs).
Contents lists available at ScienceDirect
Bioresource Technology
journal homepage: www.elsevier.com/locate/biortech
https://doi.org/10.1016/j.biortech.2021.125223
Received 18 February 2021; Received in revised form 21 April 2021; Accepted 22 April 2021
1. Introduction
Concerns over climate change and energy security urge the increase of biomass use for sustainable heat and biofuel production. Biogas is versatile among renewable energy carriers as it can be stored and transported easily and after upgrading the resulting biomethane is exploited in essentially every way fossil natural gas is utilized today (Wagner et al., 2018). The biogas industry is growing dynamically worldwide accompanied with increasing concern about supplying the anaerobic digestion (AD) reactors with first generation biomasses, i.e.
energy plants cultivated on agricultural land (Kalamaras and Kotso- poulos, 2014), such as maize silage (Purdy et al., 2017; Wagner et al., 2018). The cultivation cost of maize silage and similar crops is relatively high, and the fertile agricultural lands should be used for food and feed production. Intensive search is in progress to switch biogas production towards second-generation, alternative substrates that do not come into conflict with crops that could serve human or animal nutritional pur- poses (food vs. energy debate) (Brethauer and Studer, 2015; Clifton- Brown et al., 2019). The process of anaerobic digestion is carried out by a complex microbial community, whose composition is highly dependent on the substrate it degrades (Campanaro et al., 2018).
Valuable insights can be drawn by analyzing this community via high- throughput 16S rRNA gene amplicon sequencing, linking the bacterial and archaeal structures of AD microbial communities to feed substrates and process parameters (Kougias et al., 2018).
Shrub willow (Salix spp.) can be cultivated as short-rotation coppice (SRC willow, SRCW) for the efficient production of biomass to produce bioenergy and bioproducts, with environmental and rural development benefits (Clifton-Brown et al., 2019; Fischer et al., 2005; Volk et al., 2016). These benefits are as follows: a.) it can be cultivated on marginal lands; b.) it is perennial, therefore in current practice its woody stems are harvested in every 2–4 years (after a cutback in the first year) without needing replantation up to 7–10 harvesting cycles, which makes the plantation exploitable for over 15–20 years; c.) it is capable of car- bon sequestration; d.) the net energy ratio, i.e., the ratio of energy gained over energy invested is in the range of 18:1 to 43:1 (Caputo et al., 2014); e.) it is more resistant to environmental effects and stresses, en- dures contaminated soils, making it suitable for phytoremediation (Dimitriou et al., 2012; Janssen et al., 2015); g.) it has positive effects on species diversity (Cunniff and Cerasuolo, 2011; Volk et al., 2018); h.) it can be coupled with N-removal, as willow plants reduce soil-water ni- trate-nitrogen concentrations by 40–80% (Ferrarini et al., 2017; Ssegane et al., 2016); i.) its cultivation is considerably less labor-demanding and costs less than that of sensitive herbaceous plants, and less prone to yield fluctuations (Caputo et al., 2014; Eisenbies et al., 2014).
Novel variants are being constantly developed and being utilized for bioenergy production mainly in the US, Canada, UK, Sweden (Clifton- Brown et al., 2019; Fabio et al., 2017) and Poland (Stolarski et al., 2019), though other Eastern-European and former Soviet Union coun- tries also have a high biological energy potential (Fischer et al., 2005), including SRC willow (also poplar and Miscanthus). For example, in Latvia, Hungary and Lithuania this potential is the highest: more than 175 GJ/person. The main breeding approach to improve willow wood biomass yields relies on species breeding to capture hybrid vigour (Fabio et al., 2017; Serapiglia et al., 2014). Dudits et al. (2016) managed to duplicate the chromosome number of the Energo (EN) cultivar via a colchicine treatment, resulting in autotetraploid genotypes named Poli Plus (PP). The multiplied genome size increased leaf size, shoot diameter and root system, as well as it improved photosynthetic activity and hormone composition.
Within a usual current scenario, the ~3-year-old ‘woody’ SRCW biomass is chipped and incinerated in biomass boilers to generate heat and/or electricity. Few attempts used it as biogas substrate: willow saw- dust (WSD) was shown to be an appropriate AD substrate, particularly if combined with various pretreatment methods (Alexandropoulou et al., 2017). The primarily aim of pretreatments was to partially deconstruct
lignocellulose (Patinvoh et al., 2017), and lower its lignin content (Mulat et al., 2018; van der Lelie et al., 2012). Higher lignin content is desirable for combustion purposes but not for biofuel production (Tubeileh et al., 2016). The amount of lignin correlated negatively with CH4 yields (Herrmann et al., 2016) in most crop species. Due to the recalcitrant properties of lignocelluloses, the hydraulic retention time (HRT) is increased and thus a lower organic loading rate (OLR), and also a high amount of dilution water has to be used, which makes their fermentation economically less feasible. These reasons limit the utili- zation of WSD, willow wood chips, or other woody biomass in industrial biogas plants.
In the present project it was hypothesized that a possible, more favorable alternative for the utilization of SRC willow could be to har- vest the biomass while it is still in its ‘green’ form, termed as green willow biomass (GWB), i.e., less than one year old shrub. This is the first study to investigate the suitability of GWB as biogas substrate, therefore the aim was to assess the characteristics of this novel biomass source for AD. Analyses of fermentation efficiency, based on parameters as maximal CH4 yields (K) and highest CH4 production rates (µmax), allow rigorous comparison between woody willow biomass (WWB) and GWB as renewable energy feedstocks. The findings help optimizing the GWB- based technology by using different genotypes, harvesting time, different lignocellulose composition and anaerobic microbial commu- nity. In addition to the laboratory experiments, the green biomass yield (t/ha) was calculated on the basis of a small field experiment for com- parison to alternative feedstocks. According to these calculations the energy potential (GJ/ha) of GWB can be higher than that of maize.
2. Materials and methods
2.1 Characterization of the substrates and digester sludges
Experimental plantation of Salix viminalis diploid Energo (EN) cultivar and its tetraploid PoliPlus (PP) forms (Dudits et al., 2016) was established in Szeged, Hungary. Each plots contained 100 plants, and the one year-old shoots were harvested in June, August and October during year of the 2018. An early harvest in May was used for biomass productivity estimation only. Stems’ length, diameter and mass were measured before separation from leaves and stems were cut into pieces of about 10 cm. The weights of leaves per plants were also measured.
The measurements of TS (total solids) and oTS (organic total solids) for stem and leaves were carried out on the fresh samples according to standards. Samples were stored at − 20 ◦C until further use.
2.2. Batch anaerobic digestions
Triplicate batch digesters were assembled for each combination of substrates with a substrate-inoculum ratio (S/I) of 0.5, a reaction tem- perature set to 37 ◦C. Inoculum for the standard biochemical methane potential (BMP) tests came from the industrial CSTR biogas facility of Z¨oldforr´as Ltd., (Szeged, Hungary), which was fed with a mixture of pig slurry and maize and sweet sorghum silage at 37 ◦C. The batch experi- ments were carried out in 160 mL glass reactors in triplicates. Substrate concentration, the amount of inoculum and diluting water were calcu- lated according to VDI 4630 protocol (see Kakuk et al., 2017). The fermentation volume was 60 mL, leaving a headspace of 100 mL. The reactors were flushed with N2 to ensure anaerobic conditions and were sealed with butyl rubber stoppers and aluminum caps. Negative controls were included, in which only the inoculum was used, to determine the endogenous methane production, which was subtracted from the net methane produced. BMP values were calculated by dividing the total methane yields with the input substrate VS (mL CH4/g VS). The fer- menters were not stirred, but were shaken manually each day before the chromatography measurement. Experiments were carried out for 45 days, the gas volume and the content of methane (Kakuk et al., 2017) were monitored every day during the first week, and then every second
or third day thereafter, until the end of the experiment. The modified Gompertz equation (Tjørve and Tjørve, 2017) was fitted to the actual measurements by using in-house developed R scripts with the growth rates R package (Petzoldt, 2018). The estimated BMPs (K-value, mL CH4/g VS) and maximal production rates (µmax, mL CH4/g VS/day) were derived from the fitted models.
2.3. Gas chromatography (GC) analysis
The CH4 content was measured daily with Agilent 6890 N gas chromatograph (Agilent Technologies, Santa Clara, United States). The GC was equipped with HP Molesive 5 Å column (length 30 m, I.D. 0.53 megabore, film 25 µm) and thermal conductivity detector. The carrier gas was argon 5.0 (Linde Group Hungary, Budapest, Hungary) set at a flow rate of 16.8 mL/min. Split injection mode was applied (0.2:1), the injector temperature was 150 ◦C. After each sampling and measurement, the headspaces of the fermenters were flushed with nitrogen gas (Messer Group, Bad Soden, Germany) for 10 min.
2.4. Total solid, volatile solid measurement
To determine the dry matter content (total solid, TS), the plant materials were kept at 105 ◦C until their weight became constant. The volatile solid (VS) content was determined by placing the dried residues in an incinerator at 550 ◦C for 2 h.
2.5. C/N ratio determination
An Elementar Vario MAX CN (Elementar Group, Hanau, Germany) analyzer was used to determine the C/N ratio of the substrates. The temperature of the combustion and post combustion tube was set at 900 ◦C, the temperature of the reduction tube at 830 ◦C. After the samples were burnt in the combustion tube the water vapor was sepa- rated by a specific adsorption column containing Sicapent (Merck KGaA, Darmstadt, Germany). The components were detected with a thermal conductivity detector. Helium was the carrier and flushing gas (Messer Group, Bad Soden, Germany).
2.6. Fiber analysis
The fiber composition determination, including the Neutral Deter- gent Fiber (NDF, Acid Detergent Fiber (ADF) and Acid Detergent Lignin (ADL) of the biomass samples were carried out with a VELP Scientific FIWE 3 Fiber Analyzer (VELP Scientifica Srl, Usmate, Italy) according to the manufacturer’s guidelines using the Van Soest method (Kakuk et al., 2017). Hemicellulose was estimated as NDF-ADF, while cellulose as ADF-ADL. Lignin content is estimated as the ADL fraction.
2.7. High throughput DNA sequencing
In order to determine the microbial compositions of the digesters, a 150 mg sample from two, randomly selected reactors from each group of triplicate reactors was collected for total-community gDNA purification on day 30. After collection, the samples were stored at − 20 ◦C for further use. The extractions were performed with Quick-DNA Fecal/Soil Microbe Kit (Zymo Research Corporation, Irvine, USA) according to the manufacturer’s instructions. DNA quantity was first determined with Qubit 4.0 fluorimeter (Invitrogen, Waltham, USA) and then DNA integrity was examined on 1% agarose gel.
The V3-V4 region of 16S rDNA was amplified by PCR according to the Illumina protocol (Illumina, San Diego, USA). The following primer pairs containing overhanging sequences were applied as recommended by the Manufacturer.
Forward Primer:
5′-TCGTCGGCAGCGTCAGATGTGTATAAGAGA- CAGCCTACGGGNGGCWGCAG-3′,
Reverse Primer:
5′-GTCTCGTGGGCTCGGAGATGTGTATAAGAGA- CAGGACTACHVGGGTATCTAATCC-3′.
A PCR reaction mixture (25 µL) containing 12.5 ng genomic DNA, 2x KAPA HiFi HotStart Ready Mix, 0.2 µM of each primer. The PCR reaction parameters were the following: initialization at 95 ◦C for 3 min, followed by 25 cycles of denaturation, annealing and extension at 95 ◦C, 65 ◦C and 72 ◦C for 30–30 s, respectively. Final elongation was performed at 72 ◦C for 5 min. The libraries obtained were purified and then sequenced on an Illumina MiSeq platform. Illumina MiSeq® Reagent Kit v3 (2x300 bp) was used for the sequencing.
2.8. Bioinformatics methods for metagenomic analysis
The read count data were treated according to the DADA2 pipeline (Callahan et al., 2016), which implements ASV (absolute sequence variant) identification that has a number of advantages over OTU-based (operational taxonomy unit) methods (Callahan et al., 2017). Read trimming and quality filtering was done with the DADA2′s filterAndTrim function [parameters: truncLen =c(240,220), maxN =0, maxEE =c (2,2), truncQ =2, rm.phix =T, ctrimLeft =c(50, 55)], subsequently, learnErrors, derepFastq, dada and removeBimeraDenovo functions were used with default arguments. assignTaxonomy and addSpecies functions was used with SILVA-db, version 132, to annotate the reads. As a result, a total of 1332 amplicon sequence variants (ASVs) were identified, out of which at Kingdom-level: 1328 (99.7%), at Phylum-level: 1303 (97.8%); at Class-level: 1286 (96.5%); at Order-level: 1235 (92.7%); at Family-level: 1070 (80.3%); at Genus-level: 771 (57.9%); and at Species-level: 42 (3.2%) were successfully annotated. After abundance filtering for 0.1%, 113 ASVs were retained. These were used for the subsequent analyses.
The estimation of the difference in the ASV abundance (log2fold- change, log2FC) and the detection of significantly different ASVs be- tween the sample groups was carried out via the DESeq2 package (test =
“Wald”, fitType = “parametric”), which carries out an internal normalization procedure (Love et al., 2014). The significance threshold was set to p-value ≤ 0.05. Principal component analysis (PCA) was carried out on the regularized logarithm-transformed count data that was estimated with the DESeq2′s rlog function (according to the package vignette’s guidelines) and was visualized with factoextra package (Kassambara et al., 2017).
2.9. Energy potential and methane potential calculations
To estimate the total VS yield of the plantation (t/ha), the VS yields of the measured plants were added up and normalized to the average planting density that was used (20,000 plant/ha). To estimate the average energy potentials via biogasification (MJ/plant), as the theo- retical amount of energy that can be extracted from the plant biomass via AD, first the wet stem and leaf biomass values were multiplied with their respective VS % values and VS specific CH4 yields to get the in- dividual plant’s CH4 potential (CH4/plant). Then the energy potential (MJ/plant) of the plants was estimated by multiplying this with the energy content (55.6 MJ/kg) and density (0.657 g/m3, https://encyclopedia.airliquide.com/methane?GasID=41) of CH4. To esti- mate the plantation’s overall methane potential of (CH4 potential, ~ m3/plantation) and energy potential (GJ/ha), the plant’s CH4 potential and energy potential were normalized to the planting density, respec- tively. In the case of WWB, the theoretical energy potential via com- bustion values were estimated by multiplying the combustion calorific values (CCVs) (measured with a calorimeter, see above) with the biomass yields (in terms of VS).
2.10. Availability of data and material
All the R scripts that were used to analyze the data are available upon
request. Raw read sequences (.fastq files) are available on NCBI-SRA under the following BioProject id: PRJNA701827 (https://www.ncbi.
nlm.nih.gov/bioproject/PRJNA701827).
3. Results and discussion 3.1. Outline of the study
A small plantation of Salix viminalis Energo (EN) and PoliPlus (PP) consisting of 100 plants in each plot were harvested in equal numbers in three harvests during 2018 June, August and October. An early harvest in May was used for biomass productivity estimation only. In order to evaluate the potential of the green willow biomass (GWB) we analyzed biomass yields, chemical parameters relevant to AD (fiber composition and C and N content and ratio), hereafter called substrate parameters, and the biomethane potentials and production rates (K-value and µmax – derived from a fitted Gompertz model) of the plants. We tested the leaves and stems, both separately and also simultaneously, in a leaf to stem ratio (L/S, in terms of VS) that was the same as the plants them- selves showed. These values were used to estimate a potential bioenergy yield per unit plantation area. As reference, the characteristics of the woody willow biomass (WWB) were also measured on one- and two- years old woody stems harvested in winter time.
3.2. Dependence of the fermentation efficiency parameters on willow genotypes, harvest time and chemical composition of leaf and stem biomass
As presented in Table 1, the K values, i.e. the maximal methane yields (mL CH4/g VS), and the µmax values, i.e. highest methane pro- duction rates (mL CH4/day/g VS) were the key parameters to charac- terize the AD behavior of GWB or woody stems harvested in winter (WWB) from diploid and tetraploid genotypes. Regarding K-values, GWB leaves showed on average 12% and 14% higher K-values compared to GWB stems and WWB (mean K-value =232.5, 207.6 and 203.5 mL CH4/g VS), respectively, but the difference was not significant (p-value
=0.16). Based on K-values, leaves from both genotypes and stems of PP plants harvested in June served as superior CH4 sources relative to the woody tissues. In later vegetation phases, these differences were reduced and abolished in samples collected in October. In contrast, the maximal CH4 yield from the tetraploid stems harvested in this month
was higher (194.3 mL CH4/g VS) than that of the diploid stems (148.7 mL CH4/g VS). Previously it was shown that the tetraploid plants developed thicker stems and wood formation between the primary and secondary xylem rings increased significantly. The bark region was also thicker in stems of the tetraploid plants (Dudits et al., 2016). The µmax values showed significant difference between the GWB stems, leaves and WWB, i.e. generally, leaves showed a more rapid CH4 production rates (mean µmax = 17.5, 8.6 and 7.7 mL CH4/day/g VS for GWB stems, leaves and WWB, respectively), which was 93% higher than in case of GWB stems and 117% higher than that of WWB, on average (p-value <
0.0001). It is not very surprising that green leaves are decomposed faster than stems, but these results highlight the overall faster decomposition of GWB than WWB.
The effects of the Harvest and Genotype variables (factors) on the K and µmax values were assessed with a two-way ANOVA. Regarding the GWB stems’ K-values, two-way ANOVA p-values were <0.0001 and 0.00058 for, respectively, meaning that the effect of both variables on the K-values were significant. PP stems harvested in June or in October performed better than Energo plants. Considering µmax values, only the harvest time proved to be a significant factor (p-values <0.0001 and = 0.0122), here no difference was found between EN and PP.
One-way ANOVA was used to compare the leaves and stems of the two genotypes in each harvest. The June harvest showed the overall best fermentation parameters (K =199.08 and 251.80 mL CH4/g VS; µmax = 11.22 and 10.75 mL CH4/day/g VS, for EN and PP, respectively), here PP showed higher K-values than EN (p-value =0.0079), which was in the range of the August samples. The stems in these two harvests, and in case of PP in June especially, were firm, their AD was very efficient. The October harvest’s values were considerably lower. PP stems showed a better performance regarding K values in the June (21% increase, p- value =0.0079) and October samples (28% increase, p-value =0.0013);
and in October also a higher production rate (32% increase in µmax, p- value =0.0034).
As far as the leaves are concerned, the best values were also obtained from the June harvest, and although in this case there was no difference between EN and PP, the results were remarkably high (mean K =335.5 mL CH4/g VS and µmax =25.4 mL CH4/day/g VS). These were signif- icantly higher than the other harvest’s results (p-values < 0.0001), wherein only minor variations were observed. There was a slight dif- ference (p-value =0.089) in the case of the leaves’ µmax values from Table 1
Fermentation and substrate parameters of the Energo (EN) and PoliPlus (PP) willow samples: green stems and leaves of each harvest in case of GWB; one- and two- years-old woody stems in case of WWB. Lignin, hemicellulose, cellulose and solubles content were measured according to the Van Soest method and are expressed as % dry mass. C/N ratio is the measure of the substrates’ total C content (% dry mass) divided by the total N content (% dry mass). K and µmax values mean the maximal CH4
yields (mL CH4/g VS) and highest CH4 production rates (mL CH4/day/g VS), derived from the modified Gompertz model, which was fitted to the CH4 production data of each batch fermentation. The fermentations were carried out in triplicates, while the chemical analyses in duplicates. The mean standard deviation for each parameter is indicated in the bottom row. In each bracketed sample group [according to harvest and plant part (Stem or Leaf)], an ANOVA was carried out to infer the difference between the mean values of EN and PP. A * indicates if the mean value of a genotype was significantly higher than the mean of the other genotype in a respective comparison, under a p-value threshold of 0.05.
Harvest Genotype Plant Organ K µmax Lignin (ADL) Hemicellulose (NDF-ADF) Cellulose (ADF-ADL) Solubles C/N ratio
JUNE EN GWB Stem 199.1 10.8 11.7* 15.8 32.5 40.1* 47.1
JUNE PP GWB Stem 251.8* 11.2 8.9 14.9 40.2 36.0 43.2
JUNE EN GWB Leaf 336.2 25.9 5.7 9.6 23.0 61.7 12.6
JUNE PP GWB Leaf 334.9 24.8 7.3* 9.0 20.4 63.3 15.2
AUG EN GWB Stem 221.7 8.6 21.6 13.2 38.6 26.7 57.2
AUG PP GWB Stem 217.8 8.3 21.8 14.6* 38.5 25.1 54.0
AUG EN GWB Leaf 186.6 14.1 12.8 12.5 21.6 53.1 21.5
AUG PP GWB Leaf 199.8* 12.6 12.3 11.8 25.8 50.1 19.9
OCT EN GWB Stem 148.7 5.4 27.6* 15.3* 32.4 24.8 70.0
OCT PP GWB Stem 194.3 7.7* 23.1 13.5 34.6 28.8* 60.7
OCT EN GWB Leaf 206.3* 14.7* 14.5 12.0 27.3 46.2 21.9
OCT PP GWB Leaf 190.0 13.1 15.5 12.0 27.6 45.0 21.1
1-yo EN WWB Stem 211.9 7.3 23.8 10.5 41.9 23.9 70.6
1-yo PP WWB Stem 206.8 8.0 26.2 12.1 34.9 26.7 70.1
2-yo EN WWB Stem 194.9 6.9 28.1 9.9 37.4 24.5 77.7
2-yo PP WWB Stem 195.4 7.4 28.1 10.1 35.9 25.9 86.4
Mean standard deviation 11.91 0.79 0.65 0.44 1.48 1.04 2.31
October: here EN showed a slight increase in degradation rate (12%), but no differences were found in K the parameter. ANOVA was carried out for the chemical parameters, shown in Table 1, as well, and the results were subjected to a Tukey’s post-hoc test.
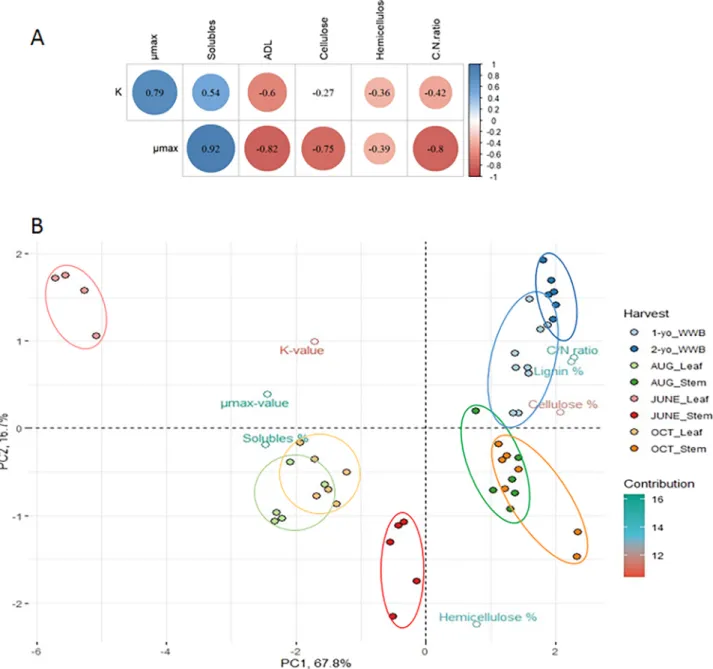
In an attempt to establish the molecular backgrounds of the different fermentation efficiencies in case of biomass variants, the Pearson cor- relation values (r) for fermentation parameters and for the substrate components were calculated (Fig. 1B). Both fermentation parameters correlated with the “soluble” content in a positive manner: strongly in the case of µmax (r =0.92, p-value =0.0002) and moderately in the case of K (r =0.54, p-value =0.0006). Indeed, the recovery of nutrients by bacteria is the easiest from the soluble part, which contains cytoplasm contents, as well as oligosaccharides and proteins. This probably contributed more to the earlier phases of the fermentation because the
breakdown of the resilient lignocellulose components generally pro- ceeds relatively slowly. As expected, the leaves that had a high con- centration of soluble content (and low lignin), performed considerably better in the batch tests.
GWB and WWB also differed regarding fiber and C/N ratios: GWB showed a lower C/N ratio for leaves (mean =15.6), and for stems (mean
=19.7), than in WWB (mean =48.1). The GWB values are close to the optimal range. C/N ratio negatively correlated with µmax and K in a strong (r = − 0.80, p-value =0.00001) and a moderate (r =-0.42, p- value =0.028) way, respectively (Fig. 1). However, most of the sub- strates had a higher-than-optimal values regarding C/N as the C/N = 20–30/1 range has been found the most appropriate for biogas reactors (B¨ojti et al., 2017). This can be translated as the C/N value gets closer to the optimal range, µmax values tend to be higher, especially in the case
Fig. 1. A: Pearson correlations (r) of the fermentation parameters with the substrate parameters. Filled circles represent ‘significant’ correlations (p-value ≤0.05).
The filling colors of the circles show the scale of the correlations (scale indicated on the right hand side). B: Principal Component Analysis (PCA) biplot of the samples (individuals, filled circles) based on their measured parameters (variables, unfilled circles). This chart shows the overall similarities and differences between the GWB (leaves and stems) and WWB samples, according to their chemical compositions and fermentation parameters. The samples are colored according to the harvest time and to the part of the plant in case of GWB, as shown in the right side of the figure. The X- and Y-axes represent the first and second principal components, respectively. Contribution means the percentage of the variables to the principal components, i.e. how important a given variable is in determining the principal components. PC1 and PC2 describes 67.8% and 16.7% of the overall variability in the data, thus distances in the X-axis are more expressive than in the Y-axis.
of leaves. Herrmann et al. thoroughly measured several parameters of many crop silages, but from among them, C/N ratio did not show a strong correlation with BMP, probably because all these substrates were essentially in the optimal range (Herrmann et al., 2016). The authors argued that the most important contributor to the AD was acid detergent lignin (ADL), (and also acid detergent fiber (ADF), neutral detergent fiber (NDF) and some silage parameters, e.g. butyric acid and alcohols.
In their analysis ADL showed a strong negative correlation with K (− 0.73), which in this case was somewhat less evident, but still signif- icant: r = −0.60 and p-value =0.0006.
The lignin content is a resilient component in AD. Lower lignin concentrations were found in leaves (mean =9.6), and in GWB stems (mean =18.2) than in WWB (mean =27.8) (Table 1). As the µmax values are in correlation with ADL content was r = − 0.82. In the present experiments, the shape of the fermentation curve was even more affected by the ADL content than the final yields. This is also supported by the very weak correlation between hemicellulose and K-values and the essentially missing correlation between cellulose and K-values.
Probably this is the reason why cellulose showed a negative correlation (r = − 0.75) with µmax, i.e. it degraded during the AD, albeit slower.
Rendering the cellulose structure less crystalline-like, is the aim of many pretreatment processes (Tsapekos et al., 2018). The negative correlation between µmax and cellulose content indicated that its rigid structure hinders its decomposition. Most of the cellulose breaks down eventually during the residence time in the AD reactor, hence there is practically no negative correlation between its amount, and the overall CH4 yield.
Hemicellulose was found to correlate only weakly with the fermentation parameters, usually this substrate is not the bottleneck of the hydrolysis process.
Principal Component Analysis (PCA) was used to highlight similar- ities and differences between tissue samples according to chemical compositions and fermentation parameters. The ‘individuals’ on the biplot (Fig. 1B) are colored according to the harvesting time. The 1- and 2-years-old woody samples (light and deep blue filled circles, respec- tively) form a distinct group, which is the farthest from the other leaves and stems grouped in between them.
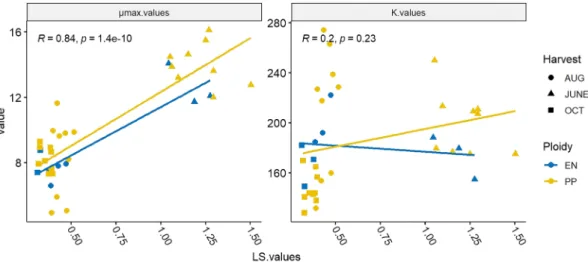
3.3. Leaf to stem ratios and methane production in mixed fermentation Batch fermentations were also carried out in which both the leaves (L) and the stems (S) were used as substrates, while maintaining the L/S ratios of the original plants. The reason was that this arrangement better represented the scenario, in which the whole plantation of GWB was harvested for utilization in an industrial biogas digester. As shown in Fig. 2, in case of the June samples, L/S ratios were higher than 1, i.e.
leaves contributed to more than half of the total biomass in these har- vests. These values are advantageous for biogas production (see also Table 1), since leaves are readily digestible substrates. For example, it was shown in the case of Miscanthus biomass that a higher leaf-to-stem ratio provided better biofuel conversion efficiency and quality (Tubei- leh et al., 2016). This was supported by the observation that µmax values were strongly correlated in a positive manner with the L/S values, however K-values hardly showed any correlation (Pearson’s rho =0.84 for µmax and 0.2 for K values, respectively, see Fig. 2). So, the fermen- tation rate was much higher in cases of more leaf biomass, but the overall CH4 yield apparently depended primarily on other factors. It is important to note that industrial biogas plants can make substantial advantage of the utilization of faster degrading feedstocks because in this case the specific daily biogas yields increase.
In mixed fermentations the two genotypes did not show significant differences, although the tetraploid (PP) biomass harvested in June and August decomposed more efficiently as compared with the diploid tis- sues. Both µmax and K values in the October samples were significantly lower than that of the June and August samples. Although the remark- ably high K values of the June samples seen in the monofermentations did not occur here, the µmax values were still significantly higher than the other sample’s (Fig. 2, and Fig. S1). It is noteworthy, that Dudits et al (2016) found higher L/S ratios in the tetraploid PP green willow plants relative to the diploid ones. Hence, PP GWB may be somewhat better AD substrate than the diploid cultivars.
Correlations between the chemical parameters of the substrate and the fermentation efficiency, expressed by K-values (the maximal CH4
yields) and µmax values (highest CH4 production rates), indicated that low lignin and high soluble contents are the most important factors in high and rapid biomethane yields. These are characteristics of the leaf samples and the stems from the June harvest and could serve as superior CH4 sources than the woody tissues. Stems of the PP clones showed higher overall CH4 yields (K-value) in the June and October harvests, and faster degradation rate (µmax value) in October samples. Higher leaf-to-stem (L/S) ratios were shown to be positively correlated with µmax values, suggesting that PP plants harvested in June and both PP and EN plants from August harvests are the best substrates for biogas fermentation. This can be especially relevant to continuous industrial AD, as these systems take particular advantage of the rate of substrate degradation.
3.4. Taxonomic composition analysis
The breakdown of plant biomass in AD is carried out by a wide va- riety of microbes, including Clostridia, Bacteroidetes and others (Wirth
Fig. 2. Correlation of the Leaf/Stem (L/S) ratios (on a VS basis) of EN and PP willow genotypes with the average methane potentials (K) and highest production rates (µmax) derived from the modified Gompertz models of their respective mixed fermentations.
et al., 2012, Kougias et al., 2018). Microbial community analyses can help to better understand these processes and to highlight the most important taxa in the degradation of a specific biomass. In order to carry out such analysis, i.e., to identify differences between the genotypes and harvest groups, the microbial composition of the co-fermentations were analyzed with a 16S rRNA gene metagenomic sequencing approach.
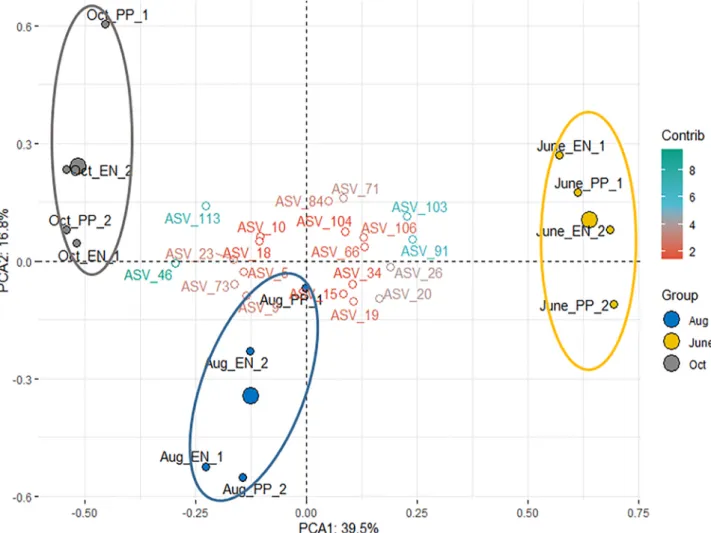
A clear pattern emerged from the comparison of the taxonomic composition of the samples (Fig. 3). The microbial communities from each harvest clustered together. Interestingly, there was no obvious difference or trend between the two plant genotypes. The similarity of substrate characteristics in each harvest may explain this observation.
The clustering of microbial community compositions from June to October was similar, the trend reflected the substrate and fermentation parameters, i.e. that the clustering occurred primarily on harvesting time and the August samples showed a transition between the June and the October samples (Fig. 3).
An examination at higher taxonomic level showed predominance of the order Clostridiales in the samples, i.e. in the case of August =80.4%
±1.0%; in October =80.1% ±0.3%; and in May =80.8% ±0.6%. The high proportion of Clostridiales in AD is not unusual, e.g. 70% of phylum Firmicutes, which was composed of mainly Clostridiales, were observed (Westerholm et al., 2019). The Firmicutes/Bacteriodetes ratio positively correlated with the CH4 yield. The same ratio was observed to be 5–6 by Güllert et al. (2016), although the authors concluded that the low abundance of Bacteroidetes in the AD sludge was a sign of less effective plant material decomposition compared to herbivore gut. The central
role of Clostridiales was also noted in other studies (Kougias et al., 2018, Wirth et al., 2012). The presence of these microbes is fundamental for the proper functioning of biogas digesters, their relative abundance is normally within the 40–60% range (Wirth et al., 2012), but substrate and fermentation parameter-specific conditions clearly cause alterations in their abundance and composition. In general, these bacteria Several of these bacteria are known for their cellulolytic properties, due to the presence of genes encoding the multi-enzyme complex cellulosome (Koeck et al., 2016) and other hydrolytic enzymes. Nevertheless, it is unusual that the phylum Bacteriodetes is essentially missing from the AD microbial community (only 3 ASVs from this taxon were found and their abundance was below 0.1%). In this work an end-point microbial community analysis was carried out, the fierce competition for the substrates might explain this observation. The predominance of Clos- tridiales at the expense of Bacteroidetes was observed earlier (Wahid et al., 2019). It is reasonable to assume that although Bacteroidetes were present in the initial inoculum, they were outcompeted by the Clostridia, which are suited to degrade complex lignocellulosic polymers, tolerate the scarcity of resources and the lowering of pH better than Bacter- iodetes, are. It is reasonable to assume that Bacteroidetes were out- competed by the Clostridia.
Species-level taxonomic annotation was achieved in 6 ASVs above the relative abundance threshold. Out of these, two could be considered as major components. Two of them could be considered as major hy- drolytic players in the consortium. Clostridium butyricum (ASV_8), hav- ing a mean relative abundance of 3.08% ±0.15%, probably contributed
Fig. 3.Principal Component Analysis presents biplot of the established microbial communities at the end of the experiments, according to various harvests (colors ~ Group) and genotypes (labels). The filled circles represent the individual samples, with replicate reactors labeled with numbers. Larger circles represent the geometric means of each harvest group. The top 20 ASV are shown, according to their contribution (Contrib.) to the principal components. No meaningful correlations were discovered among the individual ASVs.
to the deconstruction of hemicellulose. It was shown (Jia et al., 2018) that C. butyricum expressed numerous key enzymes involved in pentose phosphate pathway, which converts xylose to hexose to direct it to glycolysis. Herbinix luporum (ASV_5), a cellulose-degrading microbe from the family Lachnospiraceae was first isolated from a thermophilic
biogas reactor (Koeck et al., 2016). In this experiment system, H. luporum showed a mean relative abundance of 4.16% ±0.37%. Other predominant species included ASVs from the genus Clostridiaceae, such as ASV_1_Unknown_Clostridium_sensu_stricto_1, and ASV_2_Unknown_- Clostridium_sensu_stricto_1, in average they represented 12.89% ±0.27%
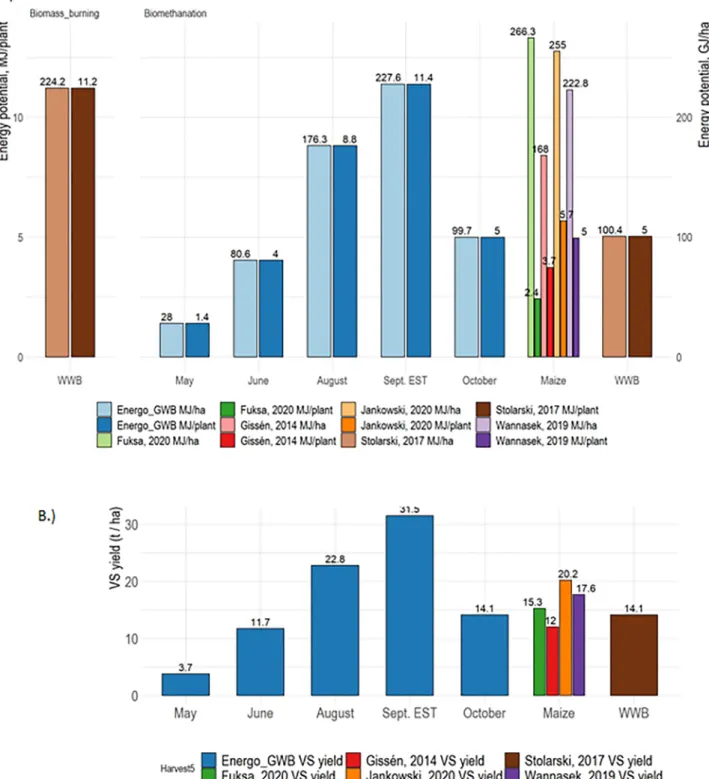
Fig. 4. A: Dependence of energy potential on fermentation of various substrates. Energy potential per plantation area (GJ/ha, lighter colors) and per plant (MJ/
plant, darker colors) are plotted. The energy potential of the plants and the plantation in a given harvest was calculated by multiplying the VS yields with the substrate specific CH4 yields, as described in Section 2.1. The values for maize silage and WWB are from the respective references. B: Green willow biomass (GWB) yields (t/ha) at various harvesting times. For the estimation of an early September estimated biomass yield (Sept. EST), a growth model (Gompertz model) was fitted to the measured data. The individual VS yields of the Energo plants were averaged, and the VS yield/ha was calculated by normalizing this to the optimal planting density (20,000 plant/ha). References for maize silage are from Fuksa et al., 2020; Giss´en et al., 2014; Jankowski et al., 2020; Wannasek et al., 2019 and for willow wood biomass (WWB) from Stolarski et al., 2017. (For interpretation of the references to colour in this figure legend, the reader is referred to the web version of this article.)
and 9.85% ±0.28% of the total community, respectively. It has been observed (Jia et al., 2018) that transcriptionally very active microbes could contribute to as much as 60–70% of the total community abun- dance. It is reasonable to assume that similar phenomenon occurred in the present system as well. A differential abundance analysis was carried out between the harvest groups on the ASVs, as the substrate parameter results showed that the main differences could be attributed to harvests.
This is in accordance with the PCA results indicating the June and October samples were the most dissimilar.
3.5. The advantages of using green willow biomass in comparison to other biogas feedstock
In order to appropriately evaluate the potential of a novel biomass as a feedstock for large scale AD, the biomass yields per hectare must be evaluated (Giss´en et al., 2014). For an approximate estimation of GWB biomass yields, a small-scale field experiment was carried out, which may not reflect precisely the data for large scale plantations, but the trend should be informative. In order to determine the optimal harvest time, the biomass yields at each harvest time point were estimated (Fig. 4). In this evaluation the EN genotype was analyzed, which is a commercial and publicly available willow cultivar. The willow biomass grew steadily during Spring and Summer before starting to decline mainly due to loss of leaves during the second half of September and in early October. The measured and the estimated biomass yields of GWB (Fig. 4) were in the similar range or somewhat higher than that of WWB or maize (literature data), suggesting that the estimates were comparable.
In the review of willow production in Poland, the authors compared woody biomass yield data from annual, biannual, triannual and quadrennial harvests and found that the triannual harvests showed a slightly higher average yield than the other scenarios (Stolarski et al., 2019). Yields from annual harvests in small-scale experimental trials were comparable to that of the other scenarios, ranging from 6.7 to 17, with an average of 13.1 t/ha (Stolarski et al., 2017). It has been noted that the plantations showed very high variances caused by many factors, such as soil type, cultivar and agro-technologies used (planting density, fertilization, etc.).
In addition to measuring biomass yields the extractable energy po- tential of willow plants and plantations relative to WWB and maize silage parameters were estimated (Fig. 4A). Comparison of the GWB with the energy potential of maize silage and woody biomass revealed that willow feedstocks harvested in August and September can produce higher yields. Furthermore, the results suggest that the energy potential per hectare of plantation (Fig. 4A, light colored bars) of GWB (176.27 and 227.65 GJ/ha/year, in case of August harvest and September esti- mation, respectively) is in the range of maize silage and is higher than that of woody biomass. WWB yield data were taken from Stolarski et al., 2017, and biomethane yield values from this work. When considering the µmax values, GWB performs even better, as faster CH4 production is more advantageous in CSTR reactors and the GWB’s energy potential is similar to WWB when the latter is used for burning. It should be further emphasized that GWB can reach the average values for maize silage biomethanation, although the specific yields depend on planting den- sity, which can be as dense as 90,000 GWB stem/ha or 130,000/ha (Fuksa et al., 2020). If agro-technologies would be optimized for higher plant densities, the energy potentials (GJ/ha) of GWB plantations could be elevated more and thus surpass that of a maize silage but for a sub- stantially lower production cost. Nevertheless, additional validations of the biomass yields from larger-scale and multi-year field experiments are necessary to gain higher confidence in the biomass yields and to evaluate the possible attenuation of annual cutbacks of plants.
It is imperative to develop a scheme for the storage of GWB to supply biogas plants with feedstock all-year-around. In case of dry WWB, organic matter losses during the storage can reach 20% (Whittaker et al., 2018), while in case of ensiling, a good management can lead to as small
as 1% dry material loss upon ensilaging (Borreani et al., 2018).
Considering this and given the obvious resemblance of GWB to other plant materials that are frequently ensiled, a plausible approach for the preservation of GWB can be ensiling. Indeed, preliminary results on ensiling GWB supports this approach (Ny´ari et al., 2021: Use of ensi- laged green willow biomass in biogas fermentation, in press).
A study conducted on Miscanthus showed that harvesting time had a large impact on the performance of AD unlike biomass combustion. The average energy potential of AD was 35% less in the case of an autumn green harvest for AD and a delayed harvest for combustion. The conversion-related energy loss could be lowered to an average of 18%
(Kiesel et al., 2017). However, biogas is a higher-value energy carrier, as it can be upgraded to biomethane, stored in the existing natural gas infrastructure and further utilized as a transport fuel or in combined heat and power plants.
The biomass yield estimates from this small-scale field trial showed that EN plants harvested in August produced VS amounts that was comparable to maize silage, extrapolation suggested that September harvest could result in even higher yields. Higher Leaf-to-Stem (L/S) ratios were shown to be positively correlated with µmax values, sug- gesting that PP plants harvested in June harvests are optimal substrates for AD. This can be especially relevant to industrial scale AD, as these systems take advantage of the faster rate of substrate degradation. When biomass yields are also taken into account, a late August-early September can be the choice for harvest. Therefore, the presented data and calculations provide substantial support to promote and recommend green willow biomass (GWB) as valuable feedstock for biomethanation.
4. Conclusions
Green willow biomass (GWB) can be a viable alternative biogas substrate. Low lignin and high “solubles” are key factors for efficient AD.
The extractable energy potential per ha in August – September harvests of GWB reaches and can surpass the values of maize silage. Energy willow shrub plantations, besides other advantages, can be harvested annually thereby reducing biomass production costs considerably. In further research, breeding can improve biomass characteristics. Further validations of average biomass yields in multi-year and larger scale settings, tests in continuous reactors and ensilaging is necessary, but this feedstock already holds potential for use in biogas digesters as an alternative to replace herbaceous feedstock for AD.
Declaration of Competing Interest
The authors declare that they have no known competing financial interests or personal relationships that could have appeared to influence the work reported in this paper.
Appendix A. Supplementary data
Supplementary data to this article can be found online at https://doi.
org/10.1016/j.biortech.2021.125223.
References
Alexandropoulou, M., Antonopoulou, G., Fragkou, E., Ntaikou, I., Lyberatos, G., 2017.
Fungal pretreatment of willow sawdust and its combination with alkaline treatment for enhancing biogas production. J. Environ. Manage. 203, 704–713. https://doi.
org/10.1016/j.jenvman.2016.04.006.
B¨ojti, T., Kov´acs, K.L.K.L., Kakuk, B., Wirth, R., R´akhely, G., Bagi, Z., 2017. Pretreatment of poultry manure for efficient biogas production as monosubstrate or co- fermentation with maize silage and corn stover. Anaerobe 46, 138–145. https://doi.
org/10.1016/j.anaerobe.2017.03.017.
Borreani, G., Tabacco, E., Schmidt, R.J., Holmes, B.J., Muck, R.E., 2018. Silage review:
Factors affecting dry matter and quality losses in silages. J. Dairy Sci. 101, 3952–3979. https://doi.org/10.3168/jds.2017-13837.
Brethauer, S., Studer, M.H., 2015. biochemical conversion processes of lignocellulosic biomass to fuels and chemicals – a review. Chim. Int. J. Chem. https://doi.org/
10.2533/chimia.2015.572.
Callahan, B.J., McMurdie, P.J., Holmes, S.P., 2017. Exact sequence variants should replace operational taxonomic units in marker-gene data analysis. ISME J. 11, 2639–2643. https://doi.org/10.1038/ismej.2017.119.
Callahan, B.J., Sankaran, K., Fukuyama, J.A., McMurdie, P.J., Holmes, S.P., 2016.
Bioconductor Workflow for Microbiome Data Analysis: from raw reads to community analyses. F1000Research 5, 1492. https://doi.org/10.12688/
f1000research.8986.2.
Campanaro, S., Treu, L., Kougias, P.G., Luo, G., Angelidaki, I., 2018. Metagenomic binning reveals the functional roles of core abundant microorganisms in twelve full- scale biogas plants. Water Res. 140, 123–134. https://doi.org/10.1016/j.
watres.2018.04.043.
Caputo, J., Balogh, S.B., Volk, T.A., Johnson, L., Puettmann, M., Lippke, B., Oneil, E., 2014. Incorporating Uncertainty into a Life Cycle Assessment (LCA) Model of Short- Rotation Willow Biomass (Salix spp.) Crops. BioEnergy Res. 7, 48–59. https://doi.
org/10.1007/s12155-013-9347-y.
Clifton-Brown, J., Harfouche, A., Casler, M.D., Dylan Jones, H., Macalpine, W.J., Murphy-Bokern, D., Smart, L.B., Adler, A., Ashman, C., Awty-Carroll, D., Bastien, C., Bopper, S., Botnari, V., Brancourt-Hulmel, M., Chen, Z., Clark, L.V., Cosentino, S., Dalton, S., Davey, C., Dolstra, O., Donnison, I., Flavell, R., Greef, J., Hanley, S., Hastings, A., Hertzberg, M., Hsu, T.-W., Huang, L.S., Iurato, A., Jensen, E., Jin, X., Jørgensen, U., Kiesel, A., Kim, D.-S., Liu, J., McCalmont, J.P., McMahon, B.G., Mos, M., Robson, P., Sacks, E.J., Sandu, A., Scalici, G., Schwarz, K., Scordia, D., Shafiei, R., Shield, I., Slavov, G., Stanton, B.J., Swaminathan, K., Taylor, G., Torres, A.F., Trindade, L.M., Tschaplinski, T., Tuskan, G.A., Yamada, T., Yeon Yu, C., Zalesny, R.S., Zong, J., Lewandowski, I., 2019. Breeding progress and preparedness for mass-scale deployment of perennial lignocellulosic biomass crops switchgrass, miscanthus, willow and poplar. GCB Bioenergy 11, 118–151. https://doi.org/
10.1111/gcbb.12566.
Cunniff, J., Cerasuolo, M., 2011. Lighting the way to willow biomass production. J. Sci.
Food Agric. 91, 1733–1736. https://doi.org/10.1002/jsfa.4470.
Dimitriou, I., Mola-Yudego, B., Aronsson, P., Eriksson, J., 2012. Changes in organic carbon and trace elements in the soil of willow short-rotation coppice plantations.
BioEnergy Res. 5, 563–572. https://doi.org/10.1007/s12155-012-9215-1.
Dudits, D., T¨or¨ok, K., Cseri, A., Paul, K., Nagy, A.V., Nagy, B., Sass, L., Ferenc, G., Vankova, R., Dobrev, P., Vass, I., Ayaydin, F., 2016. Response of organ structure and physiology to autotetraploidization in early development of energy willow Salix viminalis. Plant Physiol. 170, 1504–1523. https://doi.org/10.1104/pp.15.01679.
Eisenbies, M.H., Volk, T.A., Posselius, J., Foster, C., Shi, S., Karapetyan, S., 2014.
Evaluation of a single-pass, cut and chip harvest system on commercial-scale, short- rotation shrub willow biomass crops. BioEnergy Res. 7, 1506–1518. https://doi.org/
10.1007/s12155-014-9482-0.
Fabio, E.S., Volk, T.A., Miller, R.O., Serapiglia, M.J., Gauch, H.G., Van Rees, K.C.J., Hangs, R.D., Amichev, B.Y., Kuzovkina, Y.A., Labrecque, M., Johnson, G.A., Ewy, R.
G., Kling, G.J., Smart, L.B., 2017. Genotype ×environment interaction analysis of North American shrub willow yield trials confirms superior performance of triploid hybrids. GCB Bioenergy 9, 445–459. https://doi.org/10.1111/gcbb.12344.
Ferrarini, A., Fornasier, F., Serra, P., Ferrari, F., Trevisan, M., Amaducci, S., 2017.
Impacts of willow and miscanthus bioenergy buffers on biogeochemical N removal processes along the soil-groundwater continuum. GCB Bioenergy 9, 246–261.
https://doi.org/10.1111/gcbb.12340.
Fischer, G., Prieler, S., van Velthuizen, H., 2005. Biomass potentials of miscanthus, willow and poplar: results and policy implications for Eastern Europe, Northern and Central Asia. Biomass Bioenergy 28, 119–132. https://doi.org/10.1016/j.
biombioe.2004.08.013.
Fuksa, P., Hakl, J., Míchal, P., Hrevuˇsov´a, Z., Santrůˇˇ cek, J., Tlustoˇs, P., 2020. Effect of silage maize plant density and plant parts on biogas production and composition.
Biomass and Bioenergy 142, 105770. https://doi.org/10.1016/j.
biombioe.2020.105770.
Giss´en, C., Prade, T., Kreuger, E., Nges, I.A., Rosenqvist, H., Svensson, S.-E., Lantz, M., Mattsson, J.E., B¨orjesson, P., Bj¨ornsson, L., 2014. Comparing energy crops for biogas production - Yields, energy input and costs in cultivation using digestate and mineral fertilisation. Biomass Bioenergy 64, 199–210. https://doi.org/10.1016/j.
biombioe.2014.03.061.
Güllert, S., Fischer, M.A., Turaev, D., Noebauer, B., Ilmberger, N., Wemheuer, B., Alawi, M., Rattei, T., Daniel, R., Schmitz, R.A., Grundhoff, A., Streit, W.R., 2016.
Deep metagenome and metatranscriptome analyses of microbial communities affiliated with an industrial biogas fermenter, a cow rumen, and elephant feces reveal major differences in carbohydrate hydrolysis strategies. Biotechnol. Biofuels.
9 https://doi.org/10.1186/s13068-016-0534-x.
Herrmann, C., Idler, C., Heiermann, M., 2016. Biogas crops grown in energy crop rotations: Linking chemical composition and methane production characteristics.
Bioresour. Technol. 206, 23–35. https://doi.org/10.1016/j.biortech.2016.01.058.
Jankowski, K.J., Dubis, B., Sokolski, M.M., Załuski, D., B´ ´orawski, P., Szempli´nski, W., 2020. Productivity and energy balance of maize and sorghum grown for biogas in a large-area farm in Poland: An 11-year field experiment. Ind. Crops Prod. 148, 112326. https://doi.org/10.1016/j.indcrop.2020.112326.
Janssen, J., Weyens, N., Croes, S., Beckers, B., Meiresonne, L., Van Peteghem, P., Carleer, R., Vangronsveld, J., 2015. Phytoremediation of metal contaminated soil using willow: exploiting plant-associated bacteria to improve biomass production and metal uptake. Int. J. Phytoremediation 17, 1123–1136. https://doi.org/
10.1080/15226514.2015.1045129.
Jia, Y., Ng, S.-K., Lu, H., Cai, M., Lee, P.K.H., 2018. Genome-centric metatranscriptomes and ecological roles of the active microbial populations during cellulosic biomass anaerobic digestion. Biotechnol. Biofuels 11, 117. https://doi.org/10.1186/s13068- 018-1121-0.
Kakuk, B., Kov´acs, K.L.K.L., Szuhaj, M., R´akhely, G., Bagi, Z., 2017. Adaptation of continuous biogas reactors operating under wet fermentation conditions to dry conditions with corn stover as substrate. Anaerobe 46, 78–85. https://doi.org/
10.1016/j.anaerobe.2017.05.015.
Kalamaras, S.D., Kotsopoulos, T.A., 2014. Anaerobic co-digestion of cattle manure and alternative crops for the substitution of maize in South Europe. Bioresour. Technol.
172, 68–75. https://doi.org/10.1016/j.biortech.2014.09.005.
Kassambara, A., Mundt, F., Kassambara, A.; Mundt, F., 2017. Factoextra: extract and visualize the results of multivariate data analyses. URL http//www.sthda.com/
english/rpkgs/factoextra BugReports.
Kiesel, A., Nunn, C., Iqbal, Y., Van der Weijde, T., Wagner, M., Ozgüven, M., ¨ Tarakanov, I., Kalinina, O., Trindade, L.M., Clifton-Brown, J., Lewandowski, I., 2017. Site-specific management of miscanthus genotypes for combustion and anaerobic digestion: a comparison of energy yields. Front. Plant Sci. 8, 347. https://
doi.org/10.3389/fpls.2017.00347.
Koeck, D.E., Hahnke, S., Zverlov, V.V., 2016. Herbinix luporum sp. nov., a thermophilic cellulose-degrading bacterium isolated from a thermophilic biogas reactor. Int. J.
Syst. Evol. Microbiol. 66, 4132–4137. https://doi.org/10.1099/ijsem.0.001324.
Kougias, P.G., Campanaro, S., Treu, L., Tsapekos, P., Armani, A., Angelidaki, I., Liu, S.-J., 2018. Spatial distribution and diverse metabolic functions of lignocellulose- degrading uncultured bacteria as revealed by genome-centric metagenomics. Appl.
Environ. Microbiol. 84 https://doi.org/10.1128/AEM.01244-18.
Love, M.I., Huber, W., Anders, S., 2014. Moderated estimation of fold change and dispersion for RNA-seq data with DESeq2. Genome Biol. 15, 550. https://doi.org/
10.1186/s13059-014-0550-8.
Mulat, D.G., Dibdiakova, J., Horn, S.J., 2018. Microbial biogas production from hydrolysis lignin: insight into lignin structural changes. Biotechnol. Biofuels 11, 61.
https://doi.org/10.1186/s13068-018-1054-7.
Patinvoh, R.J., Osadolor, O.A., Chandolias, K., S´arv´ari Horv´ath, I., Taherzadeh, M.J., 2017. Innovative pretreatment strategies for biogas production. Bioresour. Technol.
224, 13–24. https://doi.org/10.1016/j.biortech.2016.11.083.
Petzoldt, T., 2018. growthrates: Estimate Growth Rates from Experimental Data.
Purdy, S.J., Maddison, A.L., Nunn, C.P., Winters, A., Timms-Taravella, E., Jones, C.M., Clifton-Brown, J.C., Donnison, I.S., Gallagher, J.A., 2017. Could Miscanthus replace maize as the preferred substrate for anaerobic digestion in the United Kingdom?
Future breeding strategies. Glob. Change Biol. Bioenergy 9, 1122–1139. https://doi.
org/10.1111/gcbb.12419.
Serapiglia, M.J., Gouker, F.E., Smart, L.B., 2014. Early selection of novel triploid hybrids of shrub willow with improved biomass yield relative to diploids. BMC Plant Biol.
14, 74. https://doi.org/10.1186/1471-2229-14-74.
Ssegane, H., Zumpf, C., Cristina Negri, M., Campbell, P., Heavey, J.P., Volk, T.A., 2016.
The economics of growing shrub willow as a bioenergy buffer on agricultural fields:
a case study in the Midwest Corn Belt. Biofuels Bioprod. Biorefining 10, 776–789.
https://doi.org/10.1002/bbb.1679.
Stolarski, M.J., Niksa, D., Krzy˙zaniak, M., Tworkowski, J., Szczukowski, S., 2019. Willow productivity from small- and large-scale experimental plantations in Poland from 2000 to 2017. Renew. Sustain. Energy Rev. 101, 461–475. https://doi.org/10.1016/
J.RSER.2018.11.034.
Stolarski, M.J., Szczukowski, S., Tworkowski, J., Krzy˙zaniak, M., Załuski, D., Ozef Tworkowski, J., Krzy, M., Zaniak, Załuski, D., 2017. Willow biomass and cuttings’
production potential over ten successive annual harvests. Biomass Bioenergy 105, 230–247. https://doi.org/10.1016/j.biombioe.2017.07.010.
Tjørve, K.M.C., Tjørve, E., 2017. The use of Gompertz models in growth analyses, and new Gompertz-model approach: An addition to the Unified-Richards family. PLoS One 12, 1–17. https://doi.org/10.1371/journal.pone.0178691.
Tsapekos, P., Kougias, P.G., Angelidaki, I., 2018. Mechanical pretreatment for increased biogas production from lignocellulosic biomass; predicting the methane yield from structural plant components. Waste Manag. 78, 903–910. https://doi.org/10.1016/j.
wasman.2018.07.017.
Tubeileh, A., Rennie, T.J., Goss, M.J., 2016. A review on biomass production from C4 grasses: yield and quality for end-use. Curr. Opin. Plant Biol. 31, 172–180. https://
doi.org/10.1016/J.PBI.2016.05.001.
van der Lelie, D., Taghavi, S., McCorkle, S.M., Li, L.-L., Malfatti, S.A., Monteleone, D., Donohoe, B.S., Ding, S.-Y., Adney, W.S., Himmel, M.E., Tringe, S.G., Badger, J.H., 2012. The metagenome of an anaerobic microbial community decomposing poplar wood chips. PLoS One 7, e36740. https://doi.org/10.1371/journal.pone.0036740.
Volk, T.A., Berguson, B., Daly, C., Halbleib, M.D., Miller, R., Rials, T.G., Abrahamson, L.
P., Buchman, D., Buford, M., Cunningham, M.W., Eisenbies, M., Fabio, E.S., Hallen, K., Heavey, J., Johnson, G.A., Kuzovkina, Y.A., Liu, B., Mcmahon, B., Rousseau, R., Shi, S., Shuren, R., Smart, L.B., Stanosz, G., Stanton, B., Stokes, B., Wright, J., 2018. Poplar and shrub willow energy crops in the United States: field trial results from the multiyear regional feedstock partnership and yield potential maps based on the PRISM-ELM model. GCB Bioenergy 10, 735–751. https://doi.org/
10.1111/gcbb.12498.
Volk, T.A., Heavey, J.P., Eisenbies, M.H., 2016. Advances in shrub-willow crops for bioenergy, renewable products, and environmental benefits. Food Energy Secur. 5, 97–106. https://doi.org/10.1002/fes3.82.
Wagner, A., Lackner, N., Mutschlechner, M., Prem, E., Markt, R., Illmer, P., 2018.
Biological pretreatment strategies for second-generation lignocellulosic resources to enhance biogas production. Energies 11, 1797. https://doi.org/10.3390/
en11071797.
Wahid, R., Mulat, D.G., Gaby, J.C., Horn, S.J., 2019. Effects of H2:CO2 ratio and H2 supply fluctuation on methane content and microbial community composition during in-situ biological biogas upgrading. Biotechnol. Biofuels 12, 1–15. https://
doi.org/10.1186/s13068-019-1443-6.
Wannasek, L., Ortner, M., Kaul, H.-P., Amon, B., Amon, T., 2019. Double-cropping systems based on rye, maize and sorghum: impact of variety and harvesting time on biomass and biogas yield. Eur. J. Agron. 110, 125934. https://doi.org/10.1016/j.
eja.2019.125934.
Westerholm, M., Castillo, M.d.P., Chan Andersson, A., Jahre Nilsen, P., Schnürer, A., 2019. Effects of thermal hydrolytic pre-treatment on biogas process efficiency and microbial community structure in industrial- and laboratory-scale digesters. Waste Manag. 95, 150–160. https://doi.org/10.1016/j.wasman.2019.06.004.
Whittaker, C., Yates, N.E., Powers, S.J., Misselbrook, T., Shield, I., 2018. Dry matter losses and quality changes during short rotation coppice willow storage in chip or rod form. Biomass Bioenergy 112, 29–36. https://doi.org/10.1016/J.
BIOMBIOE.2018.02.005.
Wirth, R., Kov´acs, E., Mar´ati, G., Bagi, Z., R´akhely, G., Kov´acs, K.L., 2012.
Characterization of a biogas-producing microbial community by short-read next generation DNA sequencing. Biotechnol. Biofuels 5, 1–16. https://doi.org/10.1186/
1754-6834-5-41.