Polymer Testing 84 (2020) 106395
Available online 3 February 2020
0142-9418/© 2020 The Authors. Published by Elsevier Ltd. This is an open access article under the CC BY-NC-ND license
(http://creativecommons.org/licenses/by-nc-nd/4.0/).
Performance of a parallel viscoelastic-viscoplastic model for a microcellular thermoplastic foam on wide temperature range
Szabolcs Berezvai
*, Attila Kossa
Department of Applied Mechanics, Budapest University of Technology and Economics, H-1111, Budapest, Muegyetem rkp. 5, Hungary
A R T I C L E I N F O Keywords:
Thermoplastics Finite strain theory
Viscoelastic-viscoplastic deformation Temperature dependency Parameter-fitting
A B S T R A C T
This paper is concerned with the experimental testing and the constitutive modelling of a thermoplastic microcellular polyethylene-terephthalate (MC-PET) foam on the temperature range of 21–210 �C in order to investigate the temperature-dependent performance of the applied parallel viscoelastic-viscoplastic material model. By means of carefully designed uniaxial mechanical tests in temperature chamber, the viscous, elastic and yielding behaviours of the investigated material are identified, which are then applied for selecting suitable viscoelastic-viscoplastic constitutive models. The material characterization process is conducted using finite- element-based fitting method, including also the analysis of the applied numerical optimization algorithm.
The fitting results are used to analyse the parameter sensitivity and to propose closed-form analytical relations for the temperature dependency of the material parameters. Finally, the utilisation of the analytical temperature functions for speeding up the parameter-fitting process is also demonstrated.
1. Introduction
Thermoforming is one of the most widely applied manufacturing processes since the beginning of the polymer industry. Using this pro- cess, a great variety of products can be manufactured with moderate costs including extremely thin parts with complex geometries as well.
During the process, the raw material sheet is heated up to the so-called forming temperature, where forming process is applied (e.g. using vacuum, compressed air or mechanical contact), which is followed by cooling to room temperature. The final geometry of the part is strongly dependent on the technological parameters of process e.g. temperature levels, rate of loading, holding times [1–3]. Due to the high sensitivity of the material behaviour on the technical parameters, the setting of proper production parameters is usually achieved after several tries, which might be very time-consuming and costly. However, the final shape may be adequately modelled using finite element (FE) simulation as it is discussed by Guzman-Maldonado et al. [4], which could also reduce the time and costs of production design. Additionally, such simulations can also be applied to assess the long-term behaviour of the thermoformed parts which is in high industrial demand due to the unreasonable amount of time required for the experimental investigations.
In order to perform FE simulation of the forming process with adequate accuracy, the thermoplastic material should be characterized
using accurate constitutive model including all relevant deformation behaviours occurring during the entire forming process. As several studies in the literature have revealed, the thermoplastic materials un- dergo large strains and deformations which show significant viscous, elastic and yielding characteristics with dominant temperature- dependent properties. Consequently, the constitutive model applied in FE simulations must be able to describe yielding properties with hard- ening, viscoelastic and elastic contributions. Nevertheless, the number of suitable models in the commercial finite element software (e.g.
Abaqus [5], Ansys [6], MSC Marc [7]) is limited. Moreover, these models were mostly proposed for metals, not polymers. Therefore, the development of advanced material models for characterising the com- plex mechanical behaviours of thermoplastics is currently a highly investigated field of computational solid mechanics.
In addition to the available models in FE software, a commercially available model family for solid polymers is the PolyUMod Library provided by Bergstr€om via Veryst Engineering [8]. This library includes the Three-Network Model (TNM) and the Parallel Network Model (PNM) proposed especially for modelling thermoplastics. These advanced models, however, contains high number of material parame- ters without including explicit temperature dependence. In addition, recent studies have also proposed viscoelastic and viscoplastic models for modelling temperature-dependent behaviour of various
* Corresponding author.
E-mail addresses: berezvai@mm.bme.hu (S. Berezvai), kossa@mm.bme.hu (A. Kossa).
Contents lists available at ScienceDirect
Polymer Testing
journal homepage: http://www.elsevier.com/locate/polytest
https://doi.org/10.1016/j.polymertesting.2020.106395
Received 26 November 2019; Received in revised form 25 January 2020; Accepted 2 February 2020
thermoplastic materials (including PLA and PVA core-shell nano fibres, PMMA, PLA, PC and isotactic PP) using parallel and serial configurations of the well-known rheological models combined with nonlinear viscoelastic-viscoplastic elements [9–18]. Whereas, the novel constitu- tive model proposed for temperature-dependent structural relaxation by Das et al. [19] also includes multiple time-scales using statistical ho- mogenization. Additionally, several studies investigated the yielding behaviour of thermoplastics based on cyclic tests utilizing kinematic hardening approach [20–22].
In this study the mechanical characterisation of a microcellular- polyethylene-terephthalate (MC-PET) material is presented using par- allel viscoelastic-viscoplastic constitutive models. Microcellular foaming technology was invented at Massachusetts Institute of Technology (MIT) by Martini et al. and patented in 1982 [23]. Microcellular foam mate- rials show excellent insulation and diffuse reflection properties, which can be achieved by relatively low production prices [24–26]. One of the possible fields of application of the such foams is in lighting (e.g. as lamp shells), which are manufactured using thermoforming process at tem- peratures above 200 �C, for which the proper temperature-dependent modelling at all relevant temperature levels (as discussed above) is essential. However, there is a lack in the literature regarding the experimental and numerical investigations of such foam materials at wide temperature-regime, which was the main motivation of our work.
Since the material behaviour changes significantly with increasing temperature, our goal was to apply a constitutive law such that char- acterize the material on the entire temperature domain with adequate accuracy. The proposed material model comprises of a Maxwell-type branch in parallel with an elastic-plastic model using isotropic hard- ening and associative flow rule with Mises yield function [26,27], while the nonlinear viscoelastic effect was modelled using strain- and time-hardening power-law creep models. This model-family is also commonly referred as two-layer viscoplastic model (TLVP) [5,28,29].
Additionally, the authors were also interested in the performance and the sensitivity of the proposed model, which is also discussed further in details. Moreover, in this contribution analytical functions are also proposed to describe the variation of viscous-elastic-plastic material parameters with temperature.
This paper is organized as follows. The investigated material and the mechanical tests are presented in Section 2. In Section 3, the applied parallel viscoelastic-viscoplastic models are summarized, while Section 4 presents the parameter strategy method and the performance of the material models. In Section 5 the analytical expressions for the temperature-dependent material parameters are proposed, while the benefits of such analytical functions are demonstrated via a case study.
Finally, the conclusions are summarized in Section 6.
2. Experiments 2.1. MC-PET material
The investigated material is a microcellular-polyethylene- terephthalate (MC-PET), which is currently under development.
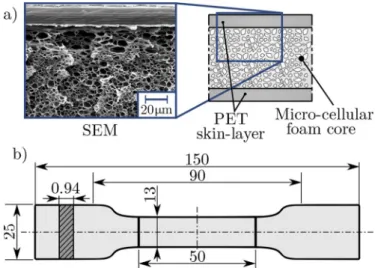
Compared to pure PET, the MC-PET material contains microcells which ensure excellent diffuse reflexion quantities. The foam is mainly used as lamp shells in different places, including extraor- dinary circumstances (e.g. extreme cold, high UV-radiation, etc …), thus there is significant need for an accurate material model describing the mechanical properties during the thermoforming process. The MC-PET foam is produced as sheets with thickness w¼ 0:94mm; from which standardised specimens (see Fig. 1/b) were cut. The microstructure of the foam consists of a thin PET skin-layer and a microcellular foam core, which is presented on the SEM image in Fig. 1/a. The skin-layer/foam core thickness ratio is approximately 1:5, while the size of the microcells is in the range of 5 10μm. Due to the foam core and the various deformation mechanisms of cellular structures [30], the mechanical properties
of the MC-PET foam significantly differ from the behaviour of the matrix PET material (e.g. reduced density, improved impact ab- sorption, etc…). Therefore, during material modelling we could not rely on the constitutive models and characteristics of single PET material.
2.2. Preliminary tests
In order to get preliminary information about the temperature- dependent behaviour of the material, the raw material was tested using sweep DMA test (dynamic mechanical analysis) in order to investigate the viscoelastic and the temperature-dependent properties.
The measured quantities are the storage modulus E’ representing the stored elastic energy and the loss modulus E’’ quantifying the energy dissipated as heat. The results of the DMA tests (see Fig. 2) shows that the mechanical properties significantly change at elevated tempera- tures. Based on the DMA curves, the glass-transition temperature Tg can be obtained using the inflection of the E’ðTÞor the maxima of E’’ðTÞ, namely Tg ¼90�C:
Beside the DMA tests, preliminary uniaxial tensile cyclic tests were also performed on the specimens in order to reveal and identify the deformation characteristics in the investigated temperature domain.
The uniaxial tests were performed using Zwick Roell Z010 Testing System with Zwick Xforce P load-cell with maximal load capacity of 1 kN. Additionally, for the temperature-dependent measurements an air- Fig. 1. The a) SEM image of microstructure of the investigated MC-PET foam and b) the specimen geometry for uniaxial tests with the markers for video extensometer.
Fig. 2. The results of the DMA tests: the variation of the storage modulus E’ and the loss modulus E’’ against temperature.
feed-based Zwick heat chamber was applied, which ensures uniform temperature distribution in the chamber. Note, that after reaching the required temperature, the specimen was laying in the chamber for 2 min to ensure that the whole volume of the specimen is heated up. During the heating up period the speed of temperature changing was approximately 12 K/min as it is provided in the heat chamber specification. The heat chamber and the applied specimen conditioning procedure ensure reli- able test results according to standards ISO 527-1, ASTM D618 and D638. The preliminary uniaxial cyclic tests consist of several loading- unloading cycles with increasing displacements in the temperature range of 21–210 �C, which is the usual regime of the thermoforming production process of this particular material in order to avoid the degradation of the microstructure which occurs at around 220–240 �C.
From the measured force-displacement curves the engineering stress P and the engineering strain were computed from the measured force F and displacement value u as
P¼F A0
andεeng¼ u
L0
; (1)
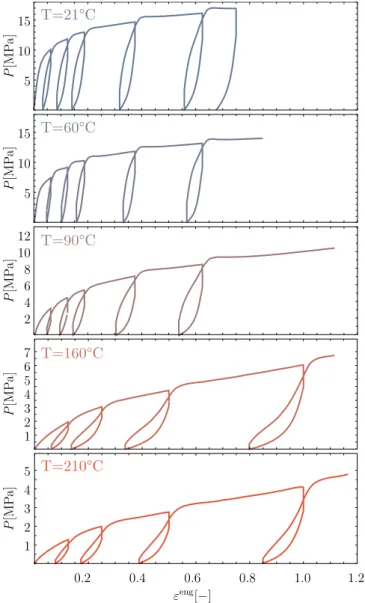
Where A0¼12:24mm2 and L0¼50mm are the initial cross-section and the initial gauge length. The measured curves (data points) are illustrated in Fig. 3. The results show that at all temperatures the
material behaviour shows stress relaxation properties and the perma- nent deformation after each cycle is also significant.
2.3. Uniaxial tensile tests
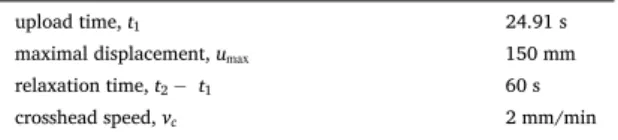
As the preliminary tests (DMA and cyclic) revealed, deformation of the MC-PET foam shows significant elastic, plastic and viscous proper- ties with significant temperature dependency. During the constitutive modelling, in order to reduce the computational time of the parameter fitting, the simplest test should be applied, which is also expected to involve both viscoelastic and viscoplastic properties. Therefore, uniaxial tensile tests have been performed using a single cycle with three loading steps, which is illustrated in Fig. 4: displacement-controlled uploading to umax with cross-head speed vc, then relaxation by holding the strain for tr¼60s and finally displacement-controlled unloading with vc until zero load is reached, namelyF ¼0N. The test parameters are summa- rized in Table 1.
As the DMA results indicated, the material behaviour significantly changes at around the glass transition temperature of 90 �C, therefore the investigated temperature values were not uniformly distributed in the regime of 21–210 �C as smaller temperature increments were applied around the glass transition temperature according to Ref. [31].
Consequently, the tests were performed at ten different temperature levels, namely 21 �C, 60 �C, 75 �C, 83 �C, 90 �C, 97 �C, 106 �C, 120 �C, 160 �C and 210 �C. The measured engineering-stress against time curves and the stress-strain curves are summarized in Fig. 5, respectively. The results show that temperature has significant softening effect on the overall mechanical behaviour. Furthermore, it can also be stated that the above glass transition temperature, due to the microstructural changes, significantly different behaviour occurs while the permanent deforma- tion at the end of the cycle, which can be quantified by uP (as indicated in Fig. 4), also increases.
3. Constitutive model
The constitutive model proposed for the characterization of the investigated MC-PET material at all temperature levels is a particular parallel viscoelastic-viscoplastic model, that is commonly referred as two-layer viscoplastic model (TLVP) [5,32]. The TLVP model one of the simplest parallel viscoelastic-viscoplastic model, which is comprised of a Maxwell-type nonlinear viscoelastic branch and an elastic-plastic network, respectively [32]. Among parallel viscoelastic-viscoplastic models the TLVP model is beneficial thanks to its simple structure and the relatively small number of parameters, whereas it is also imple- mented in the commercial FE software Abaqus [5]. The 1D representa- tion of the TLVP model is depicted in Fig. 6. Due to the parallel configuration, the total stress can be expressed additively as
σ¼σVþσP; (2)
where σV denotes the stress acting on the viscoelastic branch, whereas σP on the elastic-plastic network [5].
3.1. Elastic behaviour
The elastic behaviour of the material is modelled using linear
Fig. 3. The measured engineering stress – engineering strain curves in case of cyclic uniaxial tensile tests at temperatures of 21 �C, 60 �C, 90 �C, 160 �C and
210 �C. Fig. 4. The prescribed displacement during uniaxial test.
isotropic elasticity, which are represented by the elastic moduli EV and EP in the viscoelastic and the elastoplastic networks, respectively.
Therefore, the total elastic modulus E can be expressed as
E¼EPþEV: (3)
The ratio of EV and E is introduced as a new parameter f, the so-called fraction of elasticity (or elastic-ratio) for convenience as
f¼EV
E: (4)
In addition, as we assumed isotropic behaviour the Poisson’s ratio in both networks are identical, namely ν¼νP ¼νV.
Moreover, due to the large strains and deformations that the material behaviour shows, the linear isotropic elastic behaviour is modelled using finite strain approach, namely by the so-called hypoelastic model using the formulation for solid elements in Abaqus/Standard [5].
3.2. Nonlinear creep laws
In the proposed TLVP model, the nonlinear viscous behaviour is modelled through nonlinear creep laws which are also implemented in Abaqus [5]. Among several available creep laws, the so-called power-- law models are the most widely used models, thanks to their simplicity.
The models only consider deviatoric creep, therefore the governing differential equations are expressed using the Mises equivalent stress q,
defined as
q¼ ffiffiffiffiffiffiffiffiffiffiffi 3 2s:s r
; (5)
where s¼dev½σ� is the deviatoric stress tensor. In this study time- hardening and strain-hardening power-law models are investigated in detail. Note, that the time-hardening power-law model is mainly rec- ommended for slightly varying stress states, whereas the strain- hardening model can be applied also for varying stress states as well.
Additionally, both models assume that the stresses are low [5]. The governing equation of the creep strain rate for the time-hardening power-law is expressed as
ε_cr¼Aqntm; (6)
while in case of strain-hardening power-law, the expression becomes ε_cr¼ ðAqn½ðmþ1Þεcr�mÞmþ11; (7) Table 1
The uniaxial test parameters.
upload time, t1 24.91 s
maximal displacement, umax 150 mm
relaxation time, t2 t1 60 s
crosshead speed, vc 2 mm/min
Fig. 5.The measured uniaxial a) P t and b) P εeng curves and the corresponding c) 3D surface in the temperature domain of 21–210 �C.
Fig. 6. The 1D representation of the two-layer viscoplastic model.
Note, that the constitutive model was originally developed for polymers [28, 29], however, it is applied for high-temperature deformation of metals as well [33–35].
where A, n and m are parameters, while the equivalent creep strain is defined as
εcr¼
ffiffiffiffiffiffiffiffiffiffiffiffiffiffiffiffiffi 2 3εcr:εcr r
; and ε_cr¼
ffiffiffiffiffiffiffiffiffiffiffiffiffiffiffiffiffi 2 3ε_cr: _εcr r
: (8)
It should be noted, that for m¼0 both models reduce to the Norton-Hoff creep law, which is defined as
ε_cr¼Aqn: (9)
Beside the power-law creep models, there also exist more complex nonlinear creep laws (e.g. Anand, Darveaux and Double power). In these models, however, the number of material parameters are also higher, which makes the parameter-fitting even more difficult and uncertain, thus in the following only the power law models are discussed. During the numerical solution of the TLVP model using FE in Abaqus the ac- curacy of creep integration was controlled by the so-called creep strain error tolerance, for which value of 0:00005 was prescribed. This error tolerance determines the time increment so that the creep strain incre- ment is smaller than the elastic strain increment [5].
3.3. Elastic-plastic model
The elastic-plastic network was modelled using associative flow rule with Mises yield criterion, where the corresponding yield function is defined as
Φðσ;σYÞ ¼ ffiffiffiffiffiffiffiffiffiffiffi 3 2s:s r
σYðεpÞ; (10)
where σYðεpÞrepresents the uniaxial yield stress, which depends on the accumulated plastic strain, namely
εp¼ ffiffiffi 3 2
r Z t
0
ffiffiffiffiffiffiffiffiffiffiffiffiffi ε_p: _εp
p dτ: (11)
In our investigations, isotropic hardening rule was assumed. In order to obtain proper hardening curve, the cyclic tests were analysed in the true stress – true strain curve (see Fig. 7/a), where σ¼Pðεengþ1Þand ε¼ lnðεengþ1Þusing the volumetric incompressibility assumption. It should be noted that the elastic contribution in the strain involves volumetric strain, but it is negligible compared to the viscous and plastic strains.
Furthermore, the end points of each load steps were also detected, namely the end point of uploading/unloading and each relaxation steps as indicated by dot markers in Fig. 7/a.
In order to eliminate the viscoelastic-viscoplastic effects, it was assumed that the end points of each relaxation phase after uploading steps correspond to the long-term, pure elastic-plastic behaviour.
Therefore, the hardening curve can be approximated by a polynomial on the σ ε curves. Furthermore, the initial elastic modulus E was obtained as the initial slope of the true stress – true strain curve, which are listed in Table 2.
The total strain is additively decomposed to elastic and plastic con- tributions as ε¼εeþεp, the plastic strain values can be obtained (see Fig. 7/a) as
εpðε;σÞ ¼ε σ
E: (12)
Moreover, using the same steps, the fitted polynomial yield function against the true plastic strain can also be obtained, which defines the hardening curve. As the results in Fig. 7/b show, the hardening curves can be approximated with linear functions with good accuracy. Thus, in the proposed model linear isotropic hardening was applied, where the hardening rule is defined as
σYðεpÞ ¼σY0þHεp; (13)
where σY0 is the initial yield stress and H the plastic hardening modulus.
3.4. Summary of the model
To summarize, the proposed model for the investigated MC-PET foam is a simple parallel viscoelastic-viscoplastic model (the two-layer viscoplastic model) with nonlinear (strain or time) hardening power- law model for creeping in combination with linear isotropic hardening yield properties.
4. Parameter-fitting
Having chosen the viscous and elastic-plastic elements of the TLVP model, the material parameters should be fitted to the uniaxial tests with uploading, relaxation and unloading phases as presented in Fig. 5. Ac- cording the generally applied parameter fitting strategy, the error be- tween the model prediction and the measurement data is minimized. In case of the TLVP model, however, the stress solution cannot be expressed analytically, thus a FE-based parameter-fitting method is applied in this report [32].
The proposed TLVP model contains altogether eight material pa- rameters. The elastic behaviour is characterized by the elastic modulus E;the Poisson’s ratio ν and the fraction of elasticity f. The nonlinear viscous elements contain the power-law exponent m and power-law Fig. 7. The a) method for estimation of long-term behaviour and hardening law at 21 �C and b) the linear hardening curves at all investigated temperatures.
Table 2
Estimation of the elastic modulus as the initial slope of the cyclic tests.
Temperature [�C] E [MPa]
21 369.78
60 347.53
90 130.94
160 45.80
210 38.42
coefficients A and n, whereas the yield function is characterized by the initial yield stress σY0 and plastic hardening modulus H. The parameters should also fulfil the following constraints to ensure physically admis- sible results, namely
E;A;n;H;σY0>0; (14)
0<f <1; (15)
1<m<0: (16)
As the fitting was performed using uniaxial tensile tests, the Pois- son’s ratio has negligible effect on the stress result. Therefore, for minimizing the parameters to be fitted, the Poisson’s ratio is considered to be constant ν¼0:4 for all temperatures according to literature sug- gestions [27,32].
4.1. FE-based fitting method
The FE-based parameter fitting procedure was performed on a single, eight-node brick element with reduced integration, which is shown in Fig. 8. Boundary condition of zero displacement was prescribed on plane 1-2-3-4 in direction E1, on plane 3-4-7-8 in direction E2 and on plane 1- 5-8-4 in direction in direction E3, whereas the displacement U1 was prescribed on plane 5-6-7-8 in direction E1 according to the simplified uniaxial measurement data presented previously. Consequently, the uniaxial tests are idealized with homogeneous deformation for simplicity. During the fitting process the FE simulation of the idealized uniaxial test was performed and the resultant engineering stress values were exported in each iteration step.
The fitting process was defined to minimize the quality function, which can be calculated as the sum of squared differences (SSD) between the simulation results and the measured data as
SSD¼XN
i¼1
Pmeasi PFE tmeasi ��2
; (17)
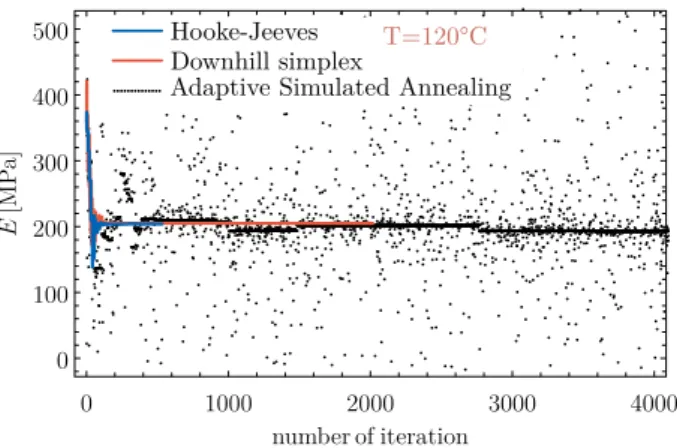
where Pmeasi tmeasi are the measured stress-time value data pairs, PFE is the stress values obtained from FE simulation, while N stands for the number of data points. This parameter fitting method is extremely time consuming, since a single iteration step lasts 20–25 s using a CPU with 3.1 GHz for the loading history used in the simulation. In order to reduce the fitting time, three numerical optimization algorithms were compared: Hooke-Jeeves (HJ), Downhill simplex (DS) and Adaptive Simulated Annealing (ASA). The DS method finds the local minima after simplex-operations based on function evaluations at the simplexes [36, 37]. The HJ algorithm searches the optima by simultaneously performed optimization using several trial solutions in the parameter-space [38], whereas the strategy of ASA method is based on random search with adaptive parameter control using temperature schedules mimicking heat treatment of metals [39]. After several trial-runs the HJ method was found to perform the best with respect to optimization time. As the
example on Fig. 9 shows the convergence of the elastic modulus at T¼ 120�C required 532, 2017 and 4035 iteration steps for the HJ, DS and ASA algorithms, respectively. Note, that since the ASA method based on random search the convergence can only be declared after a given number of unsuccessful tries in order to guarantee that no better solution can be obtained.
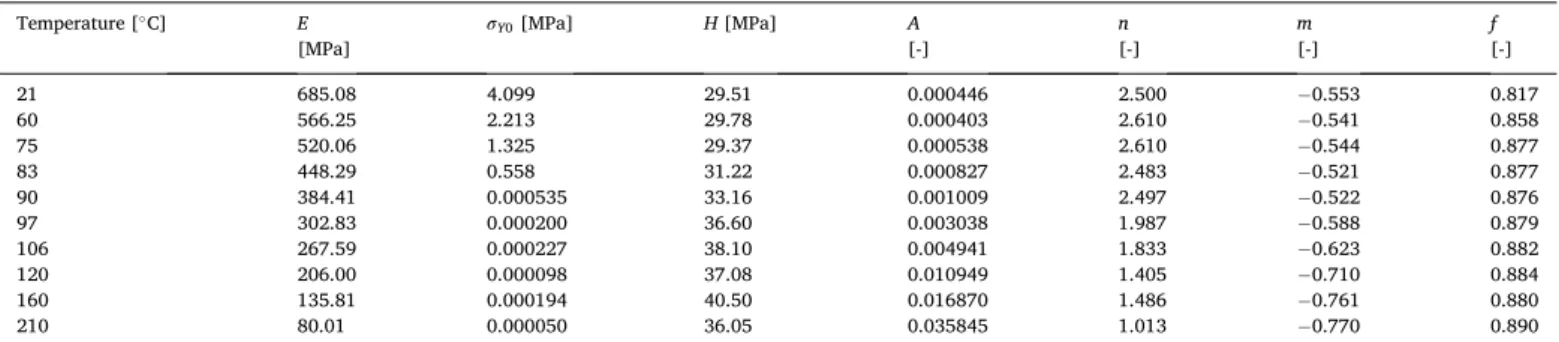
4.2. Fitting results: strain-hardening creeping
In case of the applied TLVP model using strain-hardening power-law creep model, the fitted material parameters are listed in Table 3, whereas Fig. 10 shows the fitted engineering stress-time curves at all investigated temperature levels.
Furthermore, the sensitivity of the model was also investigated using Monte-Carlo simulation, where a relative parameter error of δP¼ �0 10% was introduced for each fitted parameter. After performing the FE simulation of the simplified uniaxial extension problem for each com- bination of parameters with errors of �1%;�2%�5%and �10%, the so-called uncertainty region could be introduced as the envelope of the resultant engineering stress – time curves (see the grey shaded areas in Fig. 10). The results show, that the TLVP model can characterize the viscous-elastic-plastic behaviour of the investigated MC-PET material with excellent accuracy. However, at elevated temperatures (tempera- tures above the glass-transition temperature of Tg ¼90�C) the sensi- tivity of the model indicated by the uncertainty region, significantly increases.
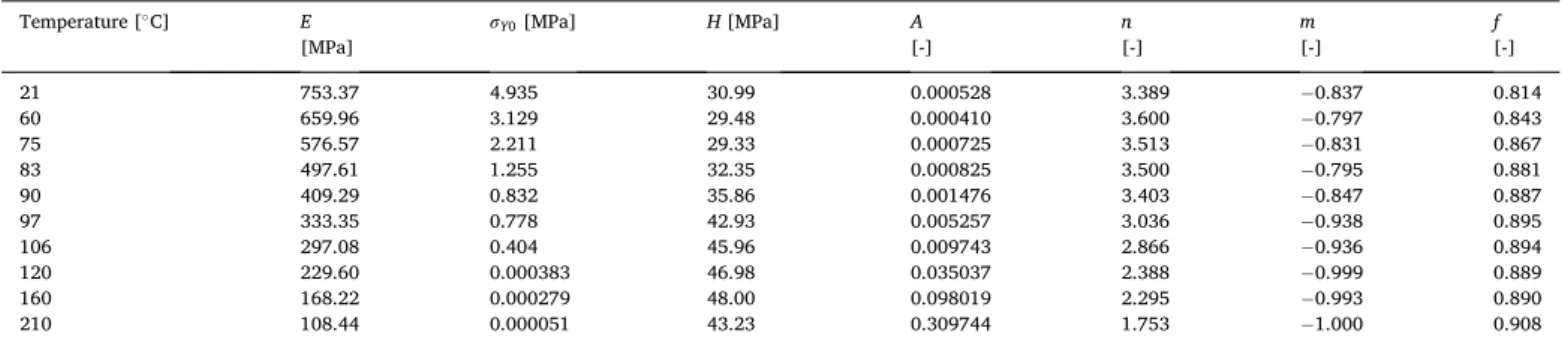
4.3. Fitting results: time-hardening creeping
Similarly, the results in case of time-hardening power-law creep model can be summarized via the parameter table (see Table 4) and by the comparison of measured engineering stress-time curves with the model prediction using the fitted parameters in Fig. 11. In the latter case, the sensitivity of the model is quantified by the uncertainty-region ob- tained by Monte-Carlo simulations as introduced previously.
As the results show, this model is also able to characterize the ma- terial behaviour with adequate accuracy at all temperature levels. In addition, the sensitivity analysis also shows similar results to the case of TLVP model with strain-hardening creep law.
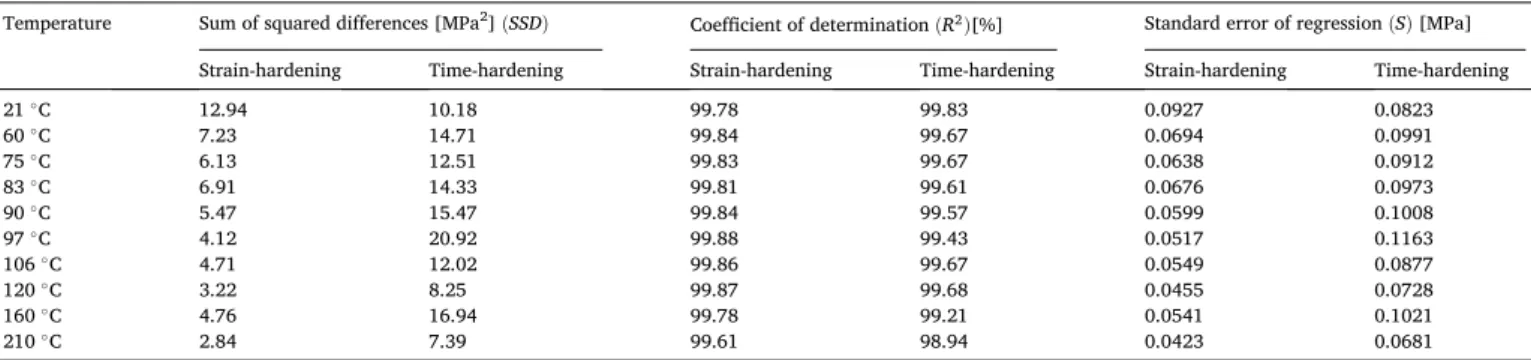
4.4. Comparison of the models
The performance of the fitted models can also be analysed by the coefficient of determination R2 which is a widely used measure to demonstrate the accuracy of a fitting process:
Fig. 8. The FE model for parameter fitting. Fig. 9.The comparison of numerical algorithms (HJ, DS, ASA) for the convergence of the elastic modulus at T ¼120�C.
R2¼1
PN
i¼1 Pmeasi Pfiti �2
PN
i¼1Pmeasi P�2; (18)
where P is the mean of the experimental engineering stress values. The value of R2 should satisfy 0<R2�1, where R2¼1 represents the perfect fit. This quantity, however, can give accurate result only if the curve is monotonously increasing, therefore for nonlinear curves another quantity, namely the standard error of regression ðSÞis rec- ommended [40,41], where
S¼ ffiffiffiffiffiffiffiffiffiffiffiffi
SSD N 2 r
: (19)
The calculated values characterizing the goodness of the fitting are listed in Table 5. It should be noted that values of SSD and S are not normalized, therefore the temperature-dependent tendency can only be obtained from the variation of R2. According to Fig. 12 the accuracy of the model prediction slightly decreases at the highest temperatures.
Although, the R2 values are always above 98.9%, which means that both models can be applied for characterizing the material with good accu- racy. The goodness of fitting also indicates that the strain-hardening Table 3
The fitted material parameters of the investigated microcellular foam using strain-hardening power-law creep model.
Temperature [�C] E
[MPa]
σY0 [MPa] H [MPa] A
[-] n
[-] m
[-] f
[-]
21 685.08 4.099 29.51 0.000446 2.500 0.553 0.817
60 566.25 2.213 29.78 0.000403 2.610 0.541 0.858
75 520.06 1.325 29.37 0.000538 2.610 0.544 0.877
83 448.29 0.558 31.22 0.000827 2.483 0.521 0.877
90 384.41 0.000535 33.16 0.001009 2.497 0.522 0.876
97 302.83 0.000200 36.60 0.003038 1.987 0.588 0.879
106 267.59 0.000227 38.10 0.004941 1.833 0.623 0.882
120 206.00 0.000098 37.08 0.010949 1.405 0.710 0.884
160 135.81 0.000194 40.50 0.016870 1.486 0.761 0.880
210 80.01 0.000050 36.05 0.035845 1.013 0.770 0.890
Fig. 10. The comparison of the uniaxial measurement data and the fitted TLVP model using strain-hardening power-law creep model including the uncertainty region for at least 10% relative error for each parameter.
power law creep model shows better accuracy compared to the time- hardening one, nearly all temperatures, but especially at the highest ones.
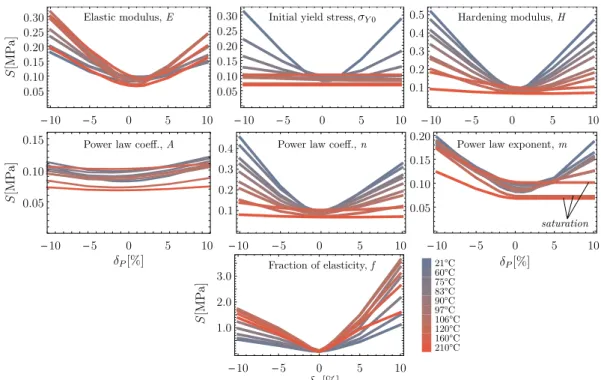
4.5. Parameter-sensitivity
Beside the analysis of global sensitivity using uncertainty regions, the sensitivity of each parameter can also be obtained using Monte-Carlo simulation method again. This case, only a single parameter was per- turbed with δP relative parameter error of �1%;
�2%�5%and �10%, and the resulted curves was compared using
standard error of regression as in Eq. (19). The resultant curves are presented in Figs. 13-14, from which the effect of each parameter can be obtained. As the results show, the parameter f (fraction of elasticity) has the largest effect on the global sensitivity. It should be emphasized that the initial yield stress decreases approximately to zero, therefore it has no effect on the global error above the glass transition temperature. In case of the viscous parameters, the error varies on the same scale for all three viscous parameters (A, n and m). Note, that in case of the time- hardening power-law at temperatures 106–210 �C the fitted value for the power law exponent m lays close to the boundary of the possible parameter range ( 1<m<0), Consequently, the effect of positive Table 4
The fitted material parameters of the investigated microcellular foam using time-hardening power-law creep model.
Temperature [�C] E
[MPa]
σY0 [MPa] H [MPa] A
[-] n
[-] m
[-] f
[-]
21 753.37 4.935 30.99 0.000528 3.389 0.837 0.814
60 659.96 3.129 29.48 0.000410 3.600 0.797 0.843
75 576.57 2.211 29.33 0.000725 3.513 0.831 0.867
83 497.61 1.255 32.35 0.000825 3.500 0.795 0.881
90 409.29 0.832 35.86 0.001476 3.403 0.847 0.887
97 333.35 0.778 42.93 0.005257 3.036 0.938 0.895
106 297.08 0.404 45.96 0.009743 2.866 0.936 0.894
120 229.60 0.000383 46.98 0.035037 2.388 0.999 0.889
160 168.22 0.000279 48.00 0.098019 2.295 0.993 0.890
210 108.44 0.000051 43.23 0.309744 1.753 1.000 0.908
Fig. 11. The comparison of the uniaxial measurement data and the fitted TLVP model using time-hardening power-law creep model including the uncertainty region for at least 10% relative error for each parameter.
relative errors (δP>0) cannot be analysed. Thus, the error considered to be saturated, which is indicated in Fig. 13.
5. Temperature-dependency of parameters
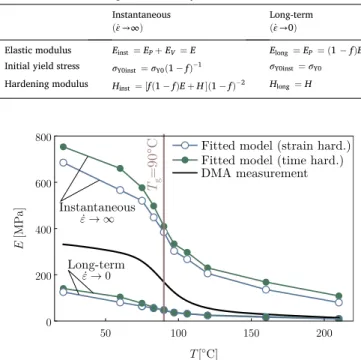
The result of the parameter fitting provides information about the temperature-dependence of the material parameters. This can be uti- lized as a validation method of the fitting by comparing the variation of elastic modulus with the DMA results. As it was introduced previously in Ref. [27], long-term and instantaneous boundary models can be intro- duced for the TLVP model by substituting the nonlinear dashpot element with breakage and short-circuit, respectively. As it is discussed in Refs.
[42,43], in case of long-term behaviour, which is defined as ε_→0, the dashpot element deforms without any stress merging, thus the dashpot can be substituted with a breakage (see Fig. 15). Moreover, when we assume instantaneous behaviour, namely ε_→∞, the viscous element becomes infinitely stiff, thus only the elastic element deforms in the viscoelastic branch. Consequently, both cases can be represented with pure elastic-plastic models. The corresponding material parameters in the elastic-plastic boundary models are summarized in Table 6.
Using the previously introduced models, the long-term and instan- taneous elastic moduli can be obtained for all temperatures using both Table 5
The fitted material parameters of the investigated microcellular foam using time-hardening power-law creep model.
Temperature Sum of squared differences [MPa2] ðSSDÞ Coefficient of determination ðR2Þ[%] Standard error of regression ðSÞ[MPa]
Strain-hardening Time-hardening Strain-hardening Time-hardening Strain-hardening Time-hardening
21 �C 12.94 10.18 99.78 99.83 0.0927 0.0823
60 �C 7.23 14.71 99.84 99.67 0.0694 0.0991
75 �C 6.13 12.51 99.83 99.67 0.0638 0.0912
83 �C 6.91 14.33 99.81 99.61 0.0676 0.0973
90 �C 5.47 15.47 99.84 99.57 0.0599 0.1008
97 �C 4.12 20.92 99.88 99.43 0.0517 0.1163
106 �C 4.71 12.02 99.86 99.67 0.0549 0.0877
120 �C 3.22 8.25 99.87 99.68 0.0455 0.0728
160 �C 4.76 16.94 99.78 99.21 0.0541 0.1021
210 �C 2.84 7.39 99.61 98.94 0.0423 0.0681
Fig. 12. Variation of R2 against temperature for strain- and time-hardening creep laws.
Fig. 13.Sensitivity of the fitted parameters in case of TLVP model with strain-hardening creep.
creep models, respectively. If we compare the variation of these curve against the temperature with the DMA results (see Fig. 16), it can be clearly seen that the DMA measurement lays always in between the long- term and instantaneous responses, since the DMA measurement was performed with finite deformation speed.
For the boundary models, the glass transition temperature was also determined as the inflection of the curves, which is in accordance with the standard ISO 6721-11. As a result of the numerical interpolation and
derivation, the glass transition temperature was found to be Tstraing ¼ 91:3�C and Ttimeg ¼87:7�C respectively. This means, that the parameter fitting and the DMA measurement are in excellent agreement.
5.1. Analytical parameter-functions
Beside the elastic modulus, all other material parameters, which characterize yielding and creeping, could also be analysed as function of Fig. 14.Sensitivity of the fitted parameters in case of TLVP model with time-hardening creep.
Fig. 15.The introduction of the elastic-plastic boundary models for the TLVP model representing the long-term and instantaneous behaviour.
the temperature. The characteristics in Fig. 17 show clear tendencies only with moderate numerical noise. In the literature a possible solution to describe the temperature dependency of material parameters is by introducing closed-form functions, usually in polynomial form [14].
Although, it can also be seen, that in the neighbourhood of the glass transition temperature, there is a significant change in all parameter value. Consequently, it is preferable to include Tg as internal parameter in the analytical temperature-dependent parameter functions as applied in Refs. [31,44]. In our approach to finding suitable functions we tried several possibilities; the chosen functions have the form:
EðTÞ ¼E1arctan� E2 T Tg
��þE3; (20)
σY0ðTÞ ¼
�Y2 T Tg
�2
þY1 T Tg
�þY0 T�Tg
Y3 T Tg
�þY0 T>Tg
; (21)
HðTÞ ¼H1arctan� H2 T Tg
��þH3; (22)
AðTÞ ¼
� A1 T Tg
�þA0 T�Tg
A3 T Tg
�2
þA2 T Tg
�þA0 T>Tg
; (23)
nðTÞ ¼n1arctan�
n2 T Tgþn3
��þn4; (24)
mðTÞ ¼m1arctan�
m2 T Tgþm3
��þm4; (25)
fðTÞ ¼
�f1 T Tg
�þf0 T�Tg
f2 T Tg
�þf0 T>Tg
: (26)
As the functions show, the elastic modulus E, the hardening modulus H, the power-law coefficient n and exponent m show similar tendency according to the arctangent function. Whereas, the initial yield stress σY0, the power-law coefficient A and the fraction of elasticity f can be described using piecewise polynomials. The numerical values of the parameters in Eqs. 20–26 are listed in Table 7. The variation of material parameters shows great agreement with the change of material behav- iour of thermoplastics around the glass transition temperature as sum- marized in Ref. [8]. Above Tg large segmental motions are activated, and the polymer starts to behave more fluid-like, as indicated by increasing A and f parameters, while the elastic modulus and the initial yield stress significantly drops.
5.2. Case study: improved fitting
The previously introduced analytical functions not only express the relation of temperature and the parameter values, but also can be uti- lized for initializing the fitting. As it was discussed above, the FE-based parameter fitting procedure could be extremely time-consuming and furthermore also very sensitive to the initial parameter values. The proposed analytical functions contain only 2-4 parameters, therefore based on approximately 3 fitting (e.g. at room temperature, at Tg and at the maximum temperature), the analytical function parameters in Eqs.
20–26 can be fitted. This approach was motivated by the model of Dupaix, where temperature-dependent shear modulus function is fitted Table 6
Parameters of the elastic-plastic boundary models.
Instantaneous ð_ε→∞Þ
Long-term ð_ε→0Þ
Elastic modulus Einst¼EPþEV ¼E Elong¼EP¼ ð1 fÞE Initial yield stress σY0inst¼σY0ð1 fÞ1 σY0inst¼σY0 Hardening modulus Hinst¼ ½fð1 fÞEþH�ð1 fÞ2 Hlong¼H
Fig. 16. Comparison of the DMA results and the boundary models for the fitted strain- and time-hardening power-law TLVP models.
Fig. 17.The temperature-dependency of material parameters and the fitted analytical functions for strain- and time-hardening power-law TLVP models.
to measurements below and above glass transition temperature [31,44].
After evaluating the function at all other temperature levels, this could give a possible guess for the initial parameters and ensures significantly faster fitting. This flowchart of this fitting algorithm is illustrated in Fig. 18.
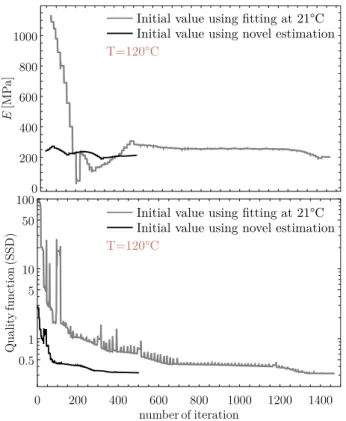
The benefit of this method is presented via a case study of elastic modulus fitting at 120 �C using TLVP with strain-hardening power-law.
As we perform the fitting for 21 �C, 60 �C and 210 �C using the originally proposed method, the numerical values of E21¼753:37MPa; E60¼ 659:96MPa and E210¼108:44MPa were received. After fitting the analytical function in Eq. (20) to these numerical data
E*ðTÞ ¼255:36 arctan½ 0:0356ðT 90Þ� þ450:89 (27) was received from which the initial value for the fitting at 120 �C becomes
E*ð120Þ ¼241:82MPa: (28)
As Fig. 19 shows, the fitting process started with this value needs only 514 iteration steps, while the same fitting started from the room- temperature result of E21¼753:37MPa needed 1487 iterations.
Therefore, the time needed to finalize fitting could be reduced to its third by properly chosen initial values based on the analytical parameter functions proposed above.
6. Conclusions
In this paper, a detailed mechanical characterization was presented for a microcellular polyethylene-terephthalate foam material using the
two-layer viscoplastic model on the temperature domain which is rele- vant for thermoforming applications.
The main contributions are: (i) the experimental observation of the material behaviour at the entire temperature domain; (ii) the proposal of a simple parallel viscoelastic-viscoplastic (or TLVP) model for charac- terizing the material behaviour on the whole temperature domain; (iii) the proposed FE-based parameter fitting strategy; (iv) the analytical functions for temperature-dependent material parameters.
The experimental observations and the parameter and temperature sensitivity analyses lead to the following conclusions.
� The temperature has significant effect on the material behaviour, especially above the glass transition temperature where the viscous properties become more dominant as indicated by the increasing values of parameter f.
Table 7
Parameters of the analytical temperature-dependent parameter functions.
Parameter Strain-hardening Time-hardening Parameter Strain-hardening Time-hardening
E1 [MPa] 223.7 236.2 A0 [-] 0.0013 0.0034
E2 [MPa] 0.039 0.043 A1 [-] 0.000018 0.0000585
E3 [MPa] 390.4 440.4 A2 [-] 0.000211 0.0000293
Y0 [MPa] 0.1506 0.1403 A3 [-] 0 0.0000208
Y1 [MPa] 0.0809 0.1372 n1 [-] 0.4895 0.5613
Y2 [MPa] 0.000334 0.000988 n2 [-] 0.0943 0.0740
Y3 [MPa] 0.000849 0.00165 n3 [-] 1.9418 2.7969
H1 [MPa] 2.856 5.434 n4 [-] 11.909 17.621
H2 [MPa] 0.239 0.983 m1 [-] 0.0794 0.0584
H3 [MPa] 33.67 37.67 m2 [-] 0.1226 0.280
f0 [-] 0.888 0.887 m3 [-] 0.646 0.898
f1 [-] 0.00101 0.00113 m4 [-] 18.98 4.72
f2 [-] 0.00066 0.0014
Fig. 18. The flowchart of the fitting method utilizing the analytical parameter functions for initializing numerical parameter values.
Fig. 19. The comparison of the parameter fitting at T ¼120 �C with strain- hardening TLVP model using initial values from original room-temperature fitting and novel analytical estimations.
�Similarly, the viscoplastic behaviour is changes significantly above Tg, since the initial yield stress drops down to zero.
�The accuracy of strain- and time-hardening power-law creep models are close to each other, however at the highest temperatures the strain-hardening model is slightly stable and accurate. This behav- iour is confirmed by the sensitivity of material parameters at elevated temperatures.
�Among the eight investigated parameters, the fraction of elasticity f is the most critical from the point of robustness, while the sensitivity of other parameters lays nearly in the same range.
�The variation of material parameters against temperature shows either piecewise polynomial characteristic (parameters σY0;A;f), or smooth transition accordingly to arctangent function (parameters E; H;n;m), including for both cases significant change at the glass transition temperature.
Nevertheless, the most important conclusion is that the two-layer viscoplastic model with linear hardening and strain- or time- hardening power-law creep model can characterize the material behaviour at all temperatures with adequate accuracy.
The result of this paper can further be used to perform FE simulation of thermoforming processes with the proposed temperature-dependent material parameters. The analytical functions enable us to improve the FE-based parameter-fitting for similar materials. Furthermore, the analysis also revealed some drawbacks of the model including the high sensitivity and decreased accuracy at high temperature levels. Thus, the obtained results will be utilized in the further development of viscoelastic-viscoplastic models (serial and parallel), which is an important step of future research work.
Funding
This research was supported by the J�anos Bolyai Research Scholar- ship of the Hungarian Academy of Sciences and Hungarian National Research, Development and Innovation Office (NKFI FK 128662) and by the National Talent Programme of the Ministry of Human Capacites, Hungary. The research reported in this paper was supported by the Higher Education Excellence Program (NFTO-19-B-0053) of the Minis- try of Human Capacities in the frame of Nanotechnology research area of Budapest University of Technology and Economics (BME FIKP-NANO).
Data availability
The raw/processed data required to reproduce these findings cannot be shared at this time as the data also forms part of an ongoing study.
Declaration of competing interest
The authors declare that they have no known competing financial interests or personal relationships that could have appeared to influence the work reported in this paper.
CRediT authorship contribution statement
Szabolcs Berezvai: Conceptualization, Methodology, Visualization, Investigation, Writing - original draft, Writing - review & editing. Attila Kossa: Funding acquisition, Supervision.
Acknowledgement
The MC-PET foam specimens were provided by Furukawa Electric Institute of Technology (FETI) Ltd., Hungary, which support is gratefully acknowledged.
Appendix A. Supplementary data
Supplementary data to this article can be found online at https://doi.
org/10.1016/j.polymertesting.2020.106395.
References
[1] P. Klein, Fundamentals of plastics thermoforming, Synth. Lect. Mater. Eng. 1 (2009) 1–97, https://doi.org/10.2200/S00184ED1V01Y200904MRE001.
[2] P. Schwarzmann, Thermoforming, Carl Hanser Verlag GmbH & Co. KG, München, 2018, https://doi.org/10.3139/9781569907092.
[3] J.L. Throne, Understanding Thermoforming, Carl Hanser Verlag GmbH & Co. KG, München, 2008, https://doi.org/10.3139/9783446418554.
[4] E. Guzman-Maldonado, N. Hamila, N. Naouar, G. Moulin, P. Boisse, Simulation of thermoplastic prepreg thermoforming based on a visco-hyperelastic model and a thermal homogenization, Mater. Des. 93 (2016) 431–442, https://doi.org/
10.1016/j.matdes.2015.12.166.
[5] Dassault Systemes, ABAQUS 2018 Documentaion, 2018.
[6] ANSYS Inc, ANSYS® Academic Research Mechanical, Release, 2019, 2019.
[7] MSC Software Corporation, MSC Marc Reference Manual, 2019.
[8] J€orgen Bergstrom, Mechanics of Solid Polymers, Elsevier, 2015, https://doi.org/ € 10.1016/C2013-0-15493-1.
[9] H.F. Alharbi, M. Luqman, H. Fouad, K.A. Khalil, N.H. Alharthi, Viscoelastic behavior of core-shell structured nanofibers of PLA and PVA produced by coaxial electrospinning, Polym. Test. 67 (2018) 136–143, https://doi.org/10.1016/j.
polymertesting.2018.02.026.
[10] P. Yu, X. Yao, Q. Han, S. Zang, Y. Gu, A visco-elastoplastic constitutive model for large deformation response of polycarbonate over a wide range of strain rates and temperatures, Polymer 55 (2014) 6577–6593, https://doi.org/10.1016/j.
polymer.2014.09.071.
[11] F. Shen, G. Kang, Y.C. Lam, Y. Liu, K. Zhou, Thermo-elastic-viscoplastic-damage model for self-heating and mechanical behavior of thermoplastic polymers, Int. J.
Plast. (2019) 1–17, https://doi.org/10.1016/j.ijplas.2019.06.003.
[12] M.R. Adibeig, S. Hassanifard, F. Vakili-Tahami, Optimum creep lifetime of Polymethyl Methacrylate (PMMA) tube using rheological creep constitutive models based on experimental data, Polym. Test. 75 (2019) 107–116, https://doi.org/
10.1016/j.polymertesting.2019.01.016.
[13] P. Gelineau, S. Weigand, L. Cauvin, F. B�edoui, Compatibility effects of modified montmorillonite on elastic and visco-elastic properties of nano-reinforced Poly (lactic acid): experimental and modeling study, Polym. Test. 70 (2018) 441–448, https://doi.org/10.1016/j.polymertesting.2018.06.020.
[14] B. Chang, X. Wang, Z. Long, Z. Li, J. Gu, S. Ruan, C. Shen, Constitutive modeling for the accurate characterization of the tension behavior of PEEK under small strain, Polym. Test. 69 (2018) 514–521, https://doi.org/10.1016/j.
polymertesting.2018.06.003.
[15] J.G. Lee, R.W. Flumerfelt, A refined approach to bubble nucleation and polymer foaming process: dissolved gas and cluster size effects, J. Colloid Interface Sci. 184 (1996) 335–348, https://doi.org/10.1006/jcis.1996.0628.
[16] F. Luo, X. Liu, C. Yan, H. Liu, M. Dong, X. Mai, C. Shen, C. Liu, J. Zhang, N. Wang, Z. Guo, Molecular orientation dependent dynamic viscoelasticity in uni-axially drawn polycarbonate, Polym. Test. 69 (2018) 528–535, https://doi.org/10.1016/j.
polymertesting.2018.06.009.
[17] X. Wang, Y. Pan, Y. Qin, M. Voigt, X. Liu, G. Zheng, Q. Chen, D.W. Schubert, C. Liu, C. Shen, Creep and recovery behavior of injection-molded isotactic polypropylene with controllable skin-core structure, Polym. Test. 69 (2018) 478–484, https://doi.
org/10.1016/j.polymertesting.2018.05.040.
[18] J. Jiang, X. Liu, M. Lian, Y. Pan, Q. Chen, H. Liu, G. Zheng, Z. Guo, D.W. Schubert, C. Shen, C. Liu, Self-reinforcing and toughening isotactic polypropylene via melt sequential injection molding, Polym. Test. 67 (2018) 183–189, https://doi.org/
10.1016/j.polymertesting.2018.03.005.
[19] S. Das, S. Roy Chowdhury, D. Roy, A constitutive model for thermoplastics based on two temperatures, Eur. J. Mech. Solid. 72 (2018) 440–451, https://doi.org/
10.1016/j.euromechsol.2018.06.010.
[20] H.S. da Costa Mattos, J.M.L. Reis, L.G.M.O. de Medeiros, A.H. Monteiro, S.C.
S. Teixeira, E.G. Chaves, Analysis of the cyclic tensile behaviour of an elasto- viscoplastic polyamide, Polym. Test. 58 (2017) 40–47, https://doi.org/10.1016/j.
polymertesting.2016.12.009.
[21] E.P. Motta, J.M.L. Reis, H.S. da Costa Mattos, Analysis of the cyclic tensile behaviour of an elasto-viscoplastic polyvinylidene fluoride (PVDF), Polym. Test. 67 (2018) 503–512, https://doi.org/10.1016/j.polymertesting.2018.03.012.
[22] J.L. Chaboche, O. Jung, Application of a kinematic hardening viscoplasticity model with thresholds to the residual stress relaxation, Int. J. Plast. 13 (1997) 785–807, https://doi.org/10.1016/S0749-6419(97)00066-1.
[23] J.E. Martini-Vvedensky, N.P. Suh, F.A. Waldman, Microcellular Closed Cell Foams and Their Method of Manufacture, US4473665A, 1982.
[24] R. Guan, B. Xiang, Z. Xiao, Y. Li, D. Lu, G. Song, The processing–structure relationships in thin microcellular PET sheet prepared by compression molding, Eur. Polym. J. 42 (2006) 1022–1032, https://doi.org/10.1016/j.
eurpolymj.2005.11.018.
[25] G. Lu, W.D. van Driel, X. Fan, M. Yazdan Mehr, J. Fan, K.M.B. Jansen, G.Q. Zhang, Degradation of Microcellular PET reflective materials used in LED-based products, Opt. Mater. 49 (2015) 79–84, https://doi.org/10.1016/j.optmat.2015.07.026.
[26] S. Berezvai, A. Kossa, Characterization of a thermoplastic foam material with the two-layer viscoplastic model, Mater. Today Proc. 4 (2017) 5749–5754, https://doi.
org/10.1016/j.matpr.2017.06.040.
[27] S. Berezvai, A. Kossa, D. Bachrathy, G. Stepan, Numerical and experimental investigation of the applicability of pellet impacts for impulse excitation, Int. J.
Impact Eng. 115 (2018) 19–31, https://doi.org/10.1016/j.ijimpeng.2018.01.006.
[28] J. Kichenin, Comportement Thermom�ecanique du Poly�ethyl�ene – application aux structures gazieres, Ecole Polytechnique, Paris, 1992.
[29] J. Kichenin, K. Van Dang, K. Boytard, Finite-element simulation of a new two- dissipative mechanisms model for bulk medium-density polyethylene, J. Mater.
Sci. 31 (1996) 1653–1661, https://doi.org/10.1007/BF00357878.
[30] L.J. Gibson, M.F. Ashby, Cellular Solids, Cambridge University Press, 1997, https://doi.org/10.1017/CBO9781139878326.
[31] R.B. Dupaix, M.C. Boyce, Constitutive modeling of the finite strain behavior of amorphous polymers in and above the glass transition, Mech. Mater. 39 (2007) 39–52, https://doi.org/10.1016/j.mechmat.2006.02.006.
[32] S. Berezvai, A. Kossa, Characterization of a thermoplastic foam material with the two-layer viscoplastic model, Mater. Today Proc. 4 (2017) 5749–5754, https://doi.
org/10.1016/j.matpr.2017.06.040.
[33] E. Charkaluk, A. Bignonnet, A. Constantinescu, K. Dang Van, Fatigue design of structures under thermomechanical loadings, Fatig. Fract. Eng. Mater. Struct. 25 (2002) 1199–1206, https://doi.org/10.1046/j.1460-2695.2002.00612.x.
[34] S.B. Leen, A. Deshpande, T.H. Hyde, Experimental and numerical characterization of the cyclic thermomechanical behavior of a high temperature forming tool alloy, J. Manuf. Sci. Eng. 132 (2010), 051013, https://doi.org/10.1115/1.4002534.
[35] R. Solasi, Y. Zou, X. Huang, K. Reifsnider, A time and hydration dependent viscoplastic model for polyelectrolyte membranes in fuel cells, Mech. Time- Dependent Mater. 12 (2008) 15–30, https://doi.org/10.1007/s11043-007-9040-7.
[36] W. Spendley, G.R. Hext, F.R. Himsworth, Sequential application of simplex designs in optimisation and evolutionary operation, Technometrics 4 (1962) 441, https://
doi.org/10.2307/1266283.
[37] J.A. Nelder, R. Mead, A simplex method for function minimization, Comput. J. 7 (1965) 308–313, https://doi.org/10.1093/comjnl/7.4.308.
[38] R. Hooke, T.A. Jeeves, ‘Direct search’ solution of numerical and statistical problems, J. ACM 8 (1961) 212–229, https://doi.org/10.1145/321062.321069.
[39] L. Ingber, Adaptive simulated annealing (ASA): lessons learned, Contr. Cybern. 25 (1996) 33–54.
[40] T.O. Kva�Lseth, Note on the R2 measure of goodness of fit for nonlinear models, Bull. Psychonomic Soc. 21 (1983) 79–80, https://doi.org/10.3758/BF03329960.
[41] A.-N. Spiess, N. Neumeyer, An evaluation of R2 as an inadequate measure for nonlinear models in pharmacological and biochemical research: a Monte Carlo approach, BMC Pharmacol. 10 (2010) 6, https://doi.org/10.1186/1471-2210-10- [42] D. R, E.K.W. Michael Lai, Introduction to Continuum Mechanics, Elsevier, 2010, 6.
https://doi.org/10.1016/B978-0-7506-8560-3.X0001-1.
[43] R.M. Guedes, Creep and Fatigue in Polymer Matrix Composites, Elsevier, 2019, https://doi.org/10.1016/C2017-0-02292-9.
[44] P. Hempel, Constitutive Modeling of Amorphous Thermoplastic Polymers with Special Emphasis on Manufacturing Processes, Karlsruher Institut für Technologie, 2016, https://doi.org/10.5445/KSP/1000056493.