DOI: 10.1556/606.2018.13.3.16 Vol. 13, No. 3, pp. 163–174 (2018) www.akademiai.com
ANALYSIS OF FUTURE CHANGES IN THE TRENDS AND SCALING COEFFICIENTS FOR SHORT-TERM
RAINFALL IN SOUTHWESTERN SLOVAKIA
1 Gabriel FÖLDES, 2 Silvia KOHNOVÁ, 3 Kamila HLAVČOVÁ
1,2,3 Department of Land and Water Resources Management, Faculty of Civil Engineering
Slovak University of Technology Bratislava, Radlinského 11, 810 05 Bratislava Slovak Republic
e-mail: 1gabriel.foldes@stuba.sk, 2silvia.kohnova@stuba.sk, 3kamila.hlavcova@stuba.sk Received 21 December 2017; accepted 30 April 2018
Abstract: The study focuses on an analysis of the future changes in short-term rainfall in the southwestern region of Slovakia. The analysis was performed for three climatological stations, i.e.
Bratislava-Koliba, Gabčíkovo and Sereď, where short-term rainfall intensities with durations of 60 to 1440 minutes were analyzed using historical observations and future regional climate models. The study focuses on detecting changes in rainfall trends and changes in the values of the scaling coefficients. In final, there is a comparison of the design values of short-term rainfall derived for a future horizon with historical observations and the conclusion that rainfall intensities in the region analyzed will increase in the future and that this should be taken into consideration when designing water structures to ensure their safety.
Keywords: Short-term rainfall, Trend analysis, Scaling, Design values, Regional climate models scenarios
1. Introduction
Climate change has occurred throughout the Earth’s history. Most of these climatic changes can be attributed to very small deviations of the Earth’s orbit, which have resulted in changes in the amount of solar energy received by Earth. Current trends in climate change are of particular importance because most of them are caused by anthropogenic activity. This change is due to a higher concentration of greenhouse gases in the atmosphere. Extreme precipitation of a short duration is increasingly occurring across Europe and has become one of the most common natural hazards.
During flash floods, high amounts of intense rainfall are observed, which are often
associated with big economic damages. There are studies that deal with flash floods, and heavy rainfalls problematic e.g. flash flood mitigation modeling [1], simulation of flood progress on the River Gidra [2], very short-term heavy rainfall prediction using evolutionary computation [3], increasing trends in annual maximum daily precipitation [4], future changes to the intensity and frequency of short-duration extreme rainfall [5].
For assessing changes in the water resources of a region and the impacts of climate variability, the detection of trends in precipitation is important [6].
Testing the significance of the trends observed in hydrological and climatic time series has received a great deal of attention recently, especially after changes have been observed in the natural and human environments due to global warming. This is reflected by a huge number of studies carried out over the last three decades that deal with assessments of the significance of trends in a variety of natural time series, including temperature, evaporation, precipitation, flow, and water quality, e.g. analyses of rainfall intensities in Slovakia [7], the correlation structure of continuous and discrete point rainfalls [8], and the preservation of rainfall properties in stochastic disaggregation by a simple random cascade model [9], [10]. A scaling method that is able to use daily rainfall statistics in order to derive characteristics for shorter duration rainfall events has been an important topic of studies during recent decades. In these studies, scaling formulas have been proposed to extend the Intensity, Duration and Frequency (IDF) relationship from the usual daily time scale to shorter durations based on the scaling properties of rainfall, e.g. a scaling model to predict storm hyetographs [11], a study based on the empirically observed scaling properties of rainfall, and some general assumptions about the cumulative distribution functions for the annual maxima of mean rainfall intensity. It is possible to derive simple IDF relationships [11]. In Slovakia the scaling properties of extreme rainfall have been tested in several studies [12]. The scaling properties of extreme rainfall in Slovakia in order to establish the scaling behavior of statistical moments over different durations were examined [13]. It is therefore important to address climate change in the future for planning adaptations or dealing with damage associated with variability and change in a climate. It is very important for the future to predict what would change in the characteristics of short- term rainfall depth intensities. With these predictions, a proposal for gradual adaptation to climate change is possible in order to prevent property damage, save lives and minimize economic damage. These include, in particular, the reconstruction and construction of sewerage systems, catchment pits, rain reservoirs, polders, etc.
2. Climate models and scenarios
Climatic models are numerical models (General Circulation Models (GCM) and Regional Climate Models (RCM)) that represent physical processes in the atmosphere, ocean, cryosphere and on the Earth’s surface. They are the latest tools that are available for the simulation of the response of the global climate system to rising greenhouse gases. Global circulation models show the atmosphere as a 3-dimensional grid through the Earth, with a horizontal resolution between 250 to 600 km, and 10 to 20 vertical layers in the atmosphere, and in some cases, more than 30 layers in the oceans. Their resolutions are therefore rough in term of the extent of exposure in most cases of impact
assessments. In addition, most physical processes, which are related, e.g. to clouds, and which occur on smaller scales, cannot be modeled correctly. Instead, their known properties must be averaged on a larger scale using a technique known as parameterization. This is one source of uncertainty in GCM simulations based on future climate predictions. Others refer to the simulation of various feedback mechanisms in models related to, e.g. water vapor and warming, clouds and radiation, ocean and ice circulation, and snow albedo. For this reason, a GCM can simulate completely different responses to the same load, due to how some processes and feedback are modeled.
RCMs are used to increase the differentiation of global climate models in a small, defined area of interest. An RCM can cover an area of about 5000 x 5000 km. The entire GCM determines to a large extent the effects of changes in the concentration of greenhouse gases and volcanic eruptions on the global climate. A GCM-computed climate serves as an entry boundary condition for an RCM for factors such as the temperature and wind. The RCM then addresses local impacts on a smaller scale, information on the orography (height of the soil) and land use, weather, and climate data with a maximum resolution of at most 50 km, 25 km, or less [14], [15].
In 2000, the Intergovernmental Panel on Climate Change (IPCC) issued a series of scenarios for use in the study of climate change. The Special Report Emission Scenarios (SRES) were designed to examine the future development of driving forces in the global environment, with particular reference to greenhouse gas emissions and aerosol emissions. The SRES team defined four set of scenarios, i.e. A1, A2, B1 and B2 that describe the relationship between greenhouse gas and aerosol driving forces and their development over the 21st century for the world’s major regions and the world. Every set of scenarios represents a variety of demographic, social, economic, technological and ecological developments that are disparate and irreversible. Four set of scenarios combine two sets of different trends. One set ranges between strong economic values and strong environmental values. The second set ranges between growing globalization and growing regionalization. After emplacing the need for new scenarios for the research community, the IPCC has urged scientists to develop new sets of scenarios to simplify future assessments of climate change. The IPCC decided that these scenarios would not be developed as part of the IPCC process and left new scenarios for the research community. The research community subsequently created a set of scenarios that include the paths of emissions, concentration and land use; they are referred to as Representative Concentration Pathways (RCP), [16], [17], [18].
3. Methodology
The purpose of the Mann-Kendall test is to statistically assess the statistical significance of an ascending or descending trend in a selected value over time. The significance of the rising or decreasing trend means that the variable constantly increases or decreases over time, but the trend may or may not be linear. The Mann- Kendall test examines the rejection of the zero hypotheses (H0) and the acceptance of an alternative hypothesis (Ha), where H0 equals a non-monotonous trend, and Ha is a monotonous trend [19], [20].
The initial assumption for a Mann-Kendall trend is that H0 is correct or that the data must be valid before H0 is rejected and Ha received. The calculation is determined by the formula:
( )
∑ ∑ −
= −
= = + 1
1 1
sgn n
k n k j
k j x x
S , (1)
where S is the testing statistic; xj is the sequential data value; n is the length of time series. The Mann - Kendall ZMK standardized test statistics can be given by:
, 0 if ), var(
1
, 0 if ,
0
, 0 if ), var(
1
+ <
=
=
=
− >
=
S S Z s
S Z
S S Z s
MK MK MK
(2)
where ZMK = 0 represents the not existing trend, while ZMK>0 means the increasing and ZMK< 0 the decreasing trend.
A simple scaling method is used to process rainfall data for a period of time shorter than one day. Simple scaling determines the design values for duration shorter than one day and for a selected time period by using daily rainfall records that are commonly available. Applying simple scaling to the relationship between the intensity, duration and the periodicity of the precipitation known as IDF properties is possible.
Determining the scaling properties of precipitation is based on the general shape of the following IDF formula [21]:
( ) ( )
d bT
i=a , (3)
where a(T) is the return period function T; b(d) is the duration function of the rain given by the formula:
( ) (
d = d+θ)
ηb , (4)
where θ, η are parameters (determined by the estimation θ > 0, 0 < η < 1).
Simple scaling for the scaling of statistical moments was applied in this paper. The scaling exponents could be estimated with a linear regression from the slope between the logarithmic moment values and the scaling parameters for the different order of the moments. If there is a linear dependence between the scaling exponent and the moment order, it is the scaling exponent of the first order. This property is referred to as ‘wide
sense simple scaling’. The following formula is used for deriving the scaling coefficients [22]:
=
n
d n
d E I
I
E λ λβn , (5)
where βn = nβ represents the scaling exponent of the n-th order.
4. Data analysis
Observed data of the hourly rainfall values from the warm season (April - October) were provided by the Slovak Hydrometeorological Institute for the Bratislava, Gabčíkovo and Sereď climatological stations. The annual maximal rainfall for various durations from 60 min up to one day were determined from an hourly rainfall time series for the observation period from 1995 to 2009, simple statistical characteristic for hourly and daily measured data are presented in Table I.
Table I
Simple statistical characteristics of real measured data
Duration 60 1440
Station Av. Min. Max. Cv Av. Min. Max. Cv 17140 Bratislava-Koliba 20.96 9.55 36.64 0.363 47.30 29.79 72.29 0.235
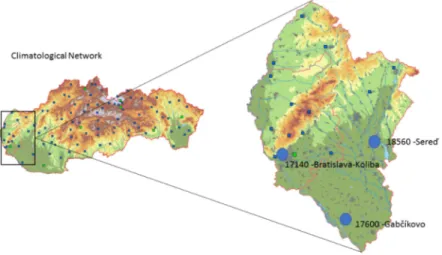
17600 Gabčíkovo 20.42 5.78 65.97 0.738 35.57 21.24 67.97 0.379 18560 Sereď 13.53 7.58 21.17 0.280 30.75 19.15 47.00 0.287 The locations of the stations are presented in Fig. 1. The area of interest is located on the western part of the Podunajská nížina lowland of Slovakia. The Danube plain belongs to an area in Slovakia that constitutes a warm climate district with more than 50 days above 25 °C per year. It is also one of the driest regions in Slovakia with annual rainfall of less than 500 mm per year.
The RCM simulations used consist of time series of annual maximum short-term precipitation events for two scenario periods, i.e. in the past (1960-2000) and the future (2070-2100) and the month of the occurrence of each year’s maxima. The time scale of the simulations is hourly. The RCM simulations were provided by the staff of the Department of Water Management and Environmental Modeling at the Czech University of Life Sciences in Prague. For three stations (Bratislava-Koliba, Gabčíkovo, Sereď), there are 3 to 4 selected scenarios, namely KNMI-RACMO2, KNMI- RACMO22E, SMHI-RCA4, and MOHC-HadRM-3Q0. The KNMI-RACMO2 and KNMI-RACMO22E simulations were created by the Royal Netherlands Meteorological Institute; the RACMO2 simulation works on the basis of the SRES scenario with A1B forcing and 25 km spatial resolution; and the RACMO22E simulation works on the basis of the RCP scenario with RCP 4.5 and RCP 8.5 forcing and 12 km spatial resolution. The SMHI - RCA4 simulation was created by the Swedish Meteorological and Hydrological Institute and works on the basis of the RCP scenario with RCP 4.5
and RCP 8.5 forcing and 50 km spatial resolution. The MOHC - HadRM-3Q0 simulation was created by the Met Office Hadley Centre in the United Kingdom and is based on the SRES scenario with A1B forcing and 25 km spatial resolution. This institution is also the national meteorological service in the United Kingdom. In each scenario there is a rainfall depth data for duration intensities of 60, 120, 180, 240, and 1440 minutes.
Fig. 1. Location of the analyzed climatological stations in Slovakia
5. Results
From the results it can be assumed that at the Bratislava-Koliba climatological station, an increasing but not significant trend for the future horizon prevails. A significant trend was detected only for the KNMI-RACMO2 simulation for a future scenario with duration of 180 minutes. For the future scenario (2070-2100) a significant trend was identified for the SMHI-RCA4 scenario RCP8.5 for duration of 180 minutes.
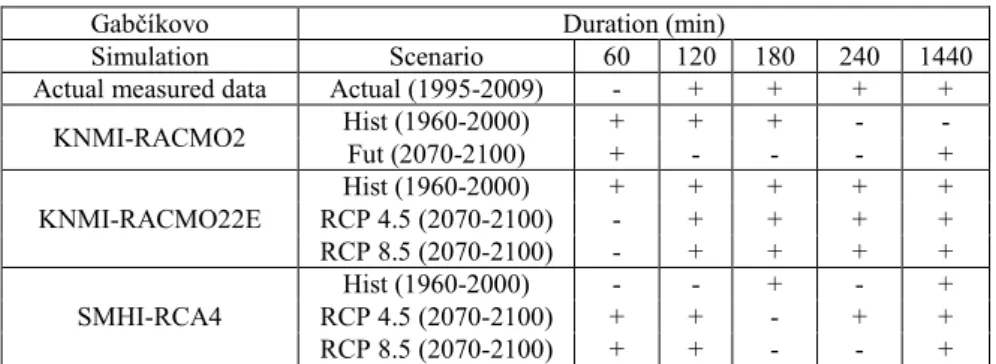
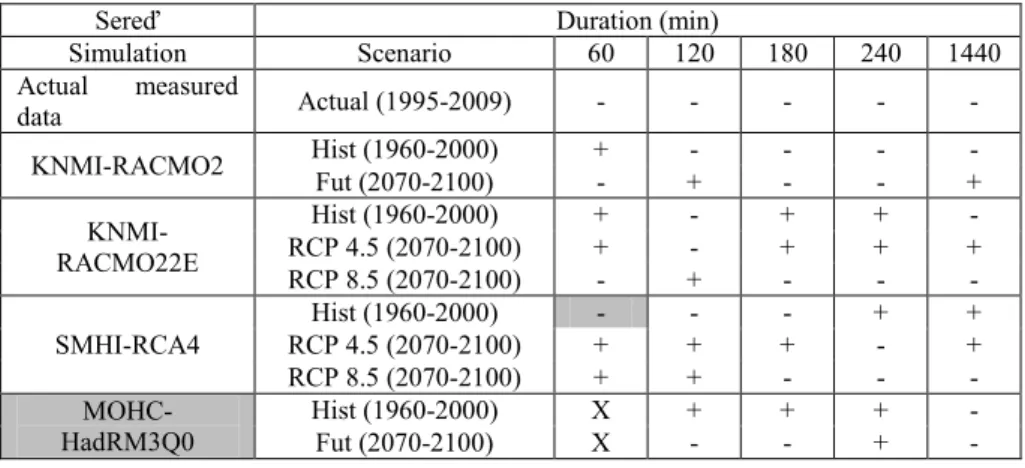
For the historical scenario (1960-2000), significant trends were detected by the SMHI- RCA4 simulation for durations of 60 and 120 minutes. For the Gabčíkovo climatological station, there were no significant trends detected in both scenarios. For the future period an increasing trend predominates in the rainfall depths in the Gabčíkovo climatological station. At the Sereď climatological station, there were no significant trends observed for the future period. For the historical period a significant trend was detected in the duration of 60 minutes in the SMHI-RCA4 simulation. The results are shown in Tables II - Table IV.
The scaling coefficients were estimated for the warm period (April to October) for the actual measured data and for all the simulation scenarios. The lowest scaling coefficients for the future were determined in the SMHI-RCA4 simulation for all the climatological stations. The highest coefficients for the Bratislava-Koliba and Sereď
climatological stations were in the MOHC-HadRM-3Q0 simulation. For the Bratislava- Koliba climatological station the scaling coefficient is 0.8348, which is 0.0641 higher than the value of the scaling coefficient from the actual measured data. For the Sereď climatological station, the scaling coefficient is 0.672, which is 0.2265 lower than the value of the scaling coefficient from the actual measured data. For the Gabčíkovo climatological station, the highest coefficient was in the KNMI-RACMO22E simulation, where the value of the scaling coefficient is 0.7117, which is lower than the value of the scaling coefficient from the actual measured data by 0.0238.
Table II
Estimated trends of short-term rainfalls at the Bratislava-Koliba climatological station (grey - significant trend)
Bratislava-Koliba Duration (min)
Simulation Scenario 60 120 180 240 1440
Actual measured data Actual (1995-2009) + + + + -
KNMI-RACMO2 Hist (1960-2000) - - + - +
Fut (2070-2100) - + - - +
KNMI-RACMO22E
Hist (1960-2000) + - - - -
RCP 4.5 (2070-2100) + - + + +
RCP 8.5 (2070-2100) - + + + +
SMHI-RCA4
Hist (1960-2000) - - + + -
RCP 4.5 (2070-2100) - - - + +
RCP 8.5 (2070-2100) + + - - -
HadRM-3Q0 Hist (1960-2000) X + + - -
Fut (2070-2100) X - + + -
Table III
Estimated trends of short-term rainfalls at the Gabčíkovo climatological station (grey - significant trend)
Gabčíkovo Duration (min)
Simulation Scenario 60 120 180 240 1440
Actual measured data Actual (1995-2009) - + + + +
KNMI-RACMO2 Hist (1960-2000) + + + - -
Fut (2070-2100) + - - - +
KNMI-RACMO22E
Hist (1960-2000) + + + + +
RCP 4.5 (2070-2100) - + + + +
RCP 8.5 (2070-2100) - + + + +
SMHI-RCA4
Hist (1960-2000) - - + - +
RCP 4.5 (2070-2100) + + - + +
RCP 8.5 (2070-2100) + + - - +
Table V lists the estimated scaling coefficients for all the climatological stations for the warm period.
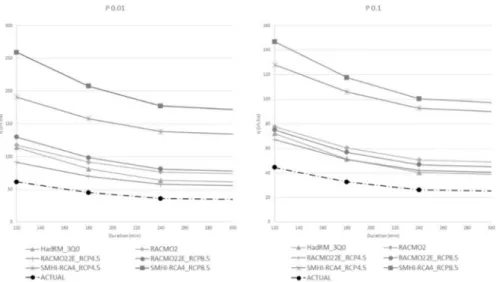
Using the scaling coefficients, the design values of the rainfall intensities were determined for return periods of 10 and 100 years. The IDF curves were constructed
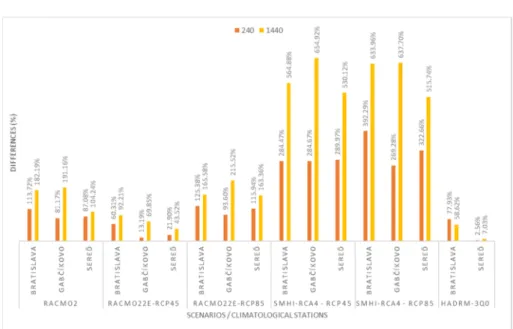
from the design values of rainfall intensities, and the example of IDF curves is in Fig. 2 for the Bratislava-Koliba climatological station. All the IDF curves exceed the IDF curve of the actual measured data. The closest design values from the simulations to the actual design values are for the MOHC-HadRM-3Q0 and RACMO22E RCP4.5 simulations, due to the closest scaling coefficient values. The relative differences in the design daily precipitation totals derived by the scaling coefficients and the actual design precipitation totals are shown in Fig. 3 - Fig. 4.
Table IV
Estimated trends of short-term rainfalls at the Sereď climatological station (grey - significant trend)
Sereď Duration (min)
Simulation Scenario 60 120 180 240 1440
Actual measured
data Actual (1995-2009) - - - - -
KNMI-RACMO2 Hist (1960-2000) + - - - -
Fut (2070-2100) - + - - +
KNMI- RACMO22E
Hist (1960-2000) + - + + -
RCP 4.5 (2070-2100) + - + + +
RCP 8.5 (2070-2100) - + - - -
SMHI-RCA4
Hist (1960-2000) - - - + +
RCP 4.5 (2070-2100) + + + - +
RCP 8.5 (2070-2100) + + - - -
MOHC- HadRM3Q0
Hist (1960-2000) X + + + -
Fut (2070-2100) X - - + -
Table V
Estimated scaling coefficients for the warm period (light grey - lowest value, dark grey - highest value)
Simulation Scenario
Scaling coefficient values 17140
Bratislava- Koliba
17600 Gabčíkovo
18560 Sereď Actual measured data Actual (1995-2009) 0.7707 0.8985 0.7355
KNMI-RACMO2 Hist (1960-2000) 0.6788 0.7637 0.6333
Fut (2070-2100) 0.6156 0.6337 0.6865 KNMI-RACMO22E
Hist (1960-2000) 0.6416 0.6351 0.7682 RCP 4.5 (2070-2100) 0.6694 0.672 0.6444 RCP 8.5 (2070-2100) 0.6791 0.6259 0.6247 SMHI-RCA4
Hist (1960-2000) 0.4799 0.4584 0.5235 RCP 4.5 (2070-2100) 0.465 0.5222 0.4677 RCP 8.5 (2070-2100) 0.5478 0.5123 0.5255
MOHC-HadRM-3Q0 Hist (1960-2000) 0.7809 x 0.7487
Fut (2070-2100) 0.8348 x 0.7117
Fig. 2. Comparison of IDF curves derived by using RCM scenarios for the Bratislava-Koliba climatological station for the periodicity P=0.01 and P=0.1
Fig. 3. Relative differences in the estimated design values of the rainfall intensities derived by using scaling coefficients for durations of 120 and 180 minutes
Fig. 4. Relative differences in the estimated design values of rainfall intensities derived by using scaling coefficients for duration of 240 and 1440 minutes
6. Conclusion
The aim of the paper was to analyze future changes in the trends and scaling coefficients in the intensities of short-term rainfall depths at the Bratislava-Koliba, Gabčíkovo and Sereď climatological stations on the basis of scenarios of regional climatic models. The Mann - Kendall trend test was used for testing the trends, with a 90% statistical significance.
Using the scaling coefficients, IDF curves were constructed, and the design values of the rainfall depth intensities were derived. From the actual measured data, a rising trend in the rainfall depths was observed only in the Bratislava-Koliba and Sereď climatological stations. The simulations did not show significant change in the trends;
they showed increasing but not significant trends for the future. A significant trend for the future period was observed in the Bratislava-Koliba climatological station with a decreasing tendency for duration of 180 minutes in the RACMO2 scenario and the SHMI-RCA4 RCP8.5 scenario. In the Gabčíkovo and Sereď climatological stations, there were no significant trends, but for the future period a rising trend prevails. Scaling coefficients were derived for each station and for all the simulations for the return periods of 10 and 100 years and for the warm period. The lowest coefficient for the future was assessed in the SHMI-RCA4 simulation for all the stations. The highest coefficient was in the MOHC-HadRM-3Q0 simulation for the Bratislava-Koliba and Sereď stations and in the RACMO22E simulation for the Gabčíkovo station. For the Bratislava-Koliba climatological station the highest scaling coefficient is 0.8348, which is 0.0641 higher than the value of the scaling coefficient from the actual measured data.
For the Sereď climatological station the highest scaling coefficient is 0.672, which is 0.2265 lower than the value of the scaling coefficient from the actual measured data.
For the Gabčíkovo climatological station, the highest coefficient was in the KNMI- RACMO22E simulation; the value of the scaling coefficient is 0.7117, which is lower than the value of the scaling coefficient from the actual measured data by 0.0238. With these coefficients the design rainfall intensities and the IDF curves were constructed; the results show an increasing tendency in the design values for the future period. The lowest differences are in the RACMO22E-RCP4.5 scenario and the HadRM-3Q0 scenario due to the close value of the scaling coefficients to the value of the scaling coefficient for the actual measured data. In the future, it will be necessary to re-evaluate the design values of the rainfall depth intensities when assessing and designing water management structures in this area.
Acknowledgement
This work was supported by the Slovak Research and Development Agency under Contract No. APVV-15.0497, VEGA Grant Agency No. 1/0891/17 and by the European Commission’s Seventh Framework Project RECARE, Contract No 603498. The authors thank the agencies for their research support.
References
[1] Janík A., Šoltész A. Flash flood mitigation modeling - case study small Carpathians, Pollack Periodica, Vol. 12, No. 2, 2017, pp. 103‒116.
[2] Pindjaková T., Kelčík S., Šoltész A., Simulation of flood progress on the River Gidra, Pollack Periodica, Vol. 11, No. 1, 2016, pp. 25‒34.
[3] Seo J. H., Lee Y. H., Kim Y. H. Feature selection for very short-term heavy rainfall prediction using evolutionary computation, Advances in Meteorology, Vol. 2014, 2014, Article ID 203545, 15 pages.
[4] Westra S., Alexander L. V., Zwiers F. W. Global increasing trends in annual maximum daily precipitation, Journal of Climate, Vol. 26, 2013, pp. 3904–3918.
[5] Westra S., Fowler H. J., Evans J. P., Alexander L. V., Berg P., Johnson F., Kendon E. J., Lenderink G., Roberts N. M. Future changes to the intensity and frequency of short- duration extreme rainfall, Rev. Geophys, Vol. 52, No. 3, 2014, pp. 522–555.
[6] Molnár P., Fatichi S., Gaál L., Szolgay J., Burlando P. Storm type effects on super Clausius-Clapeyron scaling of intense rainstorm properties with air temperature, Hydrology and Earth System Sciences, Vol. 19, No. 4, 2015, pp. 1753‒1766.
[7] Bara M. An analysis of rainfall intensities in Slovakia, (in Slovak) PhD Thesis, Slovak University of Technology, Bratislava, 2010.
[8] Marani M. On the correlation structure of continuous and discrete point rainfall, Water Resources Research, Vol. 39, No. 5, 2003, pp. 1128‒1136.
[9] Molnar P., Burlando P. Preservation of rainfall properties in stochastic disaggregation by a simple random cascade model, Atmospheric Research, Vol. 77, No. 1-4, 2005, pp. 137–151.
[10] Gaál L. Molnár P. Szolgay J. The effect of precipitation corrections on the dependence structure of storm characteristics, 9th International Workshop on Precipitation in Urban Areas, St. Moritz, Switzerland, 6-9 December 2012, pp. 33‒37.
[11] Koutsoyiannis D., Foufoula-Georgiu E. A scaling model of storm hyetograph, Water Resources Research, Vol. 29, No. 7, 1993, pp. 2345–2361.
[12] Bara M., Kohnová S., Gaál L., Szolgay J., Hlavčová K., Scaling of short term rainfall intensites in Slovakia, (in Slovak) Key Publishing, Ostrava, 2010.
[13] Bara M., Gaál L., Kohnová S., Szolgay J., Hlavčová K. Simple scaling of extreme rainfall in Slovakia, a case study, Meteorological Journal, Vol. 11, No. 4, 2008, pp. 153−157.
[14] Climate prediction, Regional climate models 2014, http://www.climateprediction.net/
climate-science/climate-modelling/regional- models/ (last visited 17 November 2017).
[15] Intergovernmental panel on climate change, What is GMC? 2013, http://www.ipcc- data.org/guidelines/pages/gcm_guide.html, (last visited 24 November 2017).
[16] IPCC-TGICA General guidelines on the use of scenario data for climate impact and adaptation assessment, Version 2, Prepared by T. R. Carter, on behalf of the Intergovernmental Panel on Climate Change, Task Group on Data and Scenario Support for Impact and Climate Assessment, Helsinki, Finland, 2007.
[17] Nakicenovic N., Swart R. Special report on emission scenarios, A Special Report of Working Group III of the Intergovernmental Panel on Climate Change, Cambridge University Press, Cambridge, UK, 2000, http://www.grida.no/climate/ipcc/emission/
index.htm (last visited 15 December 2017).
[18] Collins M., Knutti R., Arblaster J., Dufresne J. L., Fichefet T., Friedlingstein P., Gao X., Gutowski W. J., Johns T., Krinner G., Shongwe M., Tebaldi C., Weaver A. J., Wehner M.
Long-term climate change: Projections, commitments and irreversibility, In: Climate Change 2013: The physical science basis, Contribution of Working Group I to the Fifth Assessment Report of the Intergovernmental Panel on Climate, Cambridge University Press, Cambridge, UK, NY, USA, 2013, pp. 1029–1136.
[19] Kendall M. G. Rank correlation methods, Griffin, London, 1955.
[20] Mann H. B. Nonparametric tests against trend, Econometrica, Vol. 13, No. 3, 1945, pp. 245‒259.
[21] Koutsoyiannis D., Foufoula-Georgiu E. A scaling model of storm hyetograph, Water Resources Research, Vol. 29, No. 7, 1993, pp. 2345–2361.
[22] Menabde M., Seed A., Pegram G. A simple scaling model for extreme rainfall, Water Resources Research, Vol. 35, No. 1, 1999, pp. 335−339.