0139–3006 © 2017 Akadémiai Kiadó, Budapest DOI: 10.1556/066.2017.0005
OPTIMIZATION OF PROTEIN EXTRACTION FROM TREE PEONY (PAEONIA SUFFRUTICOSA ANDR.) SEED USING RESPONSE
SURFACE METHODOLOGY
L.L. GAOa, Y.Q. LIa*, G.J. SUNa and H.Z. MOb
aSchool of Food Science & Engineering, Qilu University of Technology, No. 3501 University Road of Changqing District, Jinan, 250353, Shandong Province. China
bSchool of Food Science, Henan Institute of Science and Technology, Xinxiang, 453003. China (Received: 1 March 2017; accepted: 21 July 2017)
Optimization of extraction ratio (ER) of tree peony seed protein (TPSP) was investigated using response surface methodology (RSM). The second-degree equation for ER of TPSP had high coeffi cient (0.9625) of determination.
The probability (P) value of regression model signifi cance was less than 0.001 by analysis of central composite rotatable design. Relationships of ER to pH, liquid/solid ratio, squares of all factors, and cross-product factors (x2x3, x2x4, x3x4) were signifi cant (P<0.05). Whereas, extraction time, temperature, and cross-product terms (x1x2, x1x3, x1x4) were not signifi cant factors (P>0.05). Optimum extraction conditions were 3.42 h, pH 9.50, 50.80 ºC, and 9.54 ml g–1 of liquid/solid ratio with the maximum ER (43.60%) . SDS-PAGE indicated TPSP had mainly four proteins (180, 100, 60, and 35 kDa) with four subunits of 60, 48, 38, and 23 kDa. TPSP had a good amino acid composition with abundant essential amino acids (39.76%) determined by amino acid analysis.
Keywords: tree peony seed protein, response surface methodology, extraction, amino acid composition
Tree peony (Paeonia suffruticosa Andr.), originating from China with a history of more than 2000 years, is a perennial deciduous shrub with excellent ornamental and medicinal values (LI et al., 2009; 2015a). In recent years, tree peony seed has attracted attention in food industry due to its abundant unsaturated fatty acids (linolenic acid, 35.70% and linoleic acid, 22.19%), which are benefi cial to human health (LI et al., 2015b; NING et al., 2015).
Tree peony seed meal, which is a by-product after oil extraction, is rich in proteins (32%) as stated in our previous study. But tree peony seed meal is usually used as animal feed and fertilizer (TIRGAR et al., 2017), having low added value. So far, there were few reports about tree peony seed protein (TPSP). Therefore, the aim of this study was to investigate extraction and characteristics of TPSP.
Alkaline extraction is the most common method for plants protein, such as groundnut, watermelon seed, and canola (WANI et al., 2008; TAN et al., 2011; JAIN et al., 2015). Different environmental conditions like time, pH, temperature, and liquid/solid ratio, might affect ER of protein. Response surface methodology (RSM) becomes a suitable tool for optimizing factors of various technologies, which could shorten experiment time (WANI et al., 2008; MA
et al., 2010). The appropriate mathematical model deduced by RSM described the relation between independent and dependent variables in order to determine the optimum parameters for process (MA et al., 2010; CHEE et al., 2012). In this study, RSM was employed to optimize extraction parameters including time, pH, temperature, and liquid/solid ratio to obtain maximum ER of TPSP. Meanwhile, protein constituents and amino acids in TPSP were analysed using SDS-PAGE and amino acid analyzer.
* To whom correspondence should be addressed.
Phone: +86-531-89631195; fax: +86-531-89631195; e-mails: lyq@qlu.edu.cn or sdililyq@126.com
144
Acta Alimentaria 47, 2018
1. Materials and methods
1.1. Materials
Defatted tree peony seed meal was obtained from Ruipu Science and Technology Development Ltd. Co., (Heze, Shandong, China). All reagents used were of analytical grade.
1.2. Extraction and preparation of TPSP
Defatted tree peony seed meal was milled b y a small grinder (JP150A-8, Yongkang Jiupin Industry and Trade Ltd. Co., Zhejiang, China) and passed through a 80 mesh screen to obtain the fl our. TPSP was extracted and prepared as the procedure of Figure 1 . Extracted TPSP content was determined according to LOWRY and co-workers (1951). Maximal TPSP content was determined by Kjeldahl method (N×6.25) using FOSS Nitrogen Analyzer 2300 (Foss Corporation, Sweden). ER of TPSP was calculated by Eq. (1).
ER (%)=(Extracted TPSP concentration)/(Maximal TPSP concentration)×100 (1)
Fig. 1. The procedure of TPSP extraction
1.3. Experimental desig n in RSM
RSM was utilized to predict a model for optimizing ER of TPSP. Five levels, four variables, and central composite rotatable design (CCRD) were employed to evaluate effects of single factor on ER of TPSP. The 30 runs were performed in a totally random order to minimize bias. The extraction times were 2.5, 3, 3.5, 4, and 4.5 h. The values of pH were 8, 8.5, 9, 9.5, and 10. The temperatures were 40, 50, 60, 70, and 80 ºC. The liquid/solid ratios were 6:1, 8:1, 10:1, 12:1, and 14:1 ml g–1. These independent variables were designed based on results of preliminary experiments. The independent variable Xi was coded as xi, which was defi ned as dimensionless, according to Eq. (2).
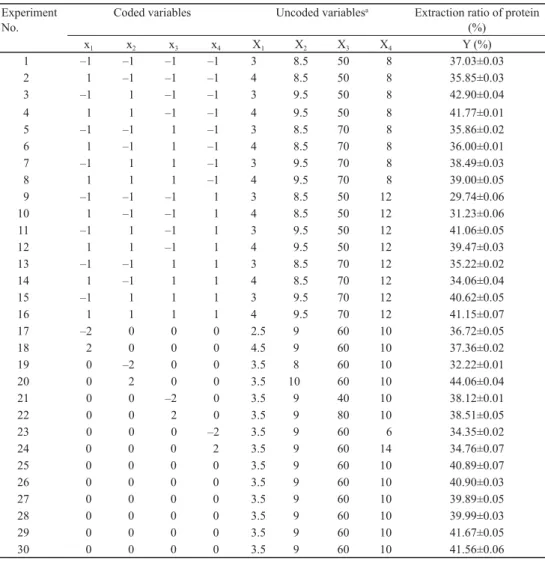
xi = (Xi–X0)/∆Xi (2) where xi is the coded value of an independent variable, Xi is the true value of an independent variable, X0 is the true value of an independent variable at the centre point, and ΔXi is the step change value. ER of TPSP was taken as the response (Y). The response values generated from the experiments are presented in Table 1.
Table 1. Central composite rotatable design (CCRD) and responses for TPSP extraction ratio Experiment
No.
Coded variables Uncoded variablesa Extraction ratio of protein (%)
x1 x2 x3 x4 X1 X2 X3 X4 Y (%)
1 –1 –1 –1 –1 3 8.5 50 8 37.03±0.03
2 1 –1 –1 –1 4 8.5 50 8 35.85±0.03
3 –1 1 –1 –1 3 9.5 50 8 42.90±0.04
4 1 1 –1 –1 4 9.5 50 8 41.77±0.01
5 –1 –1 1 –1 3 8.5 70 8 35.86±0.02
6 1 –1 1 –1 4 8.5 70 8 36.00±0.01
7 –1 1 1 –1 3 9.5 70 8 38.49±0.03
8 1 1 1 –1 4 9.5 70 8 39.00±0.05
9 –1 –1 –1 1 3 8.5 50 12 29.74±0.06
10 1 –1 –1 1 4 8.5 50 12 31.23±0.06
11 –1 1 –1 1 3 9.5 50 12 41.06±0.05
12 1 1 –1 1 4 9.5 50 12 39.47±0.03
13 –1 –1 1 1 3 8.5 70 12 35.22±0.02
14 1 –1 1 1 4 8.5 70 12 34.06±0.04
15 –1 1 1 1 3 9.5 70 12 40.62±0.05
16 1 1 1 1 4 9.5 70 12 41.15±0.07
17 –2 0 0 0 2.5 9 60 10 36.72±0.05
18 2 0 0 0 4.5 9 60 10 37.36±0.02
19 0 –2 0 0 3.5 8 60 10 32.22±0.01
20 0 2 0 0 3.5 10 60 10 44.06±0.04
21 0 0 –2 0 3.5 9 40 10 38.12±0.01
22 0 0 2 0 3.5 9 80 10 38.51±0.05
23 0 0 0 –2 3.5 9 60 6 34.35±0.02
24 0 0 0 2 3.5 9 60 14 34.76±0.07
25 0 0 0 0 3.5 9 60 10 40.89±0.07
26 0 0 0 0 3.5 9 60 10 40.90±0.03
27 0 0 0 0 3.5 9 60 10 39.89±0.05
28 0 0 0 0 3.5 9 60 10 39.99±0.03
29 0 0 0 0 3.5 9 60 10 41.67±0.05
30 0 0 0 0 3.5 9 60 10 41.56±0.06
aX1: Extraction time, h; X2: extraction pH; X3: extraction temperature, ºC; X4: liquid/solid ratio, ml g–1.
1.4. Analysis of variance (ANOVA) and verifi cation of the model
The response values obtained were subjected to multiple non-linear regression analysis to obtain the coeffi cients. A plot of response Y as a function of xi and xj could be described by Eq. (3).
146
Acta Alimentaria 47, 2018
Y = ȕ0+σȕixi+σȕiixi2+σȕijxixj
(3) where Y is the response variable, xi and xj are the coded independent variables, and β0, βi, βii
and βij are the regression coeffi cients of variables for intercept, linear, quadratic, and interaction regression terms, respectively.
Table 2 shows regression coeffi cients of individual linear, quadratic, and interaction terms. All data were analysed by Design Expert Software Version 8.0.5.0 (USA). The experimental errors for response Y were calculated based on the standard deviation of the centre point. The experimental and predicted values were compared in order to verify the validity of the model.
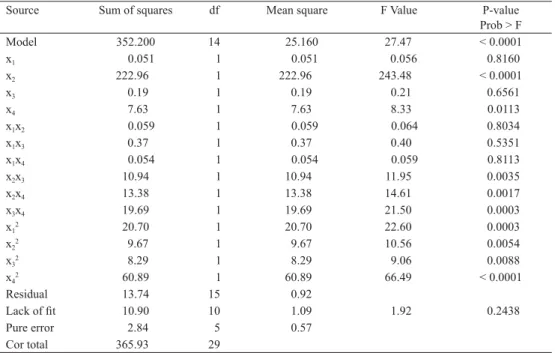
Table 2. ANOVA for response surface quadratic model of ER of TPSP
Source Sum of squares df Mean square F Value P-value
Prob > F
Model 352.200 14 25.160 27.47 < 0.0001
x1 0.051 1 0.051 0.056 0.8160
x2 222.96 1 222.96 243.48 < 0.0001
x3 0.19 1 0.19 0.21 0.6561
x4 7.63 1 7.63 8.33 0.0113
x1x2 0.059 1 0.059 0.064 0.8034
x1x3 0.37 1 0.37 0.40 0.5351
x1x4 0.054 1 0.054 0.059 0.8113
x2x3 10.94 1 10.94 11.95 0.0035
x2x4 13.38 1 13.38 14.61 0.0017
x3x4 19.69 1 19.69 21.50 0.0003
x12 20.70 1 20.70 22.60 0.0003
x22 9.67 1 9.67 10.56 0.0054
x32 8.29 1 8.29 9.06 0.0088
x42 60.89 1 60.89 66.49 < 0.0001
Residual 13.74 15 0.92
Lack of fi t 10.90 10 1.09 1.92 0.2438
Pure error 2.84 5 0.57
Cor total 365.93 29
P<0.001 was highly signifi cant; P<0.05 was signifi cant; P>0.05 was not signifi cant.
1.5. Sodium dodecyl sulphate–polyacrylamide gel electrophoresis (SDS-PAGE)
Constituents of TPSP were analysed using non-reducing and reducing SDS-PAGE by the method of ZHAO and co-workers (2016) with slight modifi cation.
An aliquot (0.001 g) of TPSP was mixed with 1 ml of reducing sample buffer (pH 6.8;
1 M Tris-HCl, 50% glycerol, 10% SDS, 10% β-mercaptoethanol, and 0.1% bromophenol blue) or non-reducing sample buffer without β-mercaptoethanol, heated to 100 ºC, cooled to 25 ºC, and loaded per lane. The protein was run at 15 mA for 1 h on the stacking gel (3%) and 30 mA for 2 h on the resolving gel (12%) using electrophoresis instrument (JY 300, Beijing Junyi-Dongfang electrophoresis equipment, Ltd. Co., Beijing, China). The gel was dyed in staining solution with Coomassie brilliant blue R-250 for 4 h and decolorised with a decolouring agent (glacial acetic acid, methanol, and distilled water). After 4 days, the protein bands were visualized on the gel.
1.6. Amino acid analysi s
Amino acid compositions of TPSP were determined using the modifi ed method of CHEE and co-workers (2012). An aliquot (0.002 g) of TPSP was subjected to acid hydrolysis with 5 ml of 6 M HCl under nitrogen gas for 24 h at 110 ºC. Then, the obtained reactant was fi ltered through a 0.45 μm membrane fi lter. The amino acids of TPSP were analysed by reversed- phase high-performance liquid chromatography (Agilent 1100, Agilent Technologies Ltd.
Co., Santa Clara, California, USA) after precolumn derivatization with o-phthaldialdehyde (OPA). Sulphur-containing amino acids cysteine and methionine were determined after performic acid oxidation (CHEE et al., 2012; MALOMO & ALUKO, 2015). The proportion of essential amino acids (EAA) to the total amino acids (TAA) of TPSP is calculated by the following Eq. (4).
E/T(%)=[(content of EAA)/(content of TAA)]×100 (4) 1.7. Statistical analysis
Every experiment was performed in triplicates and average values with standard deviation were reported. Statistical analysis was carried out using Origin 8.0 software. Graphs were produced using Microsoft Excel 2010, and linear regression analysis was used to determine the signifi cant difference at 5% confi dence intervals (P<0.05).
2. Results and discussion
2.1. Fitting the models
The experimental conditions and the corresponding response values for the RSM experimental design are showed in Table 1. The relationship between the independent and dependent variable was described in a multiple regression Eq. (5), with levels higher than 95% of coeffi cient.
Y=40.8167–0.0463x1+3.0479x2+0.0888x3–0.5638x4 –0.86865x12–0.59365x22–0.54990x32–ͳ.4899x42
–0.0606x1x2+0.1519x1x3+0.0581x1x4
–0.8269x2x3+0.9144x2x4+1.1094x3x4 (5) where Y is the response variable, x1 is the coded value of extraction time, x2 is the coded value of pH, x3 is the coded value of temperature, x4 is the coded value of liquid/solid ratio.
The coeffi cient of determination (R2) at least 0.80 was a measure of degree of fi t (GUAN
& YAO, 2008). The plot of experimental values of extracted protein (%) versus those (data not shown) calculated from Eq. (5) indicated a good fi t with the 0.9625 of R2. This value of R2 (0.9625) was higher than for watermelon seed protein (0.8390) and oat bran protein (0.8640) (GUAN & YAO, 2008; WANI et al., 2008). Moreover, it was equivalent to values of wheat germ protein (0.9480) and fl axseed meal protein (0.9630) (SUN et al., 2009; CHEE et al., 2012). The less the value of probability (P) value of the regression model signifi cance was, the better the
148
Acta Alimentaria 47, 2018
regression model fi tted by ANOVA for CCRD. Less than 0.0001 of P for ER of TPSP (Table 2) showed Eq. (5) model could well fi t the relationship between independent variables and the responses.
2.2. Effects of independent variables on responses
The effects of independent variables on ER of TPSP are presented in Table 2 by the regression coeffi cients of fi tted second-order polynomial . The values of pH, liquid/solid ratio, squares of factors, and cross-product factors (x2x3, x2x4, x3x4) had signifi cant (P<0.05) effect on ER of TPSP. Whereas, the relationships of TPSP ER to extraction time, temperature, and cross-
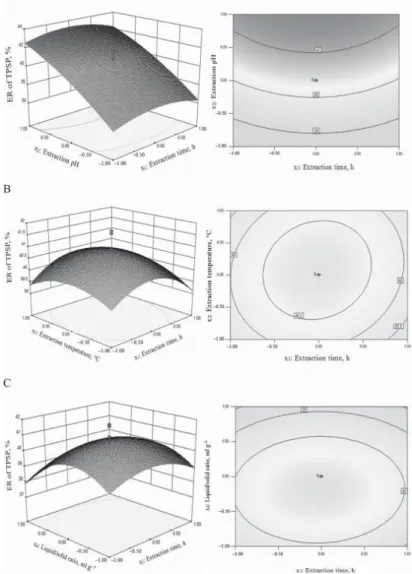
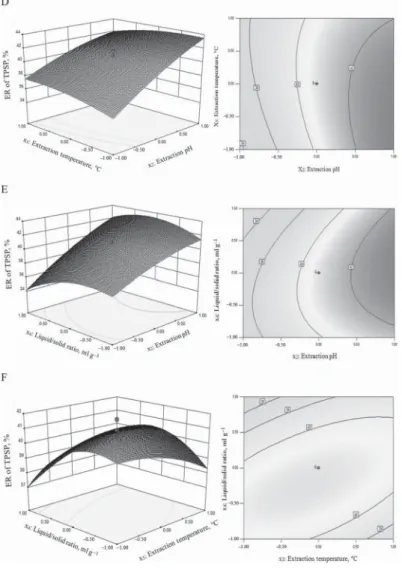
Fig. 2. Surface and contour plots for ER of TPSP. A, extraction pH vs time at temperature 60 ºC, liquid/solid ratio 10:1 ml g–1; B, extraction temperature vs time at pH 9.0, liquid/solid ratio 10:1 ml g–1; C, liquid/solid ratio vs extraction time at pH 9.0, temperature 60 ºC; D, extraction temperature vs pH at time 3.5 h, liquid/solid ratio 10:1 ml g–1; E, liquid/solid ratio vs extraction pH at time 3.5 h, temperature 60 ºC; F, liquid/solid ratio vs extraction
temperature at time 3.5 h, pH 9.0.
Fig. 2. Cont.
product terms (x1x2, x1x3, x1x4) were not signifi cant (P>0.05). These results indicated that pH and liquid/solid ratio were important contributing factors to ER of TPSP. To aid visualization, the response surfaces and contour plots of independent variables are shown in Figure 2A-F.
There was linear relation between pH and ER of TPSP, whereas time, temperature, and liquid/
solid ratio had a quadratic effect on ER of TPSP (Fig. 2A-F).
2.3. Optimum conditions and model verifi cation
From the model, optimum extraction conditions of TPSP were extraction time 3.42 h, pH 9.50, temperature 50.80 ºC, and liquid/solid ratio 9.54 ml g–1 with maximum predicted extraction ratio (43.60%) of TPSP. The suitability of the model equation for predicting the optimum response value was verifi ed by additional independent experiments using the
150
Acta Alimentaria 47, 2018
recommended optimum conditions. The experimental ER of TPSP (42.74%) was not signifi cantly different (P>0.05) from the predicted protein value (43.60%), confi rming the predictability of the model for ER of TPSP.
2.4. Gel electrophoresis
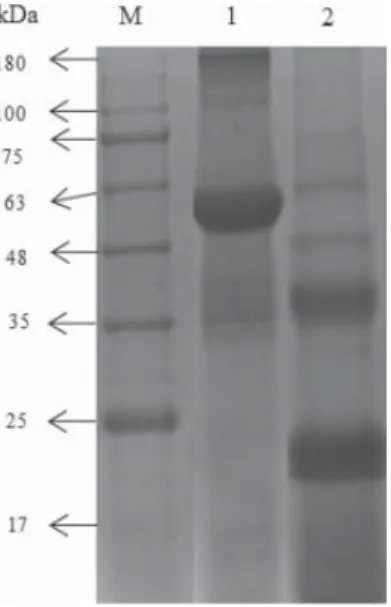
The pattern of the protein components distribution and molecular weight can be obtained from gel electrophoresis (ZHAO et al., 2016). SDS-PAGE pattern of TPSP is shown in Figure 3.
Lanes M, 1, and 2 are standard molecular weight marker, non-reducing and reducing TPSP, respectively. Non-reducing electrophoresis showed that TPSP was composed of four proteins with approximately 180, 100, 60, and 35 kDa, which of 60 kDa was the major protein. There were four subunits or proteins of 60, 48, 38, and 23 kDa in TPSP, with major subunits of 38 and 23 kDa by analysis of reducing electrophoresis.
Fig. 3. SDS-PAGE pattern of TPSP. Lanes M, 1, and 2 were marker, non-reducing and reducing TPSP bands
2.5. Amino acid analysis
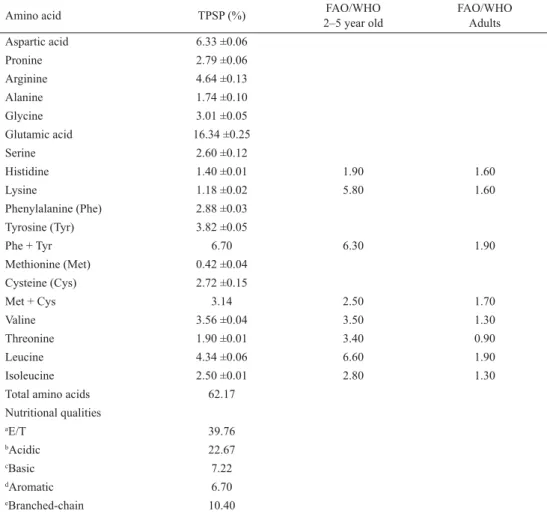
The quality of proteins largely depends on the composition of amino acids, which are fundamental building blocks of protein (TAN et al., 2011). Amino acid composition of TPSP is shown in Table 3. Leucine (4.34%), tyrosine (3.82%), valine (3.56%), phenylalanine (2.88%), cysteine (2.72%), isoleucine (2.50%), threonine (1.90%), histidine (1.40%), lysine (1.18%), and methionine (0.42%) belonged to ten essential amino acids in TPSP. In addition, TPSP had seven nonessential amino acids: glutamic acid (16.34%), aspartic acid (6.33%), arginine (4.64%), glycine (3.01%), proline (2.79%), serine (2.60%), and alanine (1.74%).
The proportion (39.76%) of essential amino acids to the total amino acids (E/T) in TPSP exceeded 36.00%, which was the minimum value (E/T) suggested by FAO/WHO/UNU (WHO, 1985). Moreover, the amount of sulphur-containing amino acids (3.14%) in TPSP was higher than the requirement of FAO/WHO/UNU for children (2.50%) and adult (1.70%), and the protein of tree peony fl ower (0.78%) (VOON et al., 2013 ). The high ratio (64.42%) of
aromatic amino acids (tyrosine, phenylalanine) to branched-chain amino acids (isoleucine, leucine, valine) in TPSP could improve muscle metabolism and maintain protein homeostasis (HERMAN et al., 2010; SUN et al., 2011; MALOMO& ALUKO, 2015). The low ratio (0.25) of lysine to arginine in TPSP might be benefi cial to cardiovascular health and less lipidemic and atherogenic (LING et al., 2016). In addition, the abundant content (25.63%) of glutamic acid and aspartic acid served TPSP as typical seed storage protein with acidic characteristic. The high content (18.48%) of glutamic acid in TPSP is benefi cial for human health in the control of glycogen synthesis and protein degradation (MUNDI & ALUKO, 2012). These results suggest that abundant amino acid composition in TPSP plays an important role in regulating various phys iological functions in the human body. Therefore, TPSP could be a benefi cial complement for edible plant protein in food industry.
Table 3. Amino acid composition of TPSP
Amino acid TPSP (%) FAO/WHO
2–5 year old
FAO/WHO Adults
Aspartic acid 6.33 ±0.06
Pronine 2.79 ±0.06
Arginine 4.64 ±0.13
Alanine 1.74 ±0.10
Glycine 3.01 ±0.05
Glutamic acid 16.34 ±0.25
Serine 2.60 ±0.12
Histidine 1.40 ±0.01 1.90 1.60
Lysine 1.18 ±0.02 5.80 1.60
Phenylalanine (Phe) 2.88 ±0.03
Tyrosine (Tyr) 3.82 ±0.05
Phe + Tyr 6.70 6.30 1.90
Methionine (Met) 0.42 ±0.04
Cysteine (Cys) 2.72 ±0.15
Met + Cys 3.14 2.50 1.70
Valine 3.56 ±0.04 3.50 1.30
Threonine 1.90 ±0.01 3.40 0.90
Leucine 4.34 ±0.06 6.60 1.90
Isoleucine 2.50 ±0.01 2.80 1.30
Total amino acids 62.17
Nutritional qualities
aE/T 39.76
bAcidic 22.67
cBasic 7.22
dAromatic 6.70
eBranched-chain 10.40
Values are means of triplicate analyses standard deviations.
a: E/T: the proportion of essential amino acids (EAA) to the total amino acids (TAA) of TPSP
b: acidic amino acids : glutamic acid, aspartic acid; c: basic amino acids : lysine, arginine, histidine;
d:aromatic amino acids : tyrosine, phenylalanine; e:branched-chain amino acids : isoleucine, leucine, valine
152
Acta Alimentaria 47, 2018
3. Conclusions
RSM technique proved to be a suitable tool in optimizing extraction conditions of TPSP. The generated regression model could well fi t relationship between the independent variables and the responses. The sequence of independent variables affecting ER of TPSP was pH> liquid/
solid ratio> temperature> time. The value of pH was the most important factor to ER of TPSP among four variables. The optimal parameters for ER of TPSP were 3.42 h, pH 9.50, 50.80 ºC, and liquid/solid ratio 9.54 ml g–1. The RSM-predicted maximum value (43.60%) of ER of TPSP was not signifi cantly (P>0.05) different from that of the experiment (42.74%). SDS- PAGE showed TPSP had mainly four proteins (180, 100, 60, and 35 kDa) with four subunits of 60, 48, 38, and 23 kDa. Therefore, TPSP was a kind of nutritional plant protein with reasonable amino acid composition, which could be as a supplement for plant protein in food industry.
*
The authors would like to express their gratitude to the National Natural Science Foundation of China (31371839), Major Plan of Studying and Developing (2015GSF120006), as well as the Program for Science and Technology Innovation Team in Universities of Henan Province (16IRTSTHN007).
References
CHEE, K.L., LING, H.K. & AYOB, M.K. (2012): Optimization of trypsin-assisted extraction, physicochemical characterization, nutritional qualities and functionalities of palm kernel cake protein. LWT – Food Sci.
Technol., 46, 419–427.
GUAN, X. & YAO, H. (2008): Optimization of Viscozyme L-assisted extraction of oat bran protein using response surface methodology. Food Chem., 106, 345–351.
HERMAN, M.A., SHE, P., PERONI, O.D., LYNCH, C.J. & KAHN, B.B. (2010): Adipose tissue branched chain amino acid (BCAA) metabolism modulates circulating BCAA levels. J. Biol. Chem., 285, 11348–11356.
JAIN, A., PRAKASH, M. & RADHA, C. (2015): Extraction and evaluation of functional properties of groundnut protein concentrate. J. Food Sci. Tech., 52, 6655–6662.
LI, C., DU, H., WANG, L., SHU, Q., ZHENG, Y., XU, Y., ZHANG, J.J., ZHANG, J., YANG, R.Z. & GE, Y. (2009): Flavonoid composition and antioxidant activity of tree peony (Paeonia section Moutan) yellow fl owers. J. Agr. Food Chem., 57, 8496–8503.
LI, S.S., WANG, L.S., SHU, Q.Y., WU, J., CHEN, L.G., SHAO, S. & YIN, D.D. (2015a): Fatty acid composition of developing tree peony (Paeonia section Moutan DC.) seeds and transcriptome analysis during seed development. BMC Genomics., 16, 1–8.
LI, S.S., YUAN, R.Y., CHEN, L.G., WANG, L.S., HAO, X.H., WANG, L.J., ZHENG, X.C. & DU, H. (2015b): Systematic qualitative and quantitative assessment of fatty acids in the seeds of 60 tree peony (Paeonia section Moutan DC.) cultivars by GC-MS. Food Chem., 173, 133–140.
LING, B., ZHANG, B., LI, R. & WANG, S. (2016): Nutritional quality, functional properties, bioactivity, and microstructure of defatted pistachio kernel fl our. J. Am. Oil Chem. Soc., 93, 689–699.
LOWRY, O.H., ROSEBROUGH, N.J., FARR, A.L. & RANDALL, R.J. (1951): Protein measurement with the Folin phenol reagent. J. Biol. Chem., 193, 265–275.
MA, T., WANG, Q. & WU, H. (2010): Optimization of extraction conditions for improving solubility of peanut protein concentrates by response surface methodology. LWT – Food Sci. Technol., 43, 1450–1455.
MALOMO, S.A. & ALUKO, R.E. (2015): Conversion of a low protein hemp seed meal into a functional protein concentrate through enzymatic digestion of fi bre coupled with membrane ultrafi ltration. Innov. Food Sci.
Emerg., 31, 151–159.
MUNDI, S. & ALUKO, R.E. (2012): Physicochemical and functional properties of kidney bean albumin and globulin protein fractions. Food Res. Int., 48, 299–306.
NING, C., JIANG, Y., MENG, J., ZHOU, C. & TAO, J. (2015): Herbaceous peony seed oil: a rich source of unsaturated fatty acids and γ-tocopherol. Eur. J. Lipid Sci. Tech., 117, 532–542.
SUN, X.H., ZHU, K.X. & ZHOU, H.M. (2009): Optimization of a novel backward extraction of defatted wheat germ protein from reverse micelles. Innov. Food Sci. Emerg., 10, 328–333.
SUN, H., LU, G., REN, S., CHEN, J. & WANG, Y. (2011): Catabolism of branched-chain amino acids in heart failure:
Insights from genetic models. Pediatr. Cardiol., 32, 305–310.
TAN, S.H., MAILER, R.J., BLANCHARD, C.L. & AGBOOLA, S.O. (2011): Canola proteins for human consumption:
Extraction, profi le, and functional properties. J. Food Sci., 76, R16–28.
TIRGAR, M., SILCOCK, P., CARNE, A. & BIRCH, E.J. (2017): Effect of extraction method on functional properties of fl axseed protein concentrates. Food Chem., 215, 417–424.
VOON, H.C., BHAT, R., KARIM, A.A. & ROSMA, A. (2013): Composition of tree peony (Paeonia suffruticosa) and Chinese apple fl ower (Malus spp.) buds. Int. Food Res. J., 20, 1173–1179.
WANI, A.A., KAUR, D., AHMED, I. & SOGI, D.S. (2008): Extraction optimization of watermelon seed protein using response surface methodology. LWT – Food Sci. Technol., 41, 1514–1520.
WHO (1985): Energy and protein requirements: report of a joint FAO/WHO/UNU expert consultation (WHO Technical Report Series, no 724). Geneva: WHO.
ZHAO, G.P., LI, Y.Q., SUN, G.J. & MO, H.Z. (2016): Effects of glycinin basic peptide on physicochemical characteristics and microbial inactivation of pasteurized milk. J. Dairy Sci., 7, 5064–5073.