Optimization of extraction of phenolic compounds from Tokaji Asz u marc using response surface
methodology
SZILVIA B ANV OLGYI €
1p, ESZTER DUSZA
1, FIINA K. NAMUKWAMBI
2, ISTV AN KISS
3, EVA STEFANOVITS-B ANYAI
4and GYULA VATAI
11Department of Food Engineering, Faculty of Food Science, Szent Istvan University, Hungary
2Department of Food Science and Technology, Faculty of Agriculture and Natural Resources, University of Namibia, Namibia
3Fitomark 94 Ltd., Tolcsva, Hungary
4Department of Applied Chemistry, Faculty of Food Science, Szent Istvan University, Hungary
CONFERENCE FULL PAPER
Received: January 31, 2020 • Accepted: August 25, 2020 Published online: October 13, 2020
© 2020 The Author(s)
ABSTRACT
Similarly to other industries wineries also increasingly attempt to minimize and utilize waste to protect our environment. The aim of this study was to determine the optimal parameters (temperature, solvent con- centration, and time) of extracting total polyphenol content (TPC) from Tokaji Aszu marc using two different extraction solvents: ethanol–water and isopropanol–water (1:4 solid/liquid ratio). The extractions were achieved based on Central Composite Design with Response Surface Method (CCRD–RSM). The optimal extraction parameters in the case of ethanol–water solvent: 608C temperature, 59.5% ethanol concentration in solvent, 5 h. At these parameters the probable TPC concentration is 23966.2 uM GAE/L.
The optimal extraction parameters in the case of isopropanol–water solvent: 60 8C temperature, 52%
ethanol concentration in solvent, 5 h. At these parameters the probable TPC concentration is 7188.44 uM GAE/L. In both cases the binary solvent was better than the mono-solvent. Ethanol–water solvent was more efficient than the isopropanol–water solvent.
pCorresponding author. E-mail: Banvolgyi.Szilvia@szie.hu
KEYWORDS
extraction, grape marc, phenolics, ethanol, isopropanol
INTRODUCTION
Nile et al. (2013), Lafka et al. (2007), and Spigno et al. (2007)declared that grapes are among the fruits that have the highest content of phenolic compounds.Ignat et al. (2011), and Vatai et al.
(2009) found that natural phenols have excellent properties as natural colorants and food preservatives. Polyphenol antioxidants are used as food additives to protect against food dete- rioration (Singh and Immanuel, 2014). The polyphenol content has many favorable effects on the human health, such as the inhibition of the oxidization of low-density lipoproteins and the anti-carcinogenic effects (Spigno et al., 2007; Bonilla et al., 1999). The grapes are also rich in antioxidants. Antioxidants are beneficial to health because they have protective role against oxidative stress. Antioxidants have an important role in preventing the development of many diseases such as cancer and coronary heart disease (Alıa et al., 2003).
Wine production generates a huge amount of waste which is considered as unbeneficial and potentially causes environment problems. Therefore, there is a need for guidelines to manage this waste through technologies that minimize their environmental impact and lead to a sus- tainable use of resources similarly to other industries (Guida and Hannioui, 2016). However, due to the advancement of technology some wineries make an effort to minimize the remaining waste. The necessary development of innovation and effective valorization procedures has been implemented to reduce winery waste (Teixeira et al., 2014). Winery waste is regarded as a low- cost source of antioxidant and phenolic compounds (Spigno et al., 2007). Wine making residues include organic waste (grape marc, seeds, pulp and skin, grape stems, and leaves), wastewater, emission of greenhouse gases, and inorganic waste (Teixeira et al., 2014; Musee et al., 2007). In Hungary the most famous grape species is the Tokaji Aszu. The natural or induced development of noble rot is caused by the fungusBotrytis cinerea. There must be three basic conditions for the noble rot: (1) the grape should be in full maturity when the wet weather induces the growing of the fungi, (2) at the same time the grape should be intact and free from injury, and (3) a few days of rainy weather followed by a long and dry period (Eperjesi et al., 1998). Finding the optimal parameters for a certain process can improve the quality offinal product (Varga et al., 2019).
There is just scarce research which was carried out to optimize the yield of bioactive compounds extracted from Tokaji Aszu marc (winery waste). The industry does not use this material in notable volume. Some part of it is used in alcohol or grape seed oil production, however, the majority of it is not utilized.
In the present paper, organic waste (grape marc) was studied. This waste is generated during the production of must (grape juice) after pressing the whole fruits (Teixeira et al., 2014).S¸ahin et al. (2013), Maskovic et al. (2016), and Chew et al. (2011)describe that different extraction conditions such as the type and concentration of the solvent, pH, temperature and time, pressure, and the size of particles may significantly influence the quantitative parameters (total phenolic compounds) and qualitative parameters (antioxidant capacity) present in grapes by- product. The objective of the present study was tofind the optimal extraction parameters (time, temperature, solvent concentration) to maximize the retrieval of phenolics from Tokaji Aszu marc applying single stage solvent extraction.
MATERIALS AND METHODS
Material and chemicals
The Fitomark Ltd. (Tolcsva) provided the Tokaji Aszu marc (grape type was Furmint), which was generated in 2016 and stored in a frozen state until the experiments.
Folin–Ciocalteu reagent was purchased from Merck KGaA. (Darmstadt, Germany), the gallic acid was obtained from Sigma-Aldrich, Chemicals Company (St. Louis, MO, USA). The methanol and sodium carbonate were purchased from Reanal Laborvegyszer Ltd. (Budapest, Hungary).
Extraction procedure
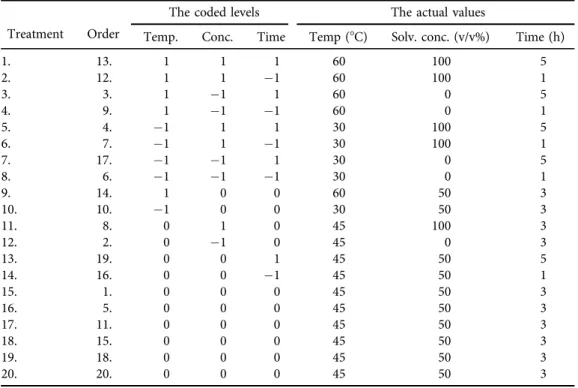
The carried-out extraction is based on a central composite design. Three parameters were changed during the extractions: the time of the extraction, the temperature, and the solvent concentration. Every parameter has a minimum, a central, and a maximum point (Table 1). The solvent-to-sample ratio was 4:1. Lauda Ecoline E100 Immersion Thermostat was used to keep the temperature at a constant level. Continuous stirring (215 rpm) was used during extractions, the evaporation loss of the solvent was obviated by a cover. The extraction solvent contained distilled water and alcohol (ethanol or iso-propanol), in different ratios.
Response surface methodology (RSM) technique was used to optimize the extraction con- ditions aimed at maximum recovery of polyphenol. The RSM is an empirical statistical tech- nique employed for multiple regression analysis using quantitative data. It uses multivariable data obtained from carefully designed experiments to resolve multivariable scenarios simulta- neously (S¸ahin et al., 2013). The experiments were made in randomized order, starting, and finishing the experiment series with a center point run (Table 2).
The center point measurements were dispersed as evenly as possible throughout the design matrix and repeated 6 times. Design Expert 11.0 software was used for optimization of ex- tractions parameters and statistical analysis. A second-order polynomial equation was used to calculate the predicted response.
Analysis of total polyphenol content (TPC)
TPC of each sample were analyzed according to Folin-Ciocalteu assay (Singleton and Rossi, 1965; Koczka et al., 2018). The sample solution (50
m
L, 3 replicates) was mixed with 1,250m
LFolin-Ciocalteu reagent and 200
m
L methanol–distilled water (4:1) solution. After exactly 1 minute, 1,000m
L 0.7 M sodium carbonate solution was added to the sample solution. The sample mixture was put in thermal bath which maintained the temperature at 50 8C. TheTable 1.Range of coded and actual values of extraction parameters for Central Composite Design
Level Temperature (8C) Time (h)
Solvent concentration
Water (%) Alcohol (%)
1 30 1 100 0
0 45 3 50 50
1 60 5 0 100
absorbance was measured at 760 nm after 5 min incubation. The calibration was done by using gallic acid as standard and gave R2 value of 0.99. TPC was calculated using the equation of standard curve considering the dilution factor and was expressed in
m
M equivalents of gallic acid (GAE)/L.RESULTS AND DISCUSSION
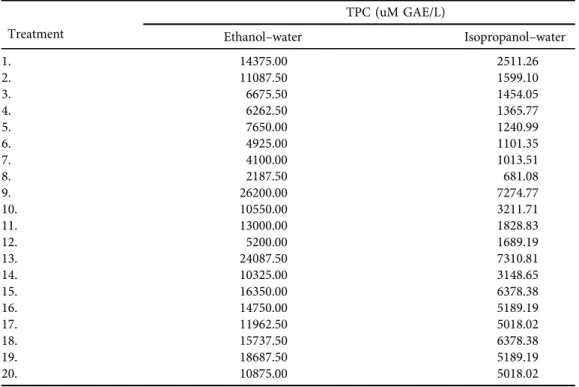
It was necessary to investigate the extraction parameters in order to determine the best com- bination of variables for the total polyphenol content from Tokaji Aszu marc. RSM technique was used to optimize the extraction conditions aimed at maximum recovery of polyphenol. The experimental data in terms of total polyphenol content are shown inTable 3.
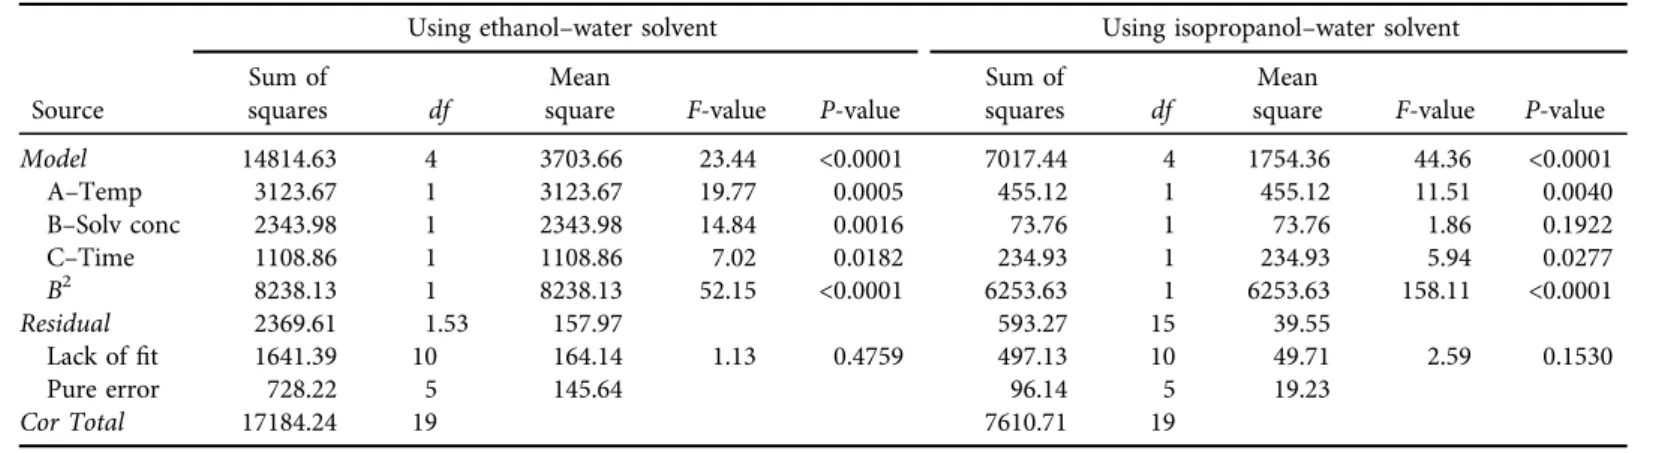
The effects of each factor and their interaction were calculated using Design Expert program (version 11.0.0). Fitting the data with various models and, subsequently, the analysis of variance (ANOVA) showed that total phenolic content was best described with quadratic polynomial model. The quadratic polynomial model was highly significant and sufficient to represent the actual relationship between the response and significant parameters with very low P-value (<0.0001) (Table 4).
Predicted values of dependent variables were obtained from the regression model. Statistical analysis showed that some linear and quadratic coefficients of regression model were significant (P < 0.05) whereas the lack offit was nonsignificant (P≥ 0.05) which validates the model. In
Table 2.Central Composite Design of factors with coded and actual values
Treatment Order
The coded levels The actual values
Temp. Conc. Time Temp (8C) Solv. conc. (v/v%) Time (h)
1. 13. 1 1 1 60 100 5
2. 12. 1 1 1 60 100 1
3. 3. 1 1 1 60 0 5
4. 9. 1 1 1 60 0 1
5. 4. 1 1 1 30 100 5
6. 7. 1 1 1 30 100 1
7. 17. 1 1 1 30 0 5
8. 6. 1 1 1 30 0 1
9. 14. 1 0 0 60 50 3
10. 10. 1 0 0 30 50 3
11. 8. 0 1 0 45 100 3
12. 2. 0 1 0 45 0 3
13. 19. 0 0 1 45 50 5
14. 16. 0 0 1 45 50 1
15. 1. 0 0 0 45 50 3
16. 5. 0 0 0 45 50 3
17. 11. 0 0 0 45 50 3
18. 15. 0 0 0 45 50 3
19. 18. 0 0 0 45 50 3
20. 20. 0 0 0 45 50 3
both cases (using ethanol–water or iso-propanol–water solvent) the interaction coefficients were not significant, so the model was reduced. Finally, it contains only the linear and quadratic coefficients (Table 4).
The final regression equations (Eqs. (1) and (2))with linear and square coefficients in terms of actual factors:
For ethanol–water solvent:
Yð ffiffiffiffiffiffiffiffiffiffiffiffiffi ðTPCÞ
p Þ ¼−0:0665þ1:18_sAþ1:93_sBþ5:27_sC0:016_sB2 (1)
For iso-propanol–water solvent:
Yð ffiffiffiffiffiffiffiffiffiffiffiffiffi ðTPCÞ
p Þ ¼7:32þ0:45_sAþ1:47_sBþ2:42_sC0:014_sB2 (2)
whereA is the temperature (30–60 8C), Bis the alcohol concentration in the solvent (0–100 v/v%) andCis the extraction time (1–5 h).
The relationship between extraction parameters and total polyphenol content were inves- tigated by response surface plots selecting two independent values while remaining one at zero level. The highest total polyphenol content was observed at higher temperature (Fig. 1). High temperatures might have increased the diffusion and solubility rate of many compounds resulting higher extraction rate in phenolic compounds (S¸ahin et al., 2013). In both cases the binary solvent (1:1) was better than mono-solvent. According to the model the total polyphenol
Table 3.Central Composite Design of factors with experimental values
Treatment
TPC (uM GAE/L)
Ethanol–water Isopropanol–water
1. 14375.00 2511.26
2. 11087.50 1599.10
3. 6675.50 1454.05
4. 6262.50 1365.77
5. 7650.00 1240.99
6. 4925.00 1101.35
7. 4100.00 1013.51
8. 2187.50 681.08
9. 26200.00 7274.77
10. 10550.00 3211.71
11. 13000.00 1828.83
12. 5200.00 1689.19
13. 24087.50 7310.81
14. 10325.00 3148.65
15. 16350.00 6378.38
16. 14750.00 5189.19
17. 11962.50 5018.02
18. 15737.50 6378.38
19. 18687.50 5189.19
20. 10875.00 5018.02
Table 4.ANOVA table for reduced quadratic models for ethanol–water and isopropanol–water solvent Using ethanol–water solvent Using isopropanol–water solvent Source
Sum of
squares df
Mean
square F-value P-value
Sum of
squares df
Mean
square F-value P-value
Model 14814.63 4 3703.66 23.44 <0.0001 7017.44 4 1754.36 44.36 <0.0001
A–Temp 3123.67 1 3123.67 19.77 0.0005 455.12 1 455.12 11.51 0.0040
B–Solv conc 2343.98 1 2343.98 14.84 0.0016 73.76 1 73.76 1.86 0.1922
C–Time 1108.86 1 1108.86 7.02 0.0182 234.93 1 234.93 5.94 0.0277
B2 8238.13 1 8238.13 52.15 <0.0001 6253.63 1 6253.63 158.11 <0.0001
Residual 2369.61 1.53 157.97 593.27 15 39.55
Lack offit 1641.39 10 164.14 1.13 0.4759 497.13 10 49.71 2.59 0.1530
Pure error 728.22 5 145.64 96.14 5 19.23
Cor Total 17184.24 19 7610.71 19
ProgressinAgriculturalEngineeringSciences16(2020)S1,1–9
content in the extracts is predicted to decrease above 60% (v/v) of alcohol content in the extraction solvent.Chew et al. (2011)reported similar results. Ethanol–water solvent was more efficient than the isopropanol–water solvent.
An increase in temperature has greater effect than an increase in extraction time on total polyphenol concentration in Tokaji Aszu marc extracts using ethanol –water solvent. A slight increase in TPC concentration can be observed in 5 h, but after an increase in temperature the TPC concentration increased by 2–2.5 times (Fig. 2a). However, the effect of changing extraction time was significant for extracting phenolic compounds. In the case of isopropanol–water sol- vent the same trend was found.
Fig. 1.Response surface plots showing the effect of solvent concentration and temperature on the poly- phenols yield (uM GAE/L) from Tokaji Aszu marc waste while the time kept at coded zero level. (a) Using
ethanol–water solvent. (b) Using isopropanol–water solvent
Fig. 2.Response surface plots showing the effect of temperature and time on the polyphenols yield (uM GAE/L) from Tokaji Aszu marc waste while the solvent concentration kept at coded zero level. (a) Using
ethanol–water solvent. (b) Using isopropanol–water solvent
The optimal extraction parameters in the case of ethanol–water solvent: 608C temperature, 59.5% ethanol concentration in solvent, 5 h. With these parameters the probable TPC con- centration is 23966.2 uM GAE/L. The optimal extraction parameters in the case of isopropanol–
water solvent: 60 8C temperature, 52% ethanol concentration in solvent, 5 h. With these pa- rameters the probable TPC concentration is 7188.44 uM GAE/L. The optimal parameters can vary in other ranges of parameters.
CONCLUSIONS
The polyphenols were extracted from Tokaji Aszu marc waste following twenty selected com- binations of temperature, solvent concentration, and extraction time. A second order model was developed to predict the polyphenol content. Ethanol–water solvent was more effective than isopropanol–water solvent. In the future we would like to continue the experiments with a new design with a narrower interval of parameters (40–608C temperature, 3–5 h extraction time and 25–75 v/v% alcohol content in extraction solvent) using real solvent mixtures for extractions.
The present study helps with the utilization of Tokaji Aszu marc waste and with the optimi- zation of extraction parameters in maximizing the recovery of polyphenols. This optimization process provides valuable data which can be utilized in process design and industrial scale-up operations.
ACKNOWLEDGMENTS
This project was supported by the European Union and co-financed by the European Social Fund (Grant agreement no. EFOP-3.6.3-VEKOP-16-2017-00005); and by the UNKP-17-2-II- SZIE-44 New National Excellence Program of the Ministry of Human Capacities.
REFERENCES
Alıa, M., Horcajo, C., Bravo, L., and Goya, L. (2003). Effect of grape antioxidant dietaryfiber on the total
antioxidant capacity and the activity of liver antioxidant enzymes in rats. Nutrition Research, 23(9):
1251–1267.
Bonilla, F., Mayen, M., Merida, J., and Medina, M. (1999). Extraction of phenolic compounds from red grape marc for use as food lipid antioxidants.Food Chemistry, 66(2): 209–215.
Chew, K.K., Khoo, M.Z., Ng, S.Y., Thoo, Y.Y., Mustapha, W.A.W., and Ho, C.W. (2011). Effect of ethanol concentration, extraction time and extraction temperature on the recovery of phenolic compounds and antioxidant capacity of Orthosiphon stamineus extracts. International Food Research Journal, 18(4):
1427–1435.
Eperjesi, I., Kallay, M., and Magyar, I. (1998). Rothadasi folyamatok a sz}ol}on. In:Recsey Antonia (szerk.), Boraszat. Mez}ogazda Kiado, Budapest, pp. 459–465.
Guida, M.Y. and Hannioui, A. (2016). A review on thermochemical treatment of biomass: Pyrolysis of olive mill wastes in comparison with other types of biomass.Progress in Agricultural Engineering Sciences, 12(1): 1–23.
Ignat, I., Volf, I., and Popa, V.I. (2011). A critical review of methods for characterisation of polyphenolic compounds in fruits and vegetables.Food Chemistry, 126(4): 1821–1835.
Koczka, N., Stefanovits-Banyai, E., and Ombodi, A. (2018). Total polyphenol content and antioxidant capacity of rosehips of someRosaspecies. Medicines, 5(3): 84–94.
Lafka, T., Sinanoglou, V., and Lazos, E.S. (2007). On the extraction and antioxidant activity of phenolic compounds from winery wastes.Food Chemistry, 104(3): 1206–1214.
Maskovic, P.Z., Diamanto, L.D., Cvetanovic, A., Radojkovic, M., Spasojevic, M.B., and Zengin, G. (2016).
Optimization of the extraction process of antioxidants from orange using response surface method- ology.Food Analytical Methods, 9(5): 1436–1443.
Musee, N., Lorenzen, L., and Aldrich, C. (2007). Cellar waste minimization in the wine industry: A systems approach. Journal of Cleaner Production, 15(5): 417–431.
Nile, S.H., Kim, S.H., Ko, E.Y., and Park, S.W. (2013). Polyphenolic content and antioxidant properties of different grape (V. vinifera,V. labrusca, andV. hybrid) cultivars.BioMed Research International, 2013:
718065.
S¸ahin, S., Aybastier, O., and Is¸ik, E. (2013). Optimisation of ultrasonic-assisted extraction of antioxidant compounds fromArtemisia absinthiumusing response surface methodology.Food Chemistry, 141(2):
1361–1368.
Singh, S. and Immanuel, G. (2014). Extraction of antioxidants from fruit peels and its utilization in paneer.
Journal of Food Processing & Technology, 5(7): 349.
Singleton, V.L. and Rossi, J.A. (1965). Colorimetry of total phenolics with phosphomolybdic-phospho- tungstic acid reagents.American Journal of Enology and Viticulture, 16: 144–158.
Spigno, G., Tramelli, L., and De Faveri, D.M. (2007). Effects of extraction time, temperature and solvent on concentration and antioxidant activity of grape marc phenolics.Journal of Food Engineering, 81(1):
200–208.
Teixeira, A., Baenas, N., Dominguez-Perles, R., Barros, A., Rosa, E., Moreno, D.A., and Garcia-Viguera, C.
(2014). Natural bioactive compounds from winery by-products as health promoters: Overview.Inter- national Journal of Molecular Sciences, 15(9): 15638–15678.
Varga,A., G aspar, I., Juhasz, R., Ladanyi, M., Hegyes-Vecseri, B., Kokai, Z., and Marki, E. (2019). Beer microfiltration with static turbulence promoter: Sum of ranking differences comparison.Journal of Food Process Engineering, 42(1): e12941.
Vatai, T., Skerget, M., and Knez, Z. (2009). Extraction of phenolic compounds from elderberry and different grape marc varieties using organic solvents and or supercritical carbon dioxide.Journal of Food Engineering, 90(2): 246–254.
Open Access.This is an open-access article distributed under the terms of the Creative Commons Attribution 4.0 International License (https://creativecommons.org/licenses/by/4.0/), which permits unrestricted use, distribution, and reproduction in any medium, provided the original author and source are credited, a link to the CC License is provided, and changes–if any–are indicated. (SID_1)