THE ROLE OF NEURON-MICROGLIA
FRACTALKINE SIGNALING IN ORGANIZATION OF RESPONSES TO ACUTE AND CHRONIC
STRESSORS
PhD thesis
Zsuzsanna Winkler
János Szentágothai Doctoral School of Neuroscience Semmelweis University
Supervisor: Krisztina Kovács, D.Sc Official reviewers: Árpád Dobolyi, D.Sc
István Ábrahám, D.Sc
Head of the Final Examination Committee: Károly Rácz, MD, D.Sc Members of the Final Examination Committee: Imre Kalló, Ph.D
Anna Földes, Ph.D
Budapest
2017
2
Table of Contents
1. The list of Abbreviation ... 5
2. Introduction ... 8
2.1. The stress concept/ Homeostasis and allostasis ... 8
2.2. The hypothalamo-pituitary-adrenocortical (HPA) axis ... 9
2.3. Afferent inputs to CRH neurons in the paraventricular nucleus (PVN) ... 9
2.4. Origin of microglia in the brain ... 13
2.5. Neuron-microglia communication in the brain ... 13
2.6. Fractalkine/ Fractalkine receptor ... 15
2.7. Fractalkine receptor deficient mice ... 16
3. Objectives ... 17
4. Methods ... 18
4.1. Animals ... 18
4.2. Analysis of metabolic parameters ... 18
4.3. Behavior tests ... 19
4.3.1. Open-field test (OF) ... 19
4.3.2. Elevated plus-maze test (EPM) ... 19
4.3.3. Forced swim test (FST) ... 20
4.3.4. Tail suspension test (TST)... 20
4.4. Acute restraint stress ... 21
4.5. Two-hit stress protocol ... 21
4.6. Sucrose consumption test ... 23
4.7. Hypoglycemic stress ... 24
4.8. Intracerebroventricular injection ... 24
4.9. High-fat diet ... 24
4.10. Cold stress and core body temperature measurement ... 25
4.11. Tissue processing ... 25
4.12. c-Fos and Iba1 immunocytochemistry ... 26
4.13. Double immunofluorescence for c-FOS and SMI 32 immunoreactivity ... 26
4.14. Imaging, quantification and data analysis ... 27
4.15. c-Fos and Iba1 double immunohistochemistry ... 28
3
4.16. Combined Immunohistochemical Labeling and In Situ Hybridization (ISH) ... 29
4.17. Gene expression analysis by quantitative real-time PCR ... 30
4.18. ACTH and corticosterone measurement ... 31
4.19. Catecholamine determination ... 31
4.20. Cell culture ... 31
4.21. Statistical analysis ... 32
5. Results ... 33
5.1. Effects of acute psychological stress on fractalkine receptor deficient mice (CX3CR1 -/-) ... 33
5.1.1. Home cage locomotor activity and behavior tests with acute stress component ... 33
5.1.1.1. Home cage activity ... 33
5.1.1.2. Open field test ... 33
5.1.1.3. Elevated plus maze test ... 33
5.1.1.4. Forced swim test ... 33
5.1.1.5. Tail suspension test ... 34
5.1.2. Acute psychological stress induced c-Fos expression in the PVN and the hypothalamo-pituitary-adrenocortical axis activity ... 35
5.1.3. Effect of acute restraint stress on the microglia in the paraventricular nucleus of the hypothalamus ... 37
5.2. Effects of “Two hit” chronic stress paradigm on fractalkine receptor deficient mice (CX3CR1 -/-) ... 39
5.2.1. Body weight gain and behavioral responses ... 39
5.2.2. The effect of MS+CVS on the hypothalamo-pituitary-adrenocortical axis activity ... 41
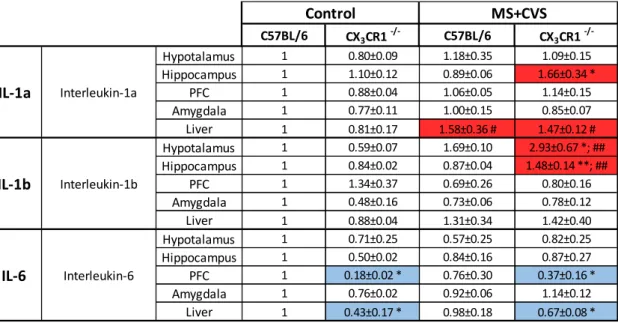
5.2.3. The effect of MS+CVS on the central and peripheral proinflammatory cytokine gene expression ... 43
5.2.4. Effects of MS+CVS on the microglia in the paraventricular nucleus ... 45
5.3. Effects of acute physiological challenge on CX3CR1-/-mice ... 47
5.3.1. Effects of fasting and insulin-induced hypoglycemia on metabolic parameters ... 47
5.3.2. Fractalkine receptor (CX3CR1) deficient mice mount increased counter- regulatory responses to neuroglycopenia and insulin-induced hypoglycemia ... 50
4
5.3.3. Hypoglycemia selectively activates orexigenic neurons in the hypothalamic
arcuate nucleus ... 52
5.3.4. Hypoglycemia results in morphological changes in microglia selectively in the hypothalamic arcuate nucleus ... 54
5.3.5. Activated microglia make close appositions with c-Fos positive neurons in the arcuate nucleus ... 57
5.4. Minocycline attenuates microglia activation and results in less severe hypoglycemic response to insulin ... 58
5.5. Critical involvement of interleukin IL-1 in attenuation of counter-regulatory responses to hypoglycemia ... 60
5.6. Effects of high-fat diet (HFD) as a chronic metabolic stress model on CX3CR1 -/- mice ... 61
5.6.1. HFD induced-obesity ... 61
5.6.2. Fractalkine receptor deficiency restrained microglial activation in chronic HFD-fed mice in the ARC ... 61
5.6.3. Fractalkine receptor deficient mice increase thermogenesis and display cold tolerance to acute cold stress ... 62
6. Discussion ... 64
6.1. Behavioral alterations in CX3CR1-/- mice ... 64
6.2. Stress-induced activation of HPA axis and extended brain stress system - differences in CX3CR1-/- mice ... 65
6.3. CX3CR1 dependent, stress-induced activation of hypothalamic microglia ... 68
6.4. HFD-induced microglial activation ... 70
6.5. Microglial activation evoked by insulin induced hypoglycemia ... 71
6.6. The role of microglial IL-1 in compromised compensatory responses to hypoglycemic stress ... 73
7. Conclusions ... 75
8. Summary ... 77
9. Összefoglalás ... 78
10. Bibliography ... 79
11. Bibliography of the candidate’s publications ... 92
12. Acknowledgements ... 93
5
1. The list of Abbreviation
2-DG 2-deoxy-glucose
ACTH adrenocorticotrop hormone
AgRP agouti-related peptid
ARC hypothalamic arcuate nucleus
C1 catecholaminergic group of cells in the basolateral medulla CART cocaine- and amphetamine-regulated transcript
CNS central nervous system
CORT corticosterone
CRH corticotropin-releasing hormone
CSF1R colony stimulating factor 1 receptor
CVS chronic variable stress
CX3CR1 fractalkine receptor
CX3CR1 -/- mice fractalkine receptor deficient mice DAMPS danger-associated molecular patterns dBNST bed nucleus of the stria terminalis
EPM elevated plus maze test
FFAs free fatty acids
FST forced swim test
GE neurons glucose excited GI neurons glucose inhibited
GLUT5 glucose transporter 5
GR glucocorticoid receptor
HAAF hypoglycemia associated autonomic failure
HFD high-fat diet
HMGB1 high-mobility group box 1
HPA axis hypothalamo–pituitary–adrenocortical axis
Hsp72 heat-shock protein 72
6
Iba1 ionized calcium-binding adaptor molecule 1
icv. intracerebroventricular
IEG immediate early gene
IGF-1 insulin-like growth factor 1
IL-1 interleukin-1
ip. intraperitoneal
ir. immunoreactivity
IRS-1, IRS-2 insulin receptor substrates 1, 2 KATP channel ATP-sensitive potassium channel
LPS lipopolysaccharide
MBH mediobasal hypothalamus
MCT1, MCT2 monocarboxylate transporters 1,2
MePO median pre-optic nucleus
mPFC medial prefrontal cortex
MR mineralocorticoid receptors
MS maternal separation
NE norepinephrine
NF-κB nuclear factor kappa-light-chain-enhancer of activated B cells NLRP3 NACHT, LRR and PYD domains-containing protein 3
NPY neuropeptide Y
NTS nucleus of the solitary tract
OGD oxygen glucose deprivation
OVLT vascular organ of lamina terminalis
P2X7 P2X purinoceptor 7
PAG periaqueductal gray
PAMPS pathogen activated molecular patterns
PB parabrachial nucleus
pCREB phosphorylation of cyclic AMP response element binding
PKA protein kinase A
7
PLX5622 Plexxikon 5622
POMC proopimelanocortin
PVN hypothalamic paraventricular nucleus
RT-qPCR Real-time quantitative PCR
SEM standard error of the mean
SFO subfornical organ
siRNA silencing ribonucleic acid
TH tyrosine hydroxylase
TLRs toll-like receptors
TST tail suspension test
8
2. Introduction
2.1. The stress concept/ Homeostasis and allostasis
All living organisms strive to maintain homeostasis, a dynamic equilibrium of crucial internal parameters. Walter Cannon was the first who defined the term “homeostasis”, as “coordinated physiological processes which maintain most of the steady states in the organism” [1]. Hans Selye defined “stress” as a nonspecific response of the body, the
“stress syndrome” with the same pathological triad (adrenal enlargement, thymus involution, gastrointestinal ulceration) evoked by diverse kind of stressors (bacterial infection, toxins, physical stimuli) [2]. Selye also introduced the phrase “general adaptation syndrome”, which consists of three successive phases: alarm reaction (mobilizing resources), stage of resistance (coping with stressor), stage of exhaustion [3].
The first definition of allostasis was introduced by Sterling and Eyer, which literally means “achieving stability through change” [4]. Stressors trigger physiological and behavioral responses that are aimed at reinstating a new balance, help the organism to cope with the situation. Stress response is manifested as rapid activation of the sympathetic nervous system and hypothalamo-pituitary-adrenocortical (HPA) axis, but includes changes in many other central and peripheral functions including autonomic arousal, metabolism, immune and hormonal regulation, cognition, emotion, memory and behavior. The coping is effective, if the stress response is rapidly activated and efficiently terminated [5]. The processes that underlie the stress response have been collectively termed “allostasis”. If the stress response is inadequate or excessive and prolonged, the cost of restoring homeostasis might become too high, and can lead to maladaptation (cardiovascular, gastrointestinal, metabolic, immunological dysfunction and mood disorders). The term, allostatic load was proposed by McEwen [6] and is the
“price” of the adaptation during lifespan. There are four major conditions that lead to allostatic load:
repeated hits from multiple stressors
lack of habituation to the recurrence of the same stressor
prolonged response: not turning off the response when it is no longer needed
inadequate response: for example inadequate secretion of glucocorticoids
9
In terms of duration, stressors may be classified into two main categories: acute or chronic, prolonged exposure [7]. Acute stressors induce adaptive physiological and behavioral responses that are essential to reinstate homeostatic balance. Acute stress mobilizes energy reserves, sensitizes immune cells to provide tools for coping and for preparation for future exposure to additional, predictable or unpredictable challenges. In the stress response, fast-acting agents (such as catecholamines, neuropeptides, non- genomic glucocorticoid action) and slower, gene-mediated corticosteroid effects contribute to an adequate response to the stressor, which leads to enhanced vigilance, alertness and focused attention. At systems level, increase of gluconeogenesis, glycogenolysis, proteolysis or lipolysis provide energy supply to “crucial” organs.
2.2. The hypothalamo-pituitary-adrenocortical (HPA) axis
The neuroendocrine stress response can be viewed as a reflex regulation, where corticotropin-releasing hormone (CRH) and vasopressin (AVP)-synthesizing neurons in the parvocellar part of the hypothalamic paraventricular nucleus (PVN) are in the reflex centrum. These neuropeptides are secreted into the portal vessel system and stimulate adrenocorticotropin (ACTH) from the pituitary. ACTH increases adrenal cortical secretion of cortisol (in human), and corticosterone (in rodents). Corticosteroids are bound to nuclear mineralocorticoid (MR) and glucocorticoid (GR) receptors. MR is implicated in the appraisal process and the early-phase of the stress response. GR is activated by higher amounts of corticosteroids, terminate stress reactions, mobilize energy resources and facilitate recovery [8].
2.3. Afferent inputs to CRH neurons in the paraventricular nucleus (PVN)
Several afferent inputs trigger directly the stress-related CRH neurons in the PVN.
These include pathways arising from neuron groups associated with most major sensory systems (Fig.1.) [9]. Viscerosensory and somatosensory inputs are transduced by the ascending (catecholaminergic) pathway originating in the nucleus of the solitary tract and associated structures in the ventrolateral medulla [10] [11]. Neurons in the NTS send direct projections to hypophysiotropic corticotropin-releasing hormone (CRH) neurons and control activation of HPA axis to acute physiological, systemic stressors.
10
Norepinephrine (NE) action through alpha1 receptors is primarily excitatory, working directly on parvocellular neurons by increasing CRH mRNA expression via cAMP- PKA-pCREB signal transduction pathway [12]. NE may also act through presynaptic activation of glutamate release onto PVN neurons [13]. However, at higher levels of stimulation, NE effect may turn into inhibition (possibly via beta receptors). During chronic stress, lesions of ascending noradrenergic fibers attenuate stress-induced ACTH but not corticosterone release, indicating reduction in central HPA drive and increased adrenal sensitivity [14]. Glucagon-like peptide 1 (GLP-1) containing [15], prolactin- releasing peptide PrRP [16] and nesfatin [17] synthesizing noradrenergic neurons in the NTS play a broader role in stress regulation, these cells are recruited by both systemic and psychogenic stressors and involved in HPA axis sensitization under conditions of chronic stress. This neuron population -as being sensitive to metabolic cues- might also play a role in adjustment of stress response to actual energetic state of the animal [18] [14].
Neural inputs from the contiguous cell group comprising the vascular organ of the lamina terminalis (OVLT) convey information to the neurosecretory cells regarding blood borne signals related to the ion and volume homeostasis [19] and suggested as entry site for blood borne cytokines [20].
Intrahypothalamic inputs from the median eminence/arcuate region mediate nutrient- (glucose, FFA) and metabolic- (leptin, ghrelin, insulin)-associated cues. Orexigenic (NPY/AgRP) and anorexigenic (POMC/CART) cells in the arcuate nucleus are equipped with leptin, insulin and ghrelin receptors and it has been reported that leptin hyperpolarizes NPY neurons and depolarizes POMC neurons [21]. By contrast, ghrelin, acting through growth hormone secretagogue receptor stimulates AgRP and inhibits POMC neurons [22]. On the other hand, insulin receptors on AgRP neurons play an essential role in regulation of hepatic glucose production [23]. In particular, for glucose sensing, two, (electro) physiologically and functionally distinct neuron population have been identified in the CNS, which provide metabolic related information to the neurosecretory neurons. Glucose excited (GE) neurons are activated by increased glucose levels, whereas glucose inhibited (GI) neurons are stimulated when glucose levels declining [24]. In GE neurons, internalization of lactate by monocarboxylase
11
transporter and oxidative phosphorylation of glucose increases ATP production resulting in increased ATP/ADP ratio and in closure of KATP channels. This leads to plasma membrane depolarization and activation of voltage-sensitive Ca2+ channels and finally synaptic neurotransmitter release. In GI neurons, reduced ATP/ADP ratio induces the closure of chloride channels and reduction in the activity of the Na+/K+ pumps, activation of voltage-gated Ca2+ channels and neurotransmitter release [25].
Among the metabolic related neurons within the arcuate nucleus, POMC neurons are glucose excited [26], while NPY/AgRP neurons are glucose inhibited [27]. Both cell types send projections to the parvocellular neurons of the PVN, and other “second order” neurons in the hypothalamus which are in the position to generate hormonal and neuronal responses to control neuroendocrine and autonomic outflow, including regulation of catecholamine discharge from the adrenal medulla.
The means with which cognitive and emotional influences evoked by psychological and social stressors regulate the hypothalamic stress-related output system are less clearly identified. The PVN is not known to receive any direct neocortical input. Aspects of the limbic system, however, have long been acknowledged as to exert a pronounced, mostly inhibitory effects on the stress-related hypothalamic neurocircuit. By contrast, amygdala, together with specific parts of the bed nucleus of stria terminalis (BNST) send direct inputs to the parvocellular subdivision of the PVN and are involved in processing and evaluation of the emotional significance of salient environmental cues.
According to the recent consensus, psychogenic stressors are processed through the cortical and limbic structures and inputs from multiple limbic parts converge on regions sending direct projections to the PVN, such as the BNST or the periparaventricular GABA/glutamate-ergic interneuron population [13]. This connectivity suggests a mechanism through which information from stress-excitatory and stress-inhibitory signals are integrated to optimize the net output response [28].
Different stressors may elicit specific responses, activate different pathways [7] and it should be noted that different types of psychological challenges may recruit different stress-regulatory pathways to different degrees (Fig.1.) [8].
Furthermore, the stress-response, from a broader view, is not limited to the activation of the HPA axis. Restoration of the homeostasis or adaptation to novel external and
12
internal environment requires autonomic-, metabolic- behavioral- and immune adjustments. All stressors represent a threat to the homo- and allostasis, respectively, and are regarded as danger signals for the organism, which may recruit the immune system. Recently, it has become clear that exposure to stressors potentiate innate immune processes. Based on this notion, it has been hypothesized that stressor exposure change the activation status of cells of the myeloid lineage such as monocytes, macrophages, neutrophils, and microglia. However, it is not fully known how microglia, the resident macrophage population in the CNS sense and react to systemic stressful challenges. In this work I have been interested in how different stressors alter microglia and if neuron-microglia communication play a role in organizing adequate stress response.
Fig.1. Afferent inputs of the hypothalamic paraventricular nucleus
Viscerosensory and somatosensorsy inputs, humoral factors and cognitive, emotional influences evoked by different stressors activate afferents pathways in the brain and at the hypothalamic level, these informations are integrated to form the appropriate response to the environmental challenges.
Abbreviations: PVN – paraventricular nucleus, ARC – arcuate nucleus, SFO - subfornical organ, MePO – median pre-optic nucleus, OVLT – vascular organ of lamina terminalis, BST – bed nucleus of the stria terminalis, PB – parabrachial nucleus, NTS - nucleus of the solitary tract, C1 – catecholaminergic group of cells in the basolateral medulla, ACTH - adrenocorticotrop hormone
13
2.4. Origin of microglia in the brain
Microglia represent the resident immune elements of the central nervous system (CNS).
Del Rio-Hortega published a “newly identified phagocytic, migratory cells within the CNS” by using modified silver carbonate impregnation labeling [29]. He introduced the term “microglia” for the labeled cell class, and called the individual cell
“microgliocyte”. Glial cells were termed from the Greek word “glia” meaning glue, to suggest the “supportive” role provided by non-neuronal cells to neuronal cells. Glial cells comprise two main populations: the macroglia, which consist of astrocytes and oligodendrocytes, and the microglia.
Microglia originate from erithromyeloid progenitors (EMPs) during primitive hematopoiesis in the yolk sac at embryonic day 7.5. EMPs migrate to the neuroepithelium through blood vessels into the brain around embryonic day 8 [30] [31]
where their further development is regulated by different transcription factors. In the forming CNS, factors such as IL-34 and TGF-β and engagement of CSF-1R promote microglia terminal differentiation into resident macrophages [32]. In physiological conditions, embryonic microglia maintain themselves via proliferation. However, during certain inflammatory conditions that alter blood-brain barrier (BBB) integrity, the recruitment of monocytes or other bone marrow-derived progenitors can supplement the microglial population [33].
2.5. Neuron-microglia communication in the brain
Traditionally, microglia were thought to be “resting” or “quiescent” and becoming
“activated” upon perturbations in CNS homeostasis, by which they undergo rapid morphologic and functional transformation. However, modern microscopic techniques, in vivo imaging revealed that microglia are highly motile in their default state [34, 35] . Wake et al. showed that microglia processes make brief contacts (circa 5 min) with neuronal processes about once per hour, suggesting the role of microglia in monitoring the functional state of neurons [36]. Therefore, Hannish and Kettenmann suggested that the baseline state of microglia is “surveying” rather than “resting” [37].
Microglia-neuron communication goes on between these cells in both directions.
Microglia make physical contacts not only with dying neurons but also with neuronal elements under physiological conditions and release certain paracrine signals. It is
14
important to keep in mind, that information processing in the synapses is not only defined by neurones, but also by astrocytes, which enfold the synapses and by microglia, which dynamically interact with synapses. The motile microglial processes, with the more immobile processes of astrocytes, and the pre- and postsynaptic neuronal elements form a “quad-partite” synapse (Fig.2.). In turn, neurons can modulate microglial activation state by purinergic signaling, classic neurotransmitters, micro- RNA (mir-124) and chemokines (CD200, CX3CL1) [38]. Under physiological conditions microglia are suppressed by “off” signals (CD200, CX3CL1, CD22) that are produced by neurons to keep microglia in the default, surveying state [38]. In contrast,
“on” signals originating either from neurons or other cell types (purines, glutamate, chemokines) or from exogenous factors (pathogen-associated molecular patterns – PAMP, danger-associated molecular patterns - DAMPS) induce microglia activation [39-41].
Fig.2. The four-way synapse and the inhibitory/ stimulatory signals of microglial activation
The four-way synapse containing neuronal elements and processes of astrocytes and microglial cells. The “off” signals that keep microglia in surveying state and “on”
signals that induce microglia activation [38]
15
Activation of microglia imply robust changes in cell shape (retraction of long processes, changing number of branches, in extreme case transformation into an amoeboid shape), rapid migration to the site of damage [38]. Microglia can express a broad pattern of cytokines and change their MHC expression profile [39, 40]. Activated microglia are able to express different spectra of pro- or anti-inflammatory cytokines depending on circumstances. Microglia can exhibit anti-inflammatory phenotype, secreting neurotrophic factors, promoting neuroprotection, neurogenesis and glia development.
However, microglia is a “two-edged sword” [42], because certain pathological conditions (pathogen insult, ischemic stroke or neurodegenerative disease) can drive microglia into an activated proinflammatory phenotype. Microglia, releasing proinflammatory factors (IL-1β, IL-6, TNF-α, ROS, NO) induce exaggerated inflammation [43, 44], moreover, in some cases the fully activated microglia have neurotoxic effect (Parkinson-disease) [45].
2.6. Fractalkine/ Fractalkine receptor
Among the pathways mediating environmental cues through neuron-microglia crosstalk [46] the fractalkine (CX3CL1)-fractalkine receptor (CX3CR1) signaling plays a crucial role [47, 48].
Fractalkine is the only member of CX3C chemokine family, which is synthesized as a transmembrane protein with the CX3C chemokine domain and an extended highly glycosylated, mucin-like stalk [49]. It is found either in membrane bound or secreted forms. The two forms have distinct functions, the membrane bound form is involved in cell-cell adhesion, while the secreted form plays a role in chemotaxis of circulating cells expressing its receptor (CX3CR1) [50]. Fractalkine might have neuroprotective or neurotoxic profile in the CNS [51]. Proteolytic cleavage of fractalkine is promoted by the disintegrin-like metalloproteinase ADAM10 [52] or, under inflammatory conditions, by ADAM17/TACE [53] resulting in shed CX3CL1 entities. CX3CL1 is expressed at the periphery in the intestinal epithelium, endothelium, lung, kidney, pancreas, liver, adipose tissue in physiological conditions, and it is upregulated in inflammatory conditions [54-60]. Fractalkine is expressed in the CNS constitutively and abundantly in cell-type specific manner on neurons [47] but it can be induced by TNFα and IFNγ treatment in astrocytes as well [61].
16
Fractalkine interacts with its unique Gαi-coupled seven-transmembrane receptor [47, 62]. Fractalkine receptor is expressed on cells of the myeloid linage, including monocytes and macrophages and its expression has also been described on NK cells and on certain T cell populations at the periphery [62]. CX3CR1 is restricted to microglial cells in the CNS [63].
2.7. Fractalkine receptor deficient mice
Functional studies on fractalkine signaling have been significantly promoted by the development of transgenic mouse line in which the cx3cr1 gene has been replaced by the marker gene encoding egfp [64]. Heterozygous mice CX3CR1+/gfp do not display behavioral or immune phenotype, however can be used as a reporter of microglia activity. By contrast, homozygous mice, CX3CR1gfp/gfp have no functional receptor.
CX3CR1-/- mice show increased repetitive behavior and impaired social recognition due to decreased connectivity between prefrontal cortex and other brain areas. These behavioral differences are thought to be due to transient decrease of microglia recruitment in a critical neurodevelopmental period and associated with defects in synaptic pruning [65]. Although CX3CR1 deficient mice display increased LTP at CA1 and perform better in Morris water maze than wild type animals, they are resistant to the effects of enriched environment [66]. CX3CR1-/- mice display lasting sickness behavior and exaggerated brain cytokine response in response to single LPS injection [67].
Recently, several new features of microglia function emerge. At the beginning of my work only a few report described activated microglia in the limbic system of stressed rodents, without any indication on their modulatory role in the complex hypothalamic stress regulation. With the CX3CR1-/- mice tools became available with which to address the following questions:
17
3. Objectives
I aimed to clarify if acute/chronic exposure of psychogenic or physiological stressful stimuli activate microglia in the hypothalamus, the major integrator of stress response.
My second aim was to investigate if neuron-microglia communication plays a role in organizing adequate stress response.
Therefore, my specific aims were to determine if the fractalkine/ fractalkine receptor signaling pathway:
influences the coping strategy or anxiety- and depressive-related behavior evoked by acute or chronic psychological stress?
contributes to hormonal stress responses and microglial activation in the hypothalamus induced by acute/chronic psychogenic or physiological challenges?
has an effect on metabolic phenotype, and counter-regulatory responses induced by insulin-induced hypoglycemia?
18
4. Methods
4.1. Animals
Experiments were performed in adult (64-100 days old) male C57BL/6 and fractalkine receptor deficient, CX3CR1-/- (CX3CR1 gfp/gfp) mice. Fractalkine receptor deficient mice were obtained from the European Mouse Mutant Archive (EMMA EM00055), on C57BL/6 background [64]. In these mice, the cx3cr1 gene was replaced by a gfp reporter gene. Adult (60-100 days old) male IL-1a/b knockout (KO) mice [68], on C57BL/6 background were also used to test the effect of interleukin-1 (IL-1) on glycemic control. Animals were bred at the Specific Pathogen Free (SPF) level as heterozygote breeder pairs, and were maintained at the Minimal Disease level of the Transgenic Facility of our Institute. The genotype of the animals was determined by TaqMan rtPCR using Thermofisher EGFP assay (ID: Mr00660654_cn) in a multiplex reaction with Mouse TaqMan® Copy Number Reference Assay as an internal standard.
Animals had free access to standard laboratory animal chow and water and were kept under temperature-, humidity-, and light controlled conditions (21°C± 1°C, 65%
humidity, 12-h light/12-h dark cycle, with lights on at 07:00 hours). All procedures were conducted in accordance with the guidelines set by the European Communities Council Directive (86/609 EEC) and approved by the Institutional Animal Care and Use Committee of the Institute of Experimental Medicine.
4.2. Analysis of metabolic parameters
Mice (n=8 per genotype) were singly housed in TSE Phenomaster cages (TSE Systems GmbH Bad Homburg, Germany) and acclimatized for 1 day followed by 72 hours data collection of food consumption, X-Y-Z locomotor activity, oxygen consumption (ml/h/kg) (VO2) and CO2 production (ml/h/kg) (VCO2). Energy expenditure (EE (kcal/h)) was calculated using a rearrangement of the abbreviated Weir equation as supplied by TSE Labmaster System: EE= [3.941 (VO2) + 1.106 (VCO2)] x 1.44. The respiratory exchange ratio (RER) was calculated as VCO2/VO2.
19
4.3. Behavior tests
C57BL/6 and CX3CR1-/- mice (n=36 per genotype) were compared in four behavior tests: open field test, elevated plus maze test, forced swim test and tail suspension test.
All behavioral testing was performed in the early light phase of the day in a separate quiet testing room under approximately 400 lx light intensity, which was similar to that employed in the maintenance rooms. Behavioral tests were video recorded with a Panasonic SDR-H90 digital camcorder and analyzed later with the H77 computer based event recorder software (Jozsef Haller, Institute of Experimental Medicine, Budapest, Hungary).
4.3.1. Open-field test (OF)
The open field was a white, non-transparent plastic box (40 x 40 x 30 (height) cm.).
Mice (C57BL/6, n=8; CX3CR1 -/-, n=8) were placed in the center of the box and allowed to explore the apparatus for 10 min. Locomotion was assessed by counting the crossing of the lines of a 4 x 4 grid that divided the open field into 16 squares (each square was 10 x 10 cm). Lines were drawn on the video screen, and were not visible to the mice. Exploration in the central area was also recorded to provide an additional measure for anxiety-like behavior in the open field. Four inner squares of the grid were considered as central area. The apparatus was cleaned with tap water and paper towel between subjects.
4.3.2. Elevated plus-maze test (EPM)
The elevated plus-maze (arm length=30 cm, arm width=7 cm; wall height=30 cm;
platform height=80 cm) was made of dark-grey painted plexiglas. Open arms were surrounded by 0.3 mm high ledges. Mice (C57BL/6, n=7; CX3CR1 -/-, n=7) were placed into the central area of apparatus with its head facing one of the open arms and were allowed to explore the apparatus for 5 min. Percentage of time spent in open arms was used as measure of anxiety, whereas the ratio of the open arm entries to the total entries were considered indicators of locomotor activity. Mice were considered to enter a compartment when all four legs crossed the lines separating the compartments. The apparatus was cleaned with tap water and paper towel between tests.
20
4.3.3. Forced swim test (FST)
Mice (C57BL/6, n=14; CX3CR1 -/-, n=16) were forced to swim for 6 min in 18 cm high and 14 cm diameter glass cylinders filled with clean tap water heated to 24.5±1 °C.
After swimming, mice were dried with paper towels, and a clean paper towel was left in the home cage for at least an hour to avoid cooling. Water was changed and cylinders were cleaned between subjects. In this test, the time spent either being immobile floating at the surface or swimming and struggling has been measured. Floating was defined as being stationary with only enough motion of the tail or forepaws to keep the head above water. Swimming was defined as active use of the forepaws with forward movement, in the center or along the sides of the cylinder, which did not involve lifting the paws above the surface of the water. During swimming, the body is usually oriented parallel to the sides of the cylinder. Struggling was defined as active pawing of the side of the cylinder, lifting the paws above the surface of the water. Here, animals are facing towards the wall and the body oriented perpendicularly to the side of the cylinder. The animals were not pre-exposed to forced swim before testing.
To measure forced swim stress-induced plasma hormone levels, a second set of mice (C57BL/6, n=6; CX3CR1 -/-, n=6) were forced to swim for 6 min and decapitated, trunk blood was collected into chilled plastic tubes containing 10 µl of 20% K-EDTA and centrifuged.
4.3.4. Tail suspension test (TST)
TST was performed using a computerized device system (ID-TECH-BIOSEB) consisting of three compartments with two suspension units in each compartment. Mice (C57BL/6, n=7; CX3CR1-/-, n=5) were suspended by the tail (with adhesive Scotch tape) in the TST apparatus. The tail suspension test is based on the fact that animals subjected to short term, inescapable challenge of being suspended by their tail, will develop an immobile posture. The test lasted for 6 min. The apparatus recorded three parameters:
duration of immobility, mechanical energy- and power of the movements. The duration of immobility is the main parameter measured. This is calculated from the cumulated time during which the animals movements do not exceed the threshold determined by the level filtering device. The power of the movements is calculated from the total
21
mechanical energy of the movements by the animal during the test, divided by the total time the animal is active (arbitrary units).
4.4. Acute restraint stress
Restraint stress was performed using transparent ventilated Falcon tubes fitted to the size of the animals. Packing with paper towels at the rear was used to achieve comparable degree of restraint. This procedure minimized the space around the animal, prevented them from turning and provided stressful stimulus, without being harmful.
Due to distinct time course of hormonal and activational markers [12], restrained mice were sacrificed at 15 min for ACTH and corticosterone measurement (C57BL/6, n=6;
CX3CR1-/-, n=6) and after 90 min for c-Fos and Iba1 immunocytochemistry (C57BL/6, n=5; CX3CR1-/-, n=5).
4.5. Two-hit stress protocol
Two-hit stress protocol is a combination of early life adversity (maternal separation, MS) followed by chronic variable stress (CVS) paradigm in the adulthood. This protocol has been repeatedly shown to induce anxiety/depression-like symptoms in laboratory rodents [69]. MS protocol was adopted from Veenema et al. [70]. Briefly, pups were separated daily between 09:00 and 12:00 h from their dams for 3 h from postnatal d 1–14. First, dams were removed from the maternity cage and placed into separate individual cages. Pups were then removed as complete litters from the nest, transferred to an adjacent room, and put into a small box placed on a heating pad (30–33
oC). After the 3-h separation period, pups were returned to the home cage followed by reunion with the dam. Unseparated control (Control) litters were left undisturbed, except for change of bedding once a week. Pups were taken from twelve (C57BL/6) or eight (CX3CR1-/-) control litters and ten (C57BL/6) or nine (CX3CR1-/-) MS litters. Pups were weaned at postnatal day 21 and housed in groups of four to five until the start of chronic variable stress procedure (CVS).
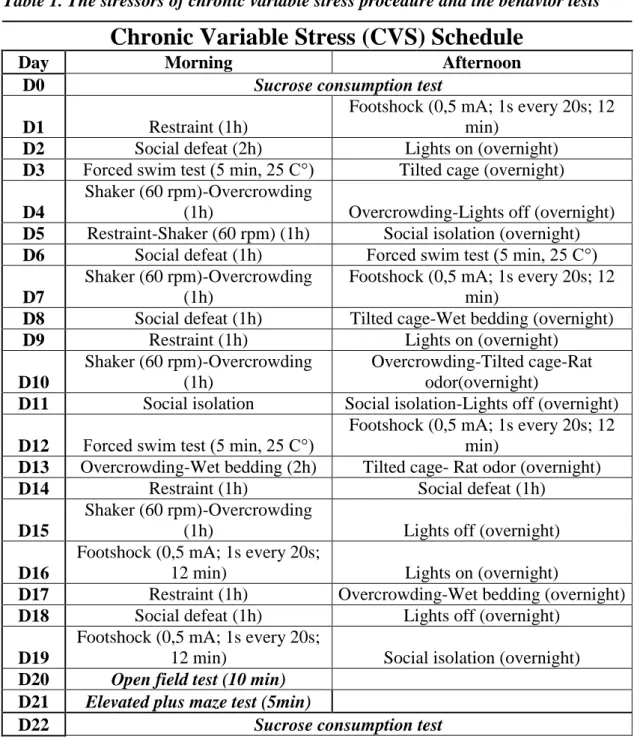
CVS is a commonly used paradigm designed to introduce recurrent physical, psychological and social stress that is unpredictable and unavoidable [71]. In the CVS paradigm used here, mice were exposed to two stressors daily for 3 weeks according to the schedule in Table 1. Each stressor was randomly presented no more than 5 times.
Exposing mice to different stressful stimuli prevented habituation to stress. At the end
22
of the stress procedure, all mice were tested in sucrose consumption and in the open field tests. EthoVision XT video tracking software (version 10.1.856) (Noldus Information Technology, Wageningen, The Netherlands) was used to analyze the open field behavior. In each video, the mouse was detected and the software then autonomously tracked animal movement from the perspective of the center point of the animal's body to quantify the total distance traveled by each mouse.
Body weight was measured before CVS exposure and 3 weeks later, before decapitation. The body weight change was calculated as a difference between these two values.
23
Table 1. The stressors of chronic variable stress procedure and the behavior tests
Chronic Variable Stress (CVS) Schedule
Day Morning Afternoon
D0 Sucrose consumption test
D1 Restraint (1h)
Footshock (0,5 mA; 1s every 20s; 12 min)
D2 Social defeat (2h) Lights on (overnight)
D3 Forced swim test (5 min, 25 C°) Tilted cage (overnight) D4
Shaker (60 rpm)-Overcrowding
(1h) Overcrowding-Lights off (overnight) D5 Restraint-Shaker (60 rpm) (1h) Social isolation (overnight) D6 Social defeat (1h) Forced swim test (5 min, 25 C°) D7
Shaker (60 rpm)-Overcrowding (1h)
Footshock (0,5 mA; 1s every 20s; 12 min)
D8 Social defeat (1h) Tilted cage-Wet bedding (overnight)
D9 Restraint (1h) Lights on (overnight)
D10
Shaker (60 rpm)-Overcrowding (1h)
Overcrowding-Tilted cage-Rat odor(overnight)
D11 Social isolation Social isolation-Lights off (overnight) D12 Forced swim test (5 min, 25 C°)
Footshock (0,5 mA; 1s every 20s; 12 min)
D13 Overcrowding-Wet bedding (2h) Tilted cage- Rat odor (overnight)
D14 Restraint (1h) Social defeat (1h)
D15
Shaker (60 rpm)-Overcrowding
(1h) Lights off (overnight)
D16
Footshock (0,5 mA; 1s every 20s;
12 min) Lights on (overnight)
D17 Restraint (1h) Overcrowding-Wet bedding (overnight)
D18 Social defeat (1h) Lights off (overnight)
D19
Footshock (0,5 mA; 1s every 20s;
12 min) Social isolation (overnight) D20 Open field test (10 min)
D21 Elevated plus maze test (5min)
D22 Sucrose consumption test
4.6. Sucrose consumption test
Sucrose preference test was performed just before CVS exposure and at the end of chronic stress procedure, 20 days later. During this test, mice were given, for 24 h, a free choice between two bottles, one with 1% sucrose solution and another with tap water. To prevent possible effects of side preference in drinking behavior, the position of the bottles was switched after 12 h. No previous food or water deprivation was applied before the test. The consumption of fluids was measured by weighing the
24
bottles, and the sucrose preference was calculated as a percentage of consumed sucrose solution of the total amount of liquid drunk.
4.7. Hypoglycemic stress
Following overnight fast, insulin (1.0 IU/kg, Actrapid) or saline was injected intraperitoneally. At 60 minutes after insulin administration mice were either transcardially perfused for in situ hybridization and c-Fos plus Iba1 double immunocytochemistry or were decapitated for collecting samples for ACTH, CORT measurements and RT-qPCR. Samples were stored at -70 °C until measurements.
4.8. Intracerebroventricular injection
Three experiments were conducted. In the first experiment, mice were divided into two groups (n = 5/5 per group): icv. saline + ip. [saline+insulin] or icv. minocycline + ip.
[minocycline+insulin]. Following overnight fasting, ip. insulin (0.8 IU/kg, Actrapid) was administered on the next day as icv. injection. In the second experiment, after 150 min of food deprivation, mice (n = 3/2 per group) received IL-1RA (n = 8/8 per group) or icv. saline once prior to and two hours later ip. insulin injection (0.8 IU/kg, Actrapid).
C57BL/6 mice were deeply anesthetized with an ip. injection of sodium ketamine hydrochloride (100 mg/ml)/xylazine (20 mg/ml) solution. The top of the skull was shaved to remove fur and mice were then placed in a stereotaxic device. Surgical site was swabbed with betadine solution and then with 70 % alcohol. A single dose of icv.
minocycline (Sigma-Aldrich, 20 µg/total volume of 2 µl), or IL-1RA (Anakinra;
Kineret, 100mg/0,67ml; SOBI) was injected into the right lateral ventricle of the brain using the stereotaxic apparatus. The sham groups received an icv. injection of saline solution (total volume of 2µl). The bregma coordinates used for the injection were -1.0 mm lateral, -0.5 mm posterior, -2.5 mm below.
4.9. High-fat diet
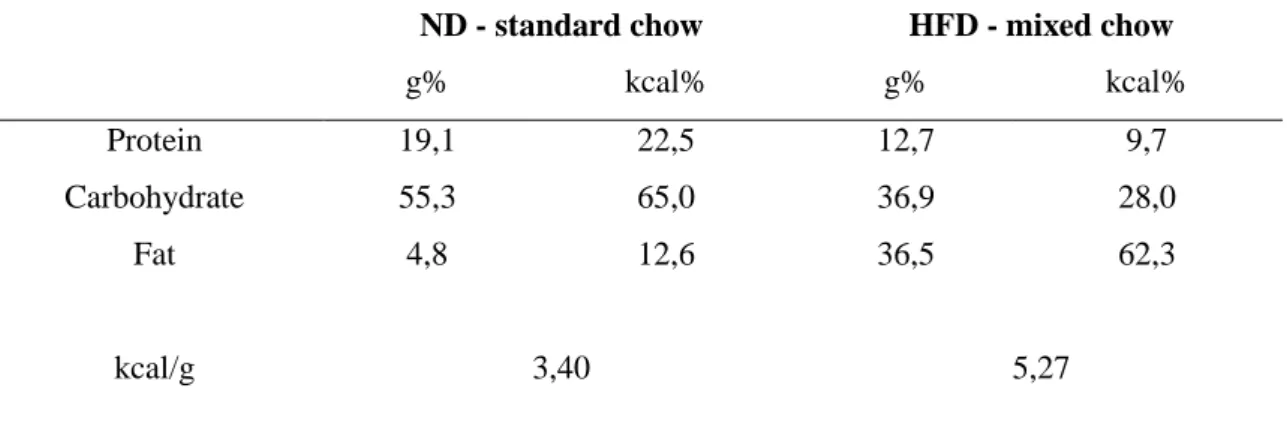
22-25 days old mice were fed with normal diet (ND) or high-fat diet (HFD) for 10 weeks. The first group, normal diet (ND), received standard chow (VRF1 (P), Special Diets Services (SDS), Witham, Essex, UK.). The second group received high-fat diet (HFD), by providing a 2:1 mixture of standard chow and lard (Spar Budget, Budapest, Hungary). The energy content and macronutrient composition of the two diets is given
25
in Table 2. Body weight was regularly measured, and mice were transcardially perfused (n= 4-4). A separate set of obese and lean mice underwent cold tolerance test.
Table 2. Energy content and macronutrient composition of diets
ND - standard chow HFD - mixed chow
g% kcal% g% kcal%
Protein 19,1 22,5 12,7 9,7
Carbohydrate 55,3 65,0 36,9 28,0
Fat 4,8 12,6 36,5 62,3
kcal/g 3,40 5,27
4.10. Cold stress and core body temperature measurement
Rectal temperature was measured with Multithermo thermometer (Seiwa Me Laboratories Inc., Tokyo, Japan). To assess cold tolerance, set of animals (n = 30) from both genotypes were fasted for 5 hours, then placed into new individual cages with minimal bedding and transferred to cold room (4oC). Rectal temperature was measured before and 60, 120, 180 and 240 min after cold exposure.
4.11. Tissue processing
Under terminal anesthesia (Nembutal, Ceva-Phylaxia, Budapest, Hungary), animals were transcardially perfused with saline (0.9% NaCl) followed by 40 mL ice-cold fixative (4% paraformaldehyde in 0.1M borate buffer, pH 9). Brains were removed, post-fixed (in the same fixative for 3 h) and cryoprotected overnight in 10% sucrose (in 0.1M phosphate-buffered saline, PBS) at 4 ◦C. Four series of coronal sections (25 µm) were cut on freezing microtome. Sections were stored at −20 ◦C in antifreeze solution (containing 30% ethylene glycol and 20% glycerol in 0.1M PBS).
26
4.12. c-Fos and Iba1 immunocytochemistry
c-Fos (n=5-6/group) or Iba1 immunoreactivity (n=5-6/group) was revealed by conventional avidin–biotin–immunoperoxydase protocol. Free-floating brain sections were incubated sequentially in (a) 1% hydrogen peroxide (H2O2) in distilled water for 10 min; (b) 2% normal goat serum (Vector Laboratories, Burlingame, CA) in PBS/0.3%
Triton X100 at room temperature for 1 h; (c) rabbit anti-c-Fos IgG (sc-52 Santa Cruz Biotechnology, Santa Cruz, CA, 1:20000) at 4 ◦C for 72 h or rabbit anti-Iba1 (019- 19741, Wako Chemicals GmbH, Neuss, Germany, 1:1000 dilution) primary antibody at 4 ◦C overnight;(d) biotinylated goat anti-rabbit IgG (Vector Labs, 1:200 dilution) at room temperature for 60 min; (e) avidin–biotin–horse radish peroxidase complex (Vector Labs, 1:200 dilution) at room temperature for 60 min. The resulting peroxidase activity was developed in 3,3 -diaminobenzidine (DAB, Sigma). Sections were mounted onto slides, dehydrated in alcohols, cleared with xylene and coverslipped.
4.13. Double immunofluorescence for c-FOS and SMI 32 immunoreactivity
To examine the connection of GFP+ microglial cells with with c-Fos positive neurons, double-labeling immunofluorescence was performed on free-floating brain sections from heterozygote CX3CR1 +/- mice which express GFP and maintain receptor function in CX3CR1 expressing cells. After pre-incubating in 2% normal donkey and horse serum (60 min, at room temperature), sections were incubated in a mixture of rabbit anti-c-Fos IgG (sc-52 Santa Cruz Biotechnology, Santa Cruz, CA, 1:2000) and mouse anti-neurofilament [SMI 32] IgG (BioLegend, 1:500) at 4 ◦C overnight. The antigens were then visualized by biotinylated horse anti-mouse IgG (Vector Labs, 1:500) for 1 hour followed by streptavidin Alexa 405 (Molecular Probes, 1:500) and donkey anti- rabbit IgG conjugated with Alexa Fluor 594 (Invitrogen, 1:500) for 3 hours. After washing, the sections were transferred to slides, and covered with Fluoromount-GTM Solution (Southern Biotechnology Associates).
Fluorescent images were taken by confocal laser scanning using a Nikon C2+
microscope, brightfield images were captured at 20x magnification by Spot RT color digital camera (Diagnostic Instruments Inc., IL, USA) on Nikon Eclipse 6000 microscope. The apposition of GFP positive microglial processes to c-Fos positive
27
neurons were evaluated at the arcuate nucleus by using Z-stack imaging. Three- dimensional image analysis was carried out by using NIS-Elements Viewer 4.2 software.
4.14. Imaging, quantification and data analysis
One complete series of regularly spaced sections (4x25µm=100 µm apart) were stained for each antigens. Digital images of both sides of the PVN as defined by the Paxinos and Franklin's mouse brain atlas (between bregma -0.58 and -0.94) and ARC (between bregma -1.22 and -1.94) in C57BL/6 and CX3CR1 -/- mice were captured 20x magnification by Spot RT color digital camera (Diagnostic Instruments Inc., IL, USA) on Nikon Eclipse 6000 microscope. Images were then re-opened in Image J software and set at a common threshold to subtract the background optical density and the numbers or the area of the immunopositive profiles above the background were counted. The region of interest (PVN) was outlined by a 0,390 mm x 0,290 mm rectangle selection tool with the top of the rectangle positioned in line with the tip of the 3rd ventricle. ARC was outlined by 0,290 mm x 0,290 mm rectangle selection tool with the top of the rectangle positioned in line with the bottom of the 3rd ventricle. The software allowed us to determine the number of immunoreactive cell nuclei (c-Fos) or Iba-1 positive microglia within the region of interest. 3-4 sections per animal were used in the analysis. Quantitation was performed in a blinded fashion.
The number of c-Fos positive cells was automatically counted using the ImageJ 1.48 software after outlining the unit region of interest and thresholding all sections to a common level. ImageJ “Watershed” function, an automatic separation tool was used to separate fused cells by a 1 pixel line. The minimum size of a profile to be considered as a c-Fos-positive cell nucleus was determined as more than 45 pixels. Total cell counts were taken bilaterally at regularly spaced intervals and expressed as mean±SEM for each treatment group.
The area of Iba1+ profiles and the density of Iba1+ microglia (number of cells/mm2) was analyzed using ImageJ 1.48 software. Quantification of Iba1+ cells were performed in the region of interest using unit area rectangle selection over the PVN area. All imaging parameters were the same for each image. The images were converted into a binary black-and-white format using the ImageJ processing tool. “Make binary” with an
28
automated threshold (‘‘default” threshold, a variation of the IsoData algorithm also known as iterative intermeans). An automated count of black pixels (representing all Iba1+ signals) was applied and the Iba1 staining was reported as percentage of unit area.
Distribution of microglia in the hypothalamus was characterized by the spacing index, calculated from the distance between the neighboring microglia [72]. For this calculation, the X-Y coordinates for each microglia were recorded at the unit region of interest using the automark function of the ImageJ program and fed into Matlab R2016a program. The Euclidean distance between each microglia and its nearest neighbor (NND) was calculated in Matlab Program, after that averaged, squared and multiplied by the density of Iba1+ microglia. This value was then averaged for all images to define the value per animal.
4.15. c-Fos and Iba1 double immunohistochemistry
c-Fos and Iba1 immunoreactivity was revealed by conventional avidin–biotin–
immunoperoxydase protocol. Free-floating brain sections were incubated sequentially in (a) 1% hydrogen peroxide (H2O2) in distilled water for 10 min; (b) 2% normal goat serum (Vector Laboratories, Burlingame, CA) in PBS/0.3% Triton X100 at room temperature for 1 h; (c) rabbit anti-c-Fos polyclonal IgG (sc-52 Santa Cruz Biotechnology, Santa Cruz, CA, 1:10000) at 4 ◦C for 40 h; (d) biotinylated goat anti- rabbit IgG (Vector Labs, 1:200 dilution) at room temperature for 60 min; (e) avidin–
biotin–horse radish peroxidase complex (Vector Labs, 1:200 dilution) at room temperature for 60 min. c-Fos immunoreaction was visualized by using nickel- intensified 3,3 -diaminobenzidine reaction (DAB, Sigma).
After extensive washing steps, sections were incubated in anti-Iba1 antibody (rabbit polyclonal, WAKO, 1:1000). Iba1 immunoreaction was developed in diaminobenzidine (DAB, Sigma) only. This combination resulted in black cell nuclear staining corresponding to activated cells and microglia appeared as brownish cytoplasmic staining. Sections were mounted onto slides, dehydrated in alcohols, cleared with xylene and coverslipped.
29
4.16. Combined Immunohistochemical Labeling and In Situ Hybridization (ISH)
Two series of hypothalamic sections of each mice were processed for c-Fos immunohistochemistry and ISH for NPY or POMC mRNA. The procedure is a variant of a protocol described by Simmons et al. [73]. In brief, immunolocalization of c-Fos protein was carried out as described above, except that the tissue was not pretreated with H2O2. In addition, the incubation step in normal serum was omitted, the sections were placed into the primary antiserum supplemented with 3% bovine serum albumin as a blocking agent and with 5 mg/ml heparine to inhibit RNase activity. The DAB reaction was developed without nickel intensification. Immunostained sections were then mounted on slides and in situ hybridization was carried out as described above.
pBLNPY-1 plasmid contains a 511 bp insert comprising most of the cDNA of mouse prepro-neuropeptide Y ligated into the Eco RI site of the Bluescribe M13 (-) vector.
Antisense RNA transcript was prepared by the use of T3 RNA polymerase.
Radiolabeled (35S-UTP) cRNA probe was used for detection the expression of NPY mRNA. c-Fos immunolabeled tissue sections were mounted onto SuperFrost Ultra Plus (Menzer–Glazer) slides thereafter post-fixed with 4% paraformaldehyde in 0.1M borate buffer, pH= 9, digested with Proteinase K (Sigma, 10mg/mL in 50mmol/LTris, pH= 8 and 5mmol/L EDTA at 37 ◦C, 5 min), acetylated (0.25% acetic anhydride in 0.1 mol/L triethanolamine, pH= 8), and dehydrated. Hybridization mixture (50% formamide, 0.3 mol/L NaCl, 10 mmol/L Tris (pH = 8), 2mmol/L EDTA, 1× Denhardt’s, 10% dextran sulfate, 0.5mg/mL yeast tRNA) was pipetted onto the slides (100 mL, containing probe at 107 d.p.m./mL) and hybridized overnight at 56 ◦C. Sections were then rinsed in 4×
SSC (1× SSC: 0.15 mol/L NaCl and 15 mmol/L trisodium citrate buffer SSC, pH= 7), digested with ribonuclease A (Sigma, 20mg/mL in Tris–EDTA buffer with 0.5 mol/L NaCl at 37 ◦C for 30 min), gradually desalted, and washed in 0.1× SSC at 65◦ for 30 min, dehydrated and air dried. Hybridized sections were dipped into Kodak NTB-3 emulsion and exposed for 5 days.
30
4.17. Gene expression analysis by quantitative real-time PCR
Mice (n=3-4) were decapitated, the whole hypothalamic blocks or arcuate nucleus regions were dissected and frozen immediately at -70oC. Total RNA was isolated with QIAGEN RNeasyMiniKit (Qiagen, Valencia, CA, USA) according the manufacturer’s instruction. To eliminate genomic DNA contamination, DNase I (Fermentas) treatment was used. Sample quality control and the quantitative analysis were carried out by NanoDrop (Thermo Scientific). cDNA synthesis was performed with the High Capacity cDNA Reverse Transcription Kit (Applied Biosystems, Foster City, CA, USA). The designed primers (Invitrogen) were used in real-time PCR reaction with Power SYBR Green PCR master mix (Applied Biosystems, Foster City, CA, USA) on ABI StepOnePlus instrument. The gene expression was analyzed by ABI StepOne 2.3 program. The amplicon was tested by Melt Curve Analysis. Measurements were normalized to GAPDH expression. Amplification was not detected in the RT-minus controls. Primers used for the comparative CT (threshold cycle) experiments were designed by the Primer Express 3.0 program. Primer sequences for the following genes are:
GAPDH:
(f) TGACGTGCCGCCTGGAGAAA (r) AGTGTAGCCCAAGATGCCCTTCAG CRH mRNA:
(f) CGCAGCCCTTGAATTTCTTG (r) CCCAGGCGGAGGAAGTATTCTT NPY mRNA:
(f) CAGATACTACTCCGCTCTGCGACACTACAT (r) TTCCTTCATTAAGAGGTCTGAAATCAGTGTCT POMC mRNA
(f) CGAGATTCTGCTACAGTCGCTCAGG (r) GCCAGGAAACACGGGCGTCT
AGRP mRNA
(f) AGGACTCGTGCAGCCTTACAC
31 (r) AGCTTTGGCGGCGGTGCTA
Iba1 mRNA
(f) AGCTGCCTGTCTTAACCTGCATC (r) TTCTGGGACCGTTCTCACACTTC IL-1a mRNA
(f) CCATAACCCATGATCTGGAAGAG (r) GCTTCAGTTTGTATCTCAAATCAC IL-1b mRNA
(f) CTC GTG GTG TCG GAC CCA TAT GA (r) TGA GGC CCA AGG CCA CAG GT
4.18. ACTH and corticosterone measurement
After decapitation, trunk blood was collected into chilled plastic tubes containing 10 µl of 20% K-EDTA, centrifuged and plasma samples were stored at −20 ◦C until hormone measurements. ACTH and corticosterone were determined using a direct radioimmunassay (RIA) as described [74, 75].
4.19. Catecholamine determination
Catecholamines (epinephrine, norepinephrine) were analyzed in individual plasma samples or pooled plasma samples. To obtain a pooled plasma sample, equal volumes of each individual sample (n=3/4 per group) from the same experimental group were mixed. Samples were used for the catecholamine measurements using 2-CAT ELISA kits (Labor Diagnostica Nord, Nordhorn, Germany).
4.20. Cell culture
Mouse microglial BV2 cell line was obtained from the Cell Culture Core Facility at the Institute of Experimental Medicine and cultured in humidified atmosphere of 5%CO2 in DMEM/F12 (1:1) media with 10% FCS containing Glutamax and penicillin/streptomycin. Cells were trypsinized and plated in multi-well plates before appropriate treatments. Cells were treated with 2-DG (Sigma) 1 and 10 mM for 3h or
32
insulin 1nM overnight and harvested. IL-1 mRNA expression was measured by qPCR as described above.
4.21. Statistical analysis
Statistical analysis was performed using GraphPad Prism software (ver. 6.01; San Diego, CA, USA) using two-way ANOVA with Bonferroni post hoc test. To determine the significant differences between the two group means, unpaired, two sided t-test was performed. If the populations had significantly different standard deviation, data were analyzed by unpaired t test with Welch’s correction. P-value < 0.05 was considered statistically significant. On the figures, * marks genotype difference, # marks treatment effects. Data are expressed as group means ± standard error of the mean (SEM).
33
5. Results
5.1. Effects of acute psychological stress on fractalkine receptor deficient mice (CX
3CR1
-/-)
5.1.1. Home cage locomotor activity and behavior tests with acute stress component
5.1.1.1. Home cage activity
There was a significant circadian difference between day/night locomotor activity and speed of the movements in the home cage, but we did not detect any significant difference between wild-type (C57BL/6) and fractalkine receptor deficient mice (CX3CR1-/-) neither in the light, nor in the dark phase of the day (p<0.05) (Fig. 3A).
There was also no significant genotype effect on the average speed of the movements (Fig. 3B).
5.1.1.2. Open field test
As shown on Fig. 3C there was no difference in the locomotor activity between genotypes in the open field [t(26)=0.6502, p>0.05], and we did not detect any significant difference between C57BL/6 and CX3CR1 -/- mice in the time spent in the center [t(26)=0.8942, p>0.05] (Fig. 1D).
5.1.1.3. Elevated plus maze test
As shown in Fig. 3F, preference for open arms of homozygous fractalkine receptor deficient (CX3CR1-/-) mice showed a trend towards less anxious phenotype, but the open arms’ time was not statistically different from wild-type mice (C57BL/6) [Welch- corrected t(16.57)=1.546, p>0.05]. CX3CR1-/- mice did not spend more time in the open arms than wild-type mice [Welch-corrected t(15.07)=1.750, p=0.1005] (Fig. 3E).
5.1.1.4. Forced swim test
CX3CR1-/- mice displayed active coping behavior during forced swimming. These mice exhibited significantly decreased immobility in the forced swim test when compared with wild-type animals [t(28)=2.179, p=0.0379] (Fig. 3G); spent significantly more time
34
struggling (Fig. 3H) [t(28)=2.269, p=0.0312], while there was no difference in the duration of swimming [t(28)=0.344, p=0.733] (Fig. 3I).
5.1.1.5. Tail suspension test
The fractalkine receptor deficient mice were more active to escape in the tail suspension test. In this test, CX3CR1-/- mice spent less time in immobility than wild-type mice [t(16)=2.506, p=0.0234] (Fig. 3J). However, the difference between the genotypes in the latency of immobility was not significant [t(16)=0.6659, p>0.05] (Fig. 3K). The power of their movements was not different between the examined genotypes (Fig. 3L).
Fig.3. CX3CR1 -/- mice display active coping behavior in FST and in TST, but fractalkine receptor deficiency did not influence the locomotor activity of mice in their home cage and in open field test
(A) Home cage locomotor activity and (B) the speed of the movements as recorded in TSE Phenomaster cages. Data were analyzed by two-way ANOVA (n = 8 per genotype). The main effect of day cycle: #p<0.05; ###p<0.001. Open field test: (C) The number of line crossings and (D) percentage of time spent in the central area (n = 8 per genotype). Elevated plus maze
35
test: (E) The percentage of open arm time and (F) open arm preference (the ratio of open arm entries to the total entries) (n=7 per genotype). Forced swim test (FST): CX3CR1-/- mice display active coping behavior in the forced swim test. The percentage of time spent with (G) floating, (H) struggling and (I) swimming (n=14/16 per genotype), *p<0.05 CX3CR1-/- vs.
C57BL/6 (Student’s t-test). Tail suspension test (TST): (J) CX3CR1 -/- mice spent significantly less time immobile than C57BL/6 mice. (K) There was no significant difference between C57BL/6 and CX3CR1-/- mice in either latency of immobility or (L) power of the movements (n=7/5 per genotype) *p<0.05 CX3CR1-/- vs. C57BL/6 (Student’s t-test). Bar graphs illustrate means ± SEM values [76].
5.1.2. Acute psychological stress induced c-Fos expression in the PVN and the hypothalamo-pituitary-adrenocortical axis activity
Under basal, stress-free conditions, weak c-Fos labeling of a few scattered cells were detected in the PVN of both genotypes. Restraint stress-induced neuronal activation dramatically increased c-Fos counts 90 min after restraint stress [main effect of stress exposure: F(1,11)=605.5, p<0.0001] (Fig. 4A). The number of c-Fos positive cell nuclei within the PVN was significantly higher in CX3CR1-/- mice after acute restraint, than in wild-type C57BL/6 mice. [Bonferroni’s multiple comparisons test, t(11)=3.193, p<0.05]
(Fig.4B).
Fig.4. Acute restraint stress-induced neuronal activation in the paraventricular nucleus of the hypothalamus (PVN)