58
COGNITIVE LEVEL OF CONSUMERS’
KNOWLEDGE IN THE CASE OF A FEW FOOD PRODUCTS
Robert Sandor, Szucs Dr., PhD
College of Szolnok, Hungary
Abstract
Nowadays, the number of stimuli reaching the consumers is under drastic growth. At the same time, consumers are not able to or willing to process this amount of information. In spite of the educational level, informative campaigns and publications, the consumers’ level of knowledge remains low concerning the composition of food products. On the basis of a
research carried out in 2013, in Hungary and involving 1,150 individuals, we can state that consumers are not aware of the extent of carbohydrates and energy contained in their food products. It is the responsibility of consumer protection to work out a signalling for food products that is easy to be processed and can be immediately understood by the consumers. Such an initiative could be the comprehensive and mandatory introduction of the
“traffic light system”.
Keywords: Consumer protection, marketing, sugar content, foods with high level of fat, sugar and/or salt
This research was realized in the frames of TÁMOP 4.2.4. A/1-11-1-2012- 0001 „National Excellence Program – Elaborating and operating an inland student and researcher personal support system”. The project was subsidized by the European Union and co-financed by the European Social Fund
Introduction
Nowadays, in the field of marketing, the belief that most costumers are becoming more and more self-conscious and longing for independence, and that they do not wish to follow patterns, is generally accepted. To this
adds the growing tendency in the customers’ educational level (Törőcsik, 2003). However, in many cases, we should treat this statement with
reservations; especially, at the area of food products. Even though consumers’ educational level is growing, often, this does not always coincide
with the growing level of health-consciousness. A good example of this is the research of Szűcs (2011) carried out with 1,297 individuals, according to the results of which, one-third of the young people questioned (38.9%) are
not interested in the problematics of healthy nutrition. Merely half of young people read through the list of components to be found at the back side of the products. What makes it even more serious is that out of those who do read through the list of components, merely half of them are aware (according to
their own statement) of the ingredients’ effects. This value is not higher in its accumulated form either: out of the entire multitude, merely 42.4% claim that they know the ingredients’ effect. We can state that it is the responsibility of consumer protection that nearly 60% of young people do not understand the signals on the food product labels.
Responsibility
A few years ago, the product called Vitamin Water, distributed by Coca-Cola Company raised a huge outcry. Even though the product was being promoted as “healthy”, it contained 32.5 grams of sugar in almost 600 ml. The situation is just a little better in the case of Life Water distributed by
Pepsi (23 to 25 grams sugar/600 ml). Th e consumers’ level of knowledge is also well illustrated by the description of the interview below: „The European president of Coca-Cola (James Quincey) has admitted that some customers 'don't realise' how much sugar is in the company's drinks.
Quincey also conceded that 'things need to change' and servings had to reduce in size. When asked by Jeremy Paxman what good Coca-Cola did its consumers, Quincey said: 'It does have some sugar in it... it has energy, but is it a necessity? No it's not. But millions of people enjoy it as part of their diet across the UK.' Quincey also pointed put that a regular can of the drink - which contains 35g or six teaspoons of sugar - was similar in calories to 'a cappuccino or a half a croissant'. He stressed that the company was working hard to promote the calorie and sugar content of its products so that consumers could make informed choices. But when asked by Paxman if he thought people had any idea how much sugar is in small and large servings of Coke at the cinema, he was forced to reply: 'I think maybe they don't'”
(Hodgekiss, 2013).
Of course, responsibility cannot be completely redirected from the consumers to any single company. To simplify the case, the company does not do anything else but satisfy consumers’ needs. Basically, it is the consumer who makes the decision, buys the product, puts it in the basket and consumes it. The responsibility cannot be redirected merely at the companies, even if they are capable of shaping consumers’ necessities with the help of their marketing activities. It is the company’s responsibility to provide information to the consumer in accordance with the legal
60 requirements; besides, the completion of the mission of behaviour shaping and education can be expected, as well.
Coca-Cola also began airing anti-obesity TV ads this year to 'remind' viewers that all calories count in managing weight, including those in Coca- Cola's products. Diet drinks already make up nearly half of Coca-Cola's UK sales, with Diet Coke and Coke Zero accounting for 45 per cent of sales. At the Sprite announcement the company said that since 2007, it had reduced the calorie content of Fanta Orange by 30 per cent, Oasis by 35 per cent and Lilt by 56 per cent (Hodgekiss, 2013).
We are to accept the fact that nothing more (self-regulation) should be expected from profit-oriented companies. The two main questions are whether, on the one hand, to what extent should the state protect the consumer, and where, how and to what extent it should interfere with market processes, and; on the other hand, what amount and quality of information is
in the consumer’s possession concerning the product’s composition, and where protection should be enhanced. At the same time, we are to accept that, certain groups cannot be protected for the reason that the consumer simply refuses our initiative.
Still, it is a fact that, nowadays, the number of stimuli reaching consumers is drastically growing. The label indicating the product’s composition teeming with data that are not perceived by the consumers as information but merely data. On the label, we relieve an amount of data for the consumer, that they do not wish or are not able to process but, at the same time, we know the solution and apply it in many cases. On healthy food products, we communicate the healthy characteristic of the product to the consumer in a simplified way; on the other hand, we do not apply this same simplified way on the labels of food products with high fat, salt and sugar contents. Instead, we try to hide or, in any case, not emphasize the fact that the particular food product contains too much sugar, fat, salt etc.
As a consequence of the above reasoning, it is necessary to
investigate the consumers’ level of knowledge concerning the food products’
composition. It is impossible to achieve exhaustive results; therefore, in the course of my research work, I assessed to what extent were consumers aware of the sugar content of a few popular food products.
Aim and methodology
During my research work, I asked my consumers to guess the sugar content of a few, popular food products. For the sake of simplicity, sugar contents were not to be expressed in grams, instead the consumers had to guess the equivalent of approximately how many sugar cubes did the given
food product contain in sugars (1 sugar cube ≈ 3.4 grams). This way, the question has become much more tangible and easier to imagine for the
consumers. The variation from the correct value can be measured in %-s (guess/real value), and can be evaluated as corresponding to school grades:
x 0 to 49% - insufficient (very bad guess, very underestimated sugar contents)
x 50 to 64% - sufficient (bad guess, underestimated sugar contents) x 65 to 74% - medium (medium guess, medium guesses of sugar
contents)
x 75 to 85% - good (good guess, well guessed but a little underestimated sugar contents)
x 86 to 114% - excellent (brilliant guess, almost exactly guessed sugar contents; 100 % = perfect answer)
x 115 to 125% - good (good guess, well guessed but a little overestimated sugar contents)
x 126 to 135% - medium (medium guess, medium-well guessed sugar contents)
x 136 to 150% - sufficient (bad guess, overestimated sugar contents)
x 151% to - insufficient (very bad guess, very overestimated sugar contents)
The questionnaire’s questions formulated in the form of open questions were as follows:
x What do you think how many sugar cubes correspond to the sugar amount to be found in a 0.33-litres can of Coca-Cola?
x What do you think how many sugar cubes correspond to the sugar amount to be found in a bar of Snickers chocolate?
x What do you think how many sugar cubes correspond to the sugar amount to be found in a chocolate flavoured Cerbona cereal bar?
x What do you think how many sugar cubes correspond to the sugar amount to be found in a 300-gram (1 small sized plastic bottle), sour-cherry flavoured Milli yoghurt drink?
x What do you think how many sugar cubes correspond to the sugar amount to be found in a 0.5-litre bottle of Fanta fizzy drink?
x What do you think how many sugar cubes correspond to the sugar amount to be found in a 0.5-litre bottle of Nestea iced tea?
x What do you think how many sugar cubes correspond to the sugar amount to be found in a smaller plate of carrots?
In this survey 1150 questionnaires were filled in Hungary. Taking part in the research for respondents were voluntary and anonym without any previous selection. Inquiry of the online survey happened between 28th
62 September 2013 and 10th November 2013. Anyone could participate in the survey who filled in the questionnaire (above age of 14). Distribution of the sample by gender: 53.5% women, 46.5% men. Average age in the sample (xr V) 37.9 ± 14.99 year, range (R) 14-75 year, modus 45 - 49 year. During data procession I used statistical methods (mean, median, deviation, Cramer V statistics, Kendall’s rank correlation, crosstabs etc.). I continued my
descriptive researches with simple statistical methods, I used Cramer’s V statistics for examining correlation among criteria. Kendall’s rank correlation (Kendall’ W) can be used for assessing agreement among respondents.
Kendall’s W ranges from 0 (no agreement) to 1 (complete agreement).
This research was realized in the frames of TÁMOP 4.2.4. A/1-11-1- 2012-0001 „National Excellence Program – Elaborating and operating an inland student and researcher personal support system”. The project was subsidized by the European Union and co-financed by the European Social Fund.
Results
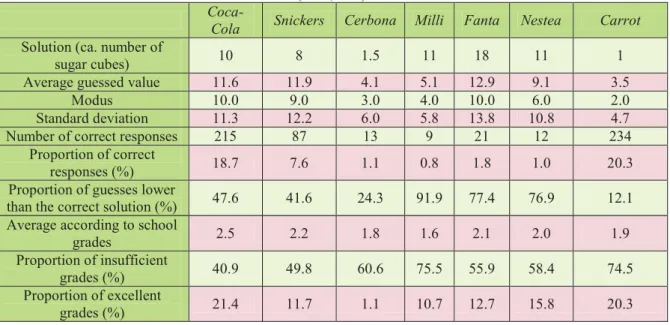
The summary evaluation prepared on the basis of the responses of 1,150 responders can be found in table 1 below.
Table 1.: Detailed statistics of answers in case of different products (n=1,150)
Coca-
Cola Snickers Cerbona Milli Fanta Nestea Carrot Solution (ca. number of
sugar cubes) 10 8 1.5 11 18 11 1
Average guessed value 11.6 11.9 4.1 5.1 12.9 9.1 3.5
Modus 10.0 9.0 3.0 4.0 10.0 6.0 2.0
Standard deviation 11.3 12.2 6.0 5.8 13.8 10.8 4.7
Number of correct responses 215 87 13 9 21 12 234
Proportion of correct
responses (%) 18.7 7.6 1.1 0.8 1.8 1.0 20.3
Proportion of guesses lower
than the correct solution (%) 47.6 41.6 24.3 91.9 77.4 76.9 12.1 Average according to school
grades 2.5 2.2 1.8 1.6 2.1 2.0 1.9
Proportion of insufficient
grades (%) 40.9 49.8 60.6 75.5 55.9 58.4 74.5
Proportion of excellent
grades (%) 21.4 11.7 1.1 10.7 12.7 15.8 20.3
Source: Own research, 2014
According to the above table, it can be well seen that the consumers’
guesses show a significant deviation from the value. If we would like to sum
up the above table briefly, in a few sentences then we could state that the consumers’ ignorance is astonishing concerning the carbohydrate contents of the food products.
In the reflection of the above data, we could make the following main statements as below:
x The sugar content of Coca-Cola often mentioned by the media has been guessed by the consumers with a higher precision compared to the other products. The proportion of correct responses can be regarded as relatively high: 18.7%. Here, the proportion of guesses (40.9%) corresponding to insufficient grades has become the lowest and the proportion of excellent grades (21.4%) the highest.
x In the case of the Fanta product with similar sugar content but having received much less media attention, the consumers have by no means achieved such good results. The consumers underestimated the product’s sugar content, 77.4% of the responders indicated a value lower than the actual sugar content.
In the case of Coca-Cola, the media communicates well the
product’s sugar content; whereas in the case of Fanta, the lack of communication results in a lower level of consumer knowledge.
x In the case of the cereal bar (Cerbona), consumers typically
overestimated the product’s sugar content. In the case of the product characterized as healthy, we could state that the lack of
marketing communication spendings have resulted in the unawareness of the consumers. Here, the proportion of brilliant guesses corresponding to excellent grades is the lowest (1.1%).
x The sugar content of carrot as a natural vegetable has been drastically overestimated (87.9%) by the consumers. Since food products stemming from natural resources receive little attention from the point of view of marketing; this way, supposedly, only those consumers have provided correct solutions that can be considered as belonging to the segment of health-conscious consumers.
x Matthews et al. (2004) wrote that a sugar-added, high fat containing yoghurts can be found among the food products containing high amounts of fat, sugar or salt, consumed most frequently by children. Despite this, the study has mainly spread among experts, and not so much among consumers. The consequences can be well seen: 91.9% of the consumers underestimated the sugar content of yoghurts.
64 x A rather narrow segment can be observed in the case of every
product, which segment has typically formulated correct responses. The proportion of these consumers is between 10 to 20%. They could be called conscious consumers, who know their consumers’ rights, the products’ composition and the health effects of each ingredient. They have a high level of knowledge, and it is not merely their own supposition but real and factual.
The size of this segment fits well with the results of previous researches.
Before formulating the guesses, using a 5-degree scale, the consumers could state to what extent they considered themselves as conscious consumers (1 - entire lack of consciousness, 5 – conscious consumers). The average level of subjective consciousness among the consumers resulted in the value 3.4. after formulating their guesses I have asked the consumers to evaluate the expected correctness of their own guesses similarly to school grades (insufficient, sufficient, medium, good, brilliant). The average value has already become much lower: 2.8. It can be well seen that the consumers felt correctly the low level of their real knowledge. Even so, the consumers overestimated their own level of knowledge. The global average calculated according to all the responses given to all the above questions by all the responders has been only 2.0. It can be well seen that consumers estimated the level of their guesses approximately as medium, whereas, in reality, they could barely be called weak.
Among the questions of the questionnaire, there were further two open ones, similarly to the above. These questions were the above:
x What do you think, by consuming 1 line (4 cubes) of a bar of Milka chocolate, approximately how many calories do you take into your body?
x What do you think, by consuming 1 glass of 125 grams of Danone Activia yoghurt, how many per cents of an adult’s dai ly average energy need are we taking into the body?
The guesses provided to the questions are also weak, similarly to the above values. The average values are 2.17 and 1.77, in order. According to the above questions, the extraordinarily low level of consumer knowledge can also be well seen.
Conclusion
Naturally, it cannot be expected from the consumers that they exactly know the composition of each and every product. However, we could easily
provide them help, and the way of doing so would be obvious. With the help of its initiative, the European Heart Network could stop the high level of the ignorance described above, as well as contribute to the fact that consumers, mainly young people receive information in a more simplified form about the composition of food products containing high values of high fat, salt and sugar already on the front side of the product (energy, saturated fat, sugar, salt). In my opinion there is no easier, better and more comprehensible suggestion than the traffic light signalling suggested by them (red, yellow, green) (E.g. red colour = too much sugar, Yellow colour = medium level sugar content, green colour = low sugar content). From 2012, the system has already been working in the United Kingdom on a voluntary basis.
In 2012, the United Kingdom held stakeholder consultations on the traffic light scheme. The British government is expected to launch the voluntary front-of-pack label combining traffic lights with reference intakes in June 2013. In the meantime, several large retailers in the United Kingdom announced that they would introduce traffic light labelling to respond to consumer demand. European Heart Network welcomed the move by several retailers in the UK to use traffic lights, and in a meeting of the EU Platform for action on diet, physical activity and health it called on those retailers to convey the same benefit to all their consumers across Europe (European Heart Network, 2013).
I believe the initiative is easy to follow and will bring the desired results. It is suggestible the usage of traffic light system in case of foodstuff.
References:
European Heart Network (2013): Annual Report 2012, http://www.ehnheart.org/component/downloads/downloads/1620.html, p.10 HODGEKISS A. (2013): 'Some people don't realise how much sugar there is in Coca-Cola,' admits the company's PRESIDENT - as it emerges a large cinema serving contains 44 teaspoons of sugar, http://www.dailymail.co.uk/health/article-2515555/people-dont-realise- sugar-Coca-Cola-admits-companys-PRESIDENT.html, 29 November 2013 Matthews A., Cowburn G., Rayner M., Longfield J., POWELL C. (2004): A gyermekeket célzó egészségtelen élelmiszerek marketingje Európában, Eurpoean Heart Network, p. 21
Szucs R. S. (2011): Marketing and Consumer Protection Analysis of some Food Products Consumed by Young People , University of Debrecen,, Károly Ihrig Doctoral School of Management and Business Administration, http://hdl.handle.net/2437/103324, PhD. Dissertation, p. 1 – 197.
Törőcsik M. (2003): Fogyasztói magatartás trendek, KJK-Kerszöv Kiadó, Budapest, p.163.