Phytopathologia Mediterranea 59(1): 97-106, 2020
www.fupress.com/pm The international journal of the
Mediterranean Phytopathological Union
ISSN 0031-9465 (print) | ISSN 1593-2095 (online) | DOI: 10.14601/Phyto-11098 Citation: A. Pintye, M.Z. Németh, O.
Molnár, Á.N. Horváth, Z. Spitzmüller, N. Szalóki, K. Pál, K.Z. Váczy, G.M.
Kovács (2020) Improved DNA extrac- tion and quantitative real-time PCR for genotyping Erysiphe necator and detecting the DMI fungicide resistance marker A495T, using single ascocarps.
Phytopathologia Mediterranea 59(1):
97-106. doi: 10.14601/Phyto-11098 Accepted: February 6, 2020 Published: April 30, 2020
Copyright: © 2020 A. Pintye, M.Z.
Németh, O. Molnár, Á.N. Horváth, Z.
Spitzmüller, N. Szalóki, K. Pál, K.Z.
Váczy, G.M. Kovács. This is an open access, peer-reviewed article published by Firenze University Press (http://
www.fupress.com/pm) and distributed under the terms of the Creative Com- mons Attribution License, which per- mits unrestricted use, distribution, and reproduction in any medium, provided the original author and source are credited.
Data Availability Statement: All rel- evant data are within the paper and its Supporting Information files.
Competing Interests: The Author(s) declare(s) no conflict of interest.
Editor: Philippe Nicot, Plant Pathology Research Unit INRA, Avignon, France.
Research Paper
Improved DNA extraction and quantitative real-time PCR for genotyping Erysiphe necator and detecting the DMI fungicide resistance marker A495T, using single ascocarps
Alexandra PINTYE1,*, Márk Z. NÉMETH1, Orsolya MOLNÁR1, Áron N.
HORVÁTH1, Zsolt SPITZMÜLLER2, Nikoletta SZALÓKI2, Károly PÁL2, Kálmán Z. VÁCZY2, Gábor M. KOVÁCS1,3
1 Centre for Agricultural Research, Martonvásár, Hungary
2 Food and Wine Research Institute, Eszterházy Károly University, Eger, Hungary
3 Eötvös Loránd University, Institute of Biology, Department of Plant Anatomy, Budapest, Hungary
*Corresponding author: pintye.alexandra@agrar.mta.hu
Summary. DNA extraction from minute fungal samples is challenging in all genetic studies. Identification of genetic groups and population biology mostly rely on the laborious production of single conidium isolates or on field samples, including infect- ed plant materials. This paper reports a simple and cost-effective protocol for DNA extraction from individual chasmothecia of Erysiphe necator for subsequent applica- tions. It is a less laborious alternative for genotyping purposes than production and analysis of single conidium isolates or analysis of infected plant material from the field.
Using the protocols described here for 186 E. necator samples tested, genetic groups A and B were assigned. Based on CYP51 sequences, all the samples belonged to group B, while TUB2 sequences exhibited SNPs also diagnostic for group A. Additionally, a quantitative real-time PCR detection method of single nucleotide polymorphism in the CYP51 gene associated with DMI fungicide resistance was applied. The A495T marker, associated with DMI resistance, and here reported for the first time from Hungary, was detected by quantitative real-time PCR assays and direct sequencing of CYP51. The methods developed in this study can be applied as routine tests to monitor powdery mildew populations for fungicide resistance and other genetic characteristics.
Keywords. Y136F, azole fungicide sensitivity, CYP51 gene, chasmothecium.
INTRODUCTION
Powdery mildews (PMs) are frequent diseases of many angiosperm hosts, and are caused by obligate biotrophic fungi in the Erysiphales (Glawe, 2008).
These fungi are potential models in a wide range of studies, such as those that describe how coinfections are formed (Susi and Laine, 2017) or that explain disease dynamics (Jousimo et al., 2014; Marçais et al., 2017), pathogen host
range expansions (Vági et al., 2007; Beenken, 2017), host-pathogen co-evolution (Takamatsu et al., 2013) or genome evolution (Frantzeskakis et al., 2019). With very small uncultivable fungi, it is important to use the smallest discrete unit for DNA extraction, which can be identified based on morphology and is large enough to obtain sufficient genomic DNA for molecular genetic analyses. In this way, data can be obtained at the level of individuals, and the possibilities of contamination with other fungi (Sundberg et al., 2018), or cross-contamina- tion with another colony possibly belonging to a different genetic line of the same species, may be reduced.
Grapevine powdery mildew (GPM), caused by Ery- siphe necator, is one of the most economically significant diseases of grape production (Gadoury et al., 2012). In GPM, molecular characterizations are usually based on mycelium collected directly from the field (e.g. Frenkel et al., 2012) or from single conidium isolates, i.e., GPM colonies each produced by a single conidium on the sur- face of a surface-sterilized leaf in laboratory conditions (e.g. Brewer and Milgroom, 2010).
Direct PCR methods without DNA purification have been successfully used to identify genetic groups in E.
necator (Miazzi et al., 2008), or to detect the pathogen in grapevine buds (Gindro et al., 2014). Miazzi et al. (2008) obtained the best results with 4-10 conidia picked up from individual leaves using sterile eyelashes, and add- ed directly to PCR mixtures. Gindro et al. (2014) used 10- and 100-fold diluted powdery mildew-infected plant samples crushed in polyvinylpolypyrrolidone, and added directly to PCR mixtures before amplification (Gindro et al., 2014). Furthermore, PCRs and quantitative real-time PCRs (qPCRs) with DNA samples originating from indi- vidual conidia were also successful for two other pow- dery mildew species (Matsuda et al., 2005).
Conidia are very small discrete units, and to obtain enough DNA for downstream applications, single conid- ium isolates should be produced, which is laborious and time consuming. It takes at least 1 month to obtain a clear- ly monoconidial GPM colony (Rallos and Baudoin, 2016).
Ascocarps (chasmothecia) can be considered the smallest discrete unit of a powdery mildew fungus in nature that can still be easily handled, yet are large enough to contain sufficient DNA for multilocus analyses and qPCR.
Chasmothecia of E. necator are usually produced in large numbers at the end of the grapevine growing season (Gadoury and Pearson, 1988; Cortesi et al., 1997). Young chasmothecia are hyaline spherical bodies that turn yel- low, then brown during maturation. They finally become black with characteristic appendages, and are filled with asci containing ascospores (Gadoury and Pearson, 1988).
Chasmothecia have been used for DNA extraction in
molecular studies of other PMs (Hirata and Takamatsu, 1996), but not commonly for studies of GPM. Mougou et al. (2008) found that ten chasmothecia, collected directly from the surfaces of the host plant leaves, is the minimum number required for amplification of the nrDNA ITS region. However, to our knowledge, individual chasmoth- ecia have not been extensively used for such purposes.
Two distinct genetic groups, A and B, have been described in E. necator using single conidium isolates (e.g. Brewer and Milgroom, 2010) or field samples (e.g.
Frenkel et al., 2012). The differentiation between these genetic groups is based on different molecular markers, such as sequences of the β-tubulin (TUB2) (Amrani and Corio-Costet, 2006) and the eburicol 14α-demethylase (CYP51) genes (Délye et al., 1999), as well as sequences of the nrDNA internal transcribed spacer (ITS) region (Délye et al., 1999) and intergenic spacer (IGS) region (Brewer and Milgroom, 2010).
Detection of fungicide resistance, in addition to po- pulation genetic studies, is an important task for char- acterisation of GPM. Demethylation inhibitor (DMI) fungicides inhibit CYP51, a key enzyme of the fungal sterol biosynthetic pathway. This enzyme catalyzes the biosynthesis of ergosterol, which is an important mem- brane component of fungi (Parker et al., 2014). Because of their site-specific modes of action, the intensive use of DMIs may lead to the spread of the fungicide resist- ance in GPM populations (Frenkel et al., 2015). A mark- er for DMI resistance is an A to T nucleotide substitu- tion in position 495 (A495T) in the CYP51 gene (Délye et al., 1999). This results in amino acid substitution at position 136 (Y136F) and correlates with high levels of azole resistance (Frenkel et al., 2015). Until recently, sin- gle conidium isolates (e.g. Miazzi and Hajjeh, 2011; Fren- kel et al., 2015) or field samples (Montarry et al., 2009;
Dufour et al., 2011), but not chasmothecia, were used to detect marker A495T.
This paper describes a study which aimed to develop a protocol for DNA extraction from individual PM chas- mothecia, to provide evidence that the samples are suit- able for downstream applications. Here, we also present the application and evaluation of a qPCR assay for the detection the DMI fungicide resistance marker A495T in DNA extracts from individual E. necator chasmothecia.
MATERIALS AND METHODS DNA extraction from individual chasmothecia
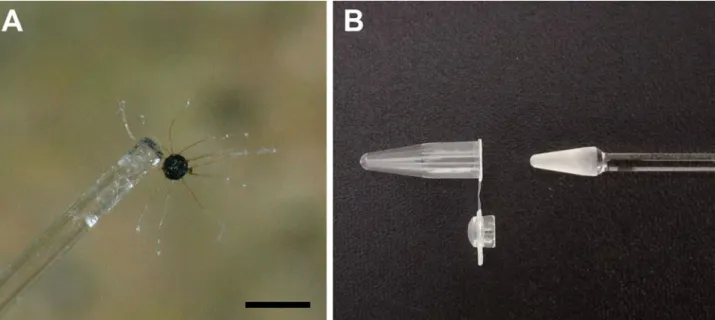
Powdery mildew-infected grapevine leaves were examined in the laboratory under a stereo microscope (Zeiss Stemi 2000C), to isolate chasmothecia. Single
immature (yellow, orange or brown) and mature (dark brown or black) chasmothecia were separated from the mycelium (without any visible hyphal fragments), using sterile glass needles (Figure 1A), and each placed in a 0.2 mL capacity PCR tube containing 20 μL of extraction medium. The following extraction media were tested:
(a) Tris-EDTA (TE) buffer (pH 8; Lonza); (b) 1 M NaOH (Sigma-Aldrich) solution; (c) nuclease-free water (Thermo Fisher Scientific); or (d) dilution buffer of the Phire Plant Direct PCR Kit (Thermo Fisher Scientific). With each extraction medium, DNA was extracted from 15 chas- mothecia as a preliminary experiment. To crush single chasmothecia in the extraction medium in PCR tubes, the following tools were tested; micropestles with either spherical or conical ends (Figure 1B), specifically manu- factured for this purpose (Ranyák Üvegtechnika Anno 1967) or carved pipette tips. These tools were selected to fit into the PCR tubes. After disrupting individual chas- mothecia under observation with a stereo microscope, the suspensions were vortexed for 1 min, centrifuged at 3000 × g for 1 min, and incubated at 97°C for 7 min.
DNA samples obtained in this way were stored at -20°C.
The most suitable extraction medium was selected based on the results of the PCR amplifications (see below).
DNA amplification and sequencing
Four loci were amplified in this study: ITS, IGS, and the TUB2 and CYP51 genes. The following primers were
used in the amplifications: for ITS, ITSEnF/ITSEnR; for IGS, IGSEn1/NS1R; TUB2, Bt2c/Bt2d (Brewer and Mil- groom, 2010); and for EnCYP51, EnCYP89F/EnCYP856R (Frenkel et al., 2015).
For PCR optimization, three ready-to-use PCR mas- ter mix solutions were evaluated. These were Red Taq 2×
DNA Polymerase Master Mix (VWR), DreamTaq Green PCR Master Mix (2X) (Thermo Fisher Scientific) or Phu- sion Green Hot Start II High-Fidelity PCR Master Mix (Thermo Fisher Scientific), which are hereafter referred to as, respectively, Red Taq, DreamTaq and Phusion.
All PCRs were performed in 20 μL final volumes.
Reaction components included 1 μL of 10 μM forward and reverse primers (Sigma-Aldrich), 1 μL DNA tem- plate and 10 μL Red Taq, DreamTaq or Phusion. With the Phusion master mix solution, a range of target vol- umes (0.1 to 4 μL) was tested.
Samples previously resulting in successful amplifica- tions were used as positive control samples, and nucleic acid-free water was used as the target in negative control reactions. To determine the optimal target DNA dilu- tions for the reactions, a series of dilutions was tested, i.e., 50-, 200-, 500-, 1000- and 2000-fold. This test was conducted twice with ten DNA samples for all loci described above using Phusion.
Amplification conditions for PCR with Red Taq and DreamTaq constituted an initial denaturation step for 5 min at 94°C, followed by 35 cycles of 45 s at 94°C, 45 s at 55°C for ITS, at 56°C for IGS and TUB2 and at 57°C for CYP51 primers, and 60 s at 72°C, with a final extension
Figure 1. First steps of sample preparation. A: individual Erysiphe necator chasmothecium attached to the tip of a glass needle. Bar = 250 μm. B: plastic PCR tube (left) and conical glass micropestle (right).
step of 10 min at 72°C. For Phusion cycling, times and temperatures were as follows: 2 min at 98°C, followed by 36 cycles of 5 s at 98°C, 5 s at 60°C and 15 s at 72°C, and a final extension step of 5 min at 72°C, for all loci. PCR products were separated on 1.5% agarose gel containing GelRed (Biotium) in 0.5× TBE buffer, and were visual- ized under UV light.
Randomly selected PCR amplicons from ITS and IGS and all TUB2 and CYP51 products were sent for Sanger sequencing to a service laboratory (LGC Genom- ics GmbH). All PCR products were sequenced in both directions with the same primers used for amplifica- tions. Electrophoregrams were processed and indi- vidually inspected using the Staden Program Package (Staden et al., 2000). The SNP positions connected to the A and B genetic groups and the fungicide resis- tance marker A495T were checked based on Brewer and Milgroom (2010) and Délye et al. (1999). The following GenBank accessions were used as references: GQ255475 (TUB2), GQ255473 (ITS), GQ255476 (IGS; Brewer and Milgroom, 2010) and U83840 (CYP51; Délye et al., 1997).
Representative sequences, obtained in the present study were deposited in GenBank under accession numbers MT023360, MT023361 (ITS); MT023362, MT023363 (IGS); MT023364, MT023365 (TUB2) and MT023366, MT023367 (CYP51).
Molecular cloning of a fragment of CYP51
An approx. 1.8 kb fragment of the E. necator CYP51 gene was amplified with primers EnCYP89F and EnCYP1752R (Frenkel et al., 2015). In these amplifica- tions Phusion was used as described above, with the elongation step in the PCR program set to 40 s. A sin- gle chasmothecium DNA extract of a sample was used as target, which harboured the A495T mutation. The product was purified from 1% agarose gel with a Gen- Elute Gel Extraction Kit (Sigma-Aldrich), ligated into the plasmid pJET1.2/blunt using a CloneJET PCR Clon- ing Kit (Thermo Fisher Scientific), and transformed into One Shot TOP10 Chemically Competent Escherichia coli cells (Thermo Fisher Scientific). One clone was selected randomly from the positive clones, which was propa- gated and used for plasmid extraction with a GenElute Plasmid Miniprep Kit (Sigma-Aldrich). A whole insert sequence was obtained by sequencing with pJET1.2 forward and reverse sequencing primers. The molecu- lar weight of the plasmid was calculated based on the obtained sequence; the concentration of the extracts was measured with a Nanodrop 2000c spectrophotometer.
The copy number of plasmids present in the extracts was calculated as described by Whelan et al. (2003). A stock
of 108CYP51 containing plasmids μL-1 was prepared by diluting in TE buffer, and was aliquoted and stored at -20°C.
Real-time PCR assay
To use qPCR for detection of A495T, the protocol described by Dufour et al. (2011) was modified. The allele specific reverse primer and qEN primer pair were the same as outlined in Dufour et al. (2011). The forward primer used along with the allele-specific primer was substituted to primer L502 (Rallos and Baudoin, 2016), resulting in slightly greater amplification efficiency (see below). Reactions were performed in a Bio-Rad CFX96 Touch C1000 qPCR machine in 10 μL final volumes, with 5 μL of iTaq Universal SYBR Green Supermix (Bio- Rad), primers (for final concentrations, see below) and 1 μL target. The reaction conditions were as follows: initial denaturation at 95°C for 5 min, followed by 40 cycles of 10 s at 95°C, 10 s at 58°C and 20 s at 72°C. Specificity of the qPCR amplifications was checked by registering a melt curve after cycling. Plasmid DNA extract was used as the target in the control reactions and single chas- mothecium DNA extracts were used for allele-specific detection of A495T and for measurements. Negative con- trols (samples without target DNA) were always includ- ed. Each sample was assayed in triplicate, cycle thresh- old (Cq) data were averaged from the triplicates, and the averages were used in the subsequent data analyses.
A dilution series from 106 copies μL-1 to 10 copies μL-1 of the control plasmid DNA extract was prepared in TE buffer by serially diluting the extract 10 times in each step. This dilution series was used to assess the efficiency of primer pairs in the adapted qPCR meth- od. Preparation of the dilution series and efficiency measurements were carried out at least three times in independent experiments for each of the three primer pairs (qEN forward and reverse; qEN136R forward and reverse; L502 paired with qEN136R reverse).
The optimal concentrations for L502 and qEN136R reverse used in allele-specific reactions were determined by the matrix method, in which 50 nM, 100 nM, 200 nM, 400 nM, 600 nM or 800 nM final concentrations of both primers were tested in all combinations. Plasmid extract diluted to 105 copies μL-1 was used as a target in these tests, and each test was repeated once. The qEN forward and reverse primers were used in a final con- centration of 500 nM each, as indicated by Dufour et al.
(2011).
To measure qPCR efficiency with E. necator DNA extracts, three single chasmothecium DNA extracts of samples harbouring the A495T were diluted 10-, 20- or
50-fold in TE buffer. These, along with the undiluted extract, were amplified with the qPCR method described above, and efficiencies were calculated from the Cq data obtained.
Determination of qPCR cut-off for detection of A495T SNP A total of 186 single chasmothecium DNA samples were analyzed with the qPCR method described above.
The known diagnoses of A495T presence, determined earlier with the direct sequencing method and coded as a binary variable, were paired to the corresponding Cq values. The dataset was used for determination of the qPCR cycle threshold cut-off following the epidemiologic approach (Caraguel et al., 2011). Determination of the cut-off was achieved by conducting a receiver operating characteristic (ROC) plot analysis with the MedCalc for Windows software, version 12.2.1.0 (MedCalc Software;
Stephan et al., 2003). The prevalence of A495T among the analyzed samples (25.3%) was assumed to reflect the overall prevalence of the mutation in the sample popula- tions. All other options were used as defaults in the soft- ware. The cycle threshold corresponding to the greatest Youden index (J) was selected, because using this Cq as a cut-off minimizes the probability of overall misclassi- fication (Caraguel et al., 2011) and represents a balance between sensitivity and specificity (Nutz et al., 2011).
The calculated cut-off was used for discrimination of positive and negative samples (i.e., diagnosis) based on Cq values. Samples having Cq values equal to or less than the cut-off were considered positive (Nutz et al., 2011).
False positive and false negative rates (Kralik and Ricchi, 2017) of the tested qPCR method were calculated based on MedCalc output data.
In 20 samples where incongruences between the results of genotyping by direct sequencing and qPCR analyses were found (see below), the relative amounts of mutant allele present in the samples were quantified using the comparative Ct (2-ΔΔCt) method (Livak and Schmittgen, 2001). Plasmid DNA was used as an internal reference; this contained the A495T allele in a 1:1 ratio relative to the whole amount of CYP51 DNA, which was reflected by the qEN amplifications.
RESULTS DNA extractions and PCR amplifications
During the preliminary experiments, DNA was extracted from 15 E. necator chasmothecia, with each
extraction medium and crushing tool. Because the carved pipette tips and spherical end glass micropestles were not effective for disrupting the chasmothecia, only the conical end glass micropestles were used further.
Based on poor PCR amplifications, 90% of the DNA extraction did not result in extracts suitable for PCR amplification when NaOH or water were used as extrac- tion media. However, DNA extractions were success- ful with 14 of 15 samples when TE buffer or the Phire Plant Direct kit buffer were applied, as reflected by PCR amplifications. For further work, TE buffer was select- ed, based on durability and the usability of the DNA extracts in molecular work.
All the target loci (ITS, IGS, TUB2 and CYP51) were successfully amplified with all three master mix solutions tested from individual chasmothecium DNA extracts using TE buffer during the extraction protocol.
However, the PCR performances of Phusion were more consistent with those of other master mixes (Supple- mentary Figure S1). Because of the low error rate of this high-fidelity enzyme, it was selected for all other com- parisons and assessments.
To test the optimal target volume, different tar- get amounts (0.1 to 4 μL) and a series of diluted DNA samples were used as templates for PCR amplifications using Phusion. The optimal target volume for TUB2 was 1 μL from the undiluted DNA extract and 1 μL for the other loci from genomic DNA diluted as described below. Using this target volume, the optimal dilution was 50-fold for ITS and IGS, and 10-fold for CYP51. The greatest dilutions resulting in visible PCR amplicons were 2000-fold for ITS and IGS, and 100-fold for CYP51.
PCRs targeting the TUB2 locus using diluted DNA did not result in visible amplicons.
DNA was extracted from a total of 190 chasmothecia with TE buffer (including preliminary experiments), and sequences were obtained from 98% of all the samples after successful PCR amplifications.
No prominent differences were observed in PCR amplifications between DNA extracts from mature and immature chasmothecia, for the different master mix solutions, target volumes or dilution assays.
Sequence analysis of ITS, IGS, TUB2 and CYP51
All directly sequenced PCR products obtained from individual chasmothecia showed 99% similarity or were identical to the respective reference sequences. Based on TUB2, both A and B genotypes were detected in our samples, according to nucleotide site 79 in the refer- enced GenBank accession (GQ255475). All of the sam- ples belonged to group B, according to two SNP posi-
tions (nucleotide sites 110 and 575 in the coding region of GeneBank accession U83840) in the CYP51 sequences.
Similarly, based on one SNP in ITS (nucleotide site 48 in GQ255473) and one in IGS (nucleotide site 108 in the GQ255476), all the samples belonged to group B.
The mutant allele bearing the A495T point mutation in CYP51, which confers DMI-resistance in E. necator, was detected from approximately one third of the DNA extracts originating from chasmothecia. This is the first report describing the mutant allele in GPM in Hungary.
Overlapping peaks at three polymorphic positions were found in one fifth of the samples during examina- tion of electrophoregrams. Double peaks were present at position 79 and 368 in TUB2 and 495 in CYP51. Thy- mine (T) or cytosine (C) at position 79 in TUB2 is char- acteristic for groups A and B. In CYP51, the overlapping adenine (A) and thymine (T) peaks were present at the nucleotide position corresponding to the A495T muta- tion (Supplementary Figure S2).
Optimized qPCR protocol for detection of A495T
Regression curves resulting from qPCR efficiency tests using plasmid controls fit with correlation coef- ficients R2 ≥ 0.96. Measured amplification efficien- cies were (mean ± standard deviation) 94 ± 2% for the qEN primer pair and 87 ± 1% for the L502-qEN136R reverse primer pair. Primer qEN136R reverse paired with qEN136R forward resulted in lesser amplification efficiencies (79 ± 7%) and less conclusive measurements than L502-qEN136R reverse. Therefore, for allele specific reactions, L502 was used with qEN136R reverse during this study. Primer concentration assay showed that the best combination with the greatest reaction efficiency and low Cq, relative to other combinations, was found at a final concentration of 400 nM for L502 and 600 nM for qEN136R reverse primer.
In the qPCR efficiency tests using single-chasmoth- ecium DNA extracts, 90 ± 1% efficiency was measured for qEN amplifications. Allele-specific amplifications reached an efficiency of 93 ± 8%. All curves fit with regression coefficients R2 ≥ 0.974 (Supplementary Figure S3). Based on reaction coefficients, all the tested dilu- tions were considered to fit in the log-linear range of the applied qPCR method.
Detection of the A495T marker with qPCR
In the ROC analysis that used samples with known diagnoses based on direct sequencing, the resulting Cq cut-off value with the greatest Youden index was 31.3
(Supplementary Figure S4). The applied method has 4%
false negative and 12% false positive rates using this Cq cut-off (Supplementary Figure S4). Twenty samples (10.8%) of the 186 tested were differently genotyped by qPCR than by direct sequencing. Seventeen of these samples were positive in qPCR (harbouring the A495T mutation) but were genotyped as wild-type by direct sequencing. Based on qPCR mea-surements, the ratio of the mutant allele was 20 ± 13% (mean ± standard devia- tion) in these samples.
The electrophoregrams showed that 39 samples con- tained double peaks at position 495 of CYP51. All but three of these samples were positive in qPCR for the presence of the A495T mutation exhibiting the presence of the specific allele involved in DMI resistance.
DISCUSSION
This paper describes an improved DNA extraction and qPCR protocol for genotyping E. necator samples, and for identifying the A495T mutation in this patho- gen, which is involved in DMI fungicide resistance. This study demonstrates that only a single chasmothecium of starting material is sufficient, and that a crude DNA extract can be used to obtain nucleotide sequences and perform qPCR.
In powdery mildew research, molecular protocols without any purification steps, or with only a minor DNA purification step, such as direct PCR methods, have occasionally been used (Hirata and Takamatsu, 1996; Matsuda et al., 2005; Miazzi et al., 2008; Gindro et al., 2014). Conidia and chasmothecia have been used in these protocols with different amounts of starting mate- rial. Miazzi et al. (2008) harvested 10 to 20 conidia from infected samples. Matsuda et al. (2005) picked only indi- vidual conidia from each powdery mildew colony, using a glass needle and a manipulator and transferred these directly to the PCR mixture. With these protocols, mul- tiplex PCR amplifications are possible, but there is no remaining target DNA for further assessment. Gindro et al. (2014) extracted DNA from grapevine buds infect- ed with E. necator, diluted the extracts and used them directly for PCR. The detection limit with this method, as for earlier reports (Matsuda et al., 2005; Falacy et al., 2007), was one conidium per microliter (Gindro et al., 2014). Obtaining DNA from individual conidia for downstream applications, like qPCR and LAMP (Thies- sen et al., 2016), is also possible, but for this it is neces- sary to use either a DNA extraction kit (Thiessen et al., 2016) or Chelex 100 reagent (Thiessen et al., 2018). To obtain more DNA, with less purification steps, extract-
ing from larger structures (such as chasmothecia), can be a solution. Based on our findings, only one chasmo- thecium is enough to obtain sufficient DNA for multi- ple PCR amplifications. In contrast to earlier protocols using 20 (Hirata and Takamatsu, 1996) or ten (Mougou et al., 2008) chasmothecia, we were able to amplify and sequence four loci and perform qPCR from only 20 μL DNA extracts of individual chasmothecia.
During DNA extraction from one chasmothecium, different extracting media were tested. Sodium hydrox- ide can be used for DNA extraction from plant mate- rial, with the reasoning that the alkaline pH suppress- es nucleases and does not affect the subsequent PCR amplifications (Wang et al., 1993). However, our results showed that water and NaOH were of reduced extraction efficiency. TE buffer and Phire Plant Direct PCR kit buf- fer were superior as extraction media, demonstrated by the high success rate of PCR amplifications using these solutions. For further extractions, TE buffer was select- ed because the shelf life of the DNA extract was pro- longed compared with other extraction media (Yagi et al., 1996). DNA extractions from mature and immature chasmothecia gave equal success rates of PCR amplifica- tions (98%), which demonstrates that this method can be implemented for small structures, such as yellow, imma- ture ascocarps.
The method described here enabled genotyping of E.
necator from individual chasmothecia, using multilo- cus sequencing to determine if each sampled belonged to genetic group A or B of the pathogen. Based on direct sequencing of TUB2, group A was detected several times.
In contrast, all of our samples belonged to group B based on CYP51 sequences, without any polymorphism in two marker nucleotide positions, which have been shown to be diverse in other samples (Délye et al., 1999). Amrani and Corio-Costet (2006) and Araya et al. (2014) found no contradiction between the results obtained based on genotyping of TUB2 and CYP51; that is, all the markers were congruent and assigned to one genetic group. Fur- ther work is needed to study the linkages between the loci used for the description of groups A and B.
Délye and Corio-Costet (1998) and Délye et al. (1997;
1999) stated that group A only reproduces clonally.
However, samplings from some populations have sug- gested that sexual reproduction may be possible (Miaz- zi et al., 2003; Cortesi et al., 2004). Mating type assays revealed that group A can produce chasmothecia and viable ascospores in laboratory conditions (Miazzi et al., 2003; Cortesi et al., 2004). We detected markers of group A in chasmothecia, which indicates that sexual repro- duction is also possible in field conditions. Moreover, co-occurrence of groups A and B was detected in DNA
extracts from individual chasmothecia, indicating that mating between these two groups happens in vineyards.
This phenomenon was demonstrated in in vitro experi- ments (Miazzi et al., 2008), but has not been reported from field samples. If only anamorph structures are examined, it is not possible to determine if any of the genotypes reproduces sexually. Extended sampling of many chasmothecia and application of the genotyp- ing method described here would address this question.
Using only individual conidia or mixtures of chasmoth- ecia for DNA extraction may hide the presence of group A, described previously as only clonal, if it were present at low ratios. This also emphasizes the importance using individual chasmothecia for DNA extractions. Double peaks were present in about a fifth of the electrophore- grams obtained in the present study, indicating the pre- sence of a mixture of different genotypes in some DNA extracts from individual chasmothecia (Lesemann et al., 2006; Kovács et al., 2011). Possible explanations could be sexual processes between two colonies harbouring two different genotypes (for TUB2 and CYP51), or increased copy number (for CYP51) under pressure from DMI fun- gicide applications (Jones et al., 2014; Rallos and Bau- doin, 2016). For DNA extractions, we only sampled chas- mothecia, and despite great care was taken, it cannot be ruled out that in some cases mycelium around each chasmothecium was also sampled. This may have result- ed in mixed genotypes in the DNA extracts, which were not present in the chasmothecia.
The qPCR and DNA extraction protocol described here is suitable for high-throughput genotyping of E.
necator samples to determine the presence of the A495T mutation. The method is more rapid and cost-effective for this purpose than genotyping based on direct sequenc- ing. From our samples, 20 were differentially diag- nosed by qPCR and direct sequencing, and most (17) were diagnosed positive for the mutation only by qPCR.
This implies that the method used for reference (e.g.
direct sequencing) has less sensitivity than the devel- oped qPCR-based diagnostic method (Kralik and Ricchi, 2017). Consequently, we conducted quantification of the resistant allele in these samples. The samples genotyped as resistant based on qPCR had a low ratio of the mutant allele (20 ± 13%), and these were identified as harbouring the wild-type allele only by direct sequencing. The proto- col involving PCR followed by direct sequencing is pos- sibly not sensitive enough for accurate characterization if the targeted allele is present at low ratios.
For cut-offs differentiating positive and negative sam- ples based on measured Cq values, we selected that with the greatest Youden index. This method sets the cut-off so that the assay has the least probability of misclassifi-
cation (Caraguel et al., 2011), when the calculated cut-off of Cq = 31.3 is used for diagnostics. However, the cut- off can be set to prioritize other characteristics of the assay, for example, to minimize the probability of false- negatives or false-positives. The most suitable selection should be based on the purpose of each diagnostic test (Caraguel et al., 2011).
An individual chasmothecium can be a discrete unit for gaining an adequate amount of DNA, and for pro- viding information on inter- and intra-specific variation, species complexes and population biology. Conidia are also discrete units. However, to obtain enough DNA for downstream processes (e.g., multilocus analyses), labour intensive methods (e.g. Thiessen et al., 2016) or time consuming production of single conidial colonies, is currently necessary (Erickson and Wilcox, 1997; Miazzi et al., 2008). In contrast to single conidia, chasmothecia can be collected from herbarium material (e.g. pressed leaves) without any visible hyphal fragments from the adjacent colonies.
We have developed a rapid DNA extraction method for very small fungal samples to obtain DNA for down- stream sequencing and qPCR purposes. As fruiting bod- ies are morphologically and taxonomically identifiable units, and are large enough to genotype fungal samples, this method may be applicable to any chasmothecia-pro- ducing powdery mildew species, as well as for fruiting bodies of other plant colonizing fungi. The qPCR pro- tocol presented here for detection of the SNP linked to DMI fungicide resistance can be implemented in plant disease diagnostics.
ACKNOWLEDGEMENTS
This research was supported by the Széchenyi 2020 Programme, the European Regional Devel- opment Fund and the Hungarian Government (GINOP-2.3.2-15-2016-00061), and partly supported by ELTE Institutional Excellence Program by the National Research, Development and Innovation Office (NKFIH- 1157-8/2019-DT). K.Z. Váczy’s contribution was sup- ported by a János Bolyai Research Scholarship from the Hungarian Academy of Sciences. M.Z. Németh was sup- ported by the ÚNKP-19-3 New National Excellence Pro- gram of the Ministry for Innovation and Technology.
LITERATURE CITED
Amrani L., Corio-Costet M.F., 2006. A single nucleotide polymorphism in the β-tubulin gene distinguishing
two genotypes of Erysiphe necator expressing differ- ent symptoms on grapevine. Plant Pathology 55: 505–
Araya C., Rosales I., Mendez M.A., Delmotte F., 2014. 512.
Identification and geographic distribution of genetic groups of Erysiphe necator in Chilean vineyards. Vitis 53: 163–165.
Beenken L., 2017. First records of the powdery mildews Erysiphe platani and E. alphitoides on Ailanthus altissima reveal host jumps independent of host phy- logeny. Mycological Progress 16: 135–143.
Brewer M.T., Milgroom M.G., 2010. Phylogeography and population structure of the grape powdery mildew fungus, Erysiphe necator, from diverse Vitis species.
BMC Evolutionary Biology 10: 268.
Caraguel C.G., Stryhn H., Gagné N., Dohoo I.R., Ham- mell K.L., 2011. Selection of a cutoff value for real- time polymerase chain reaction results to fit a diagnostic purpose: analytical and epidemiologic approaches. Journal of Veterinary Diagnostic Investi- gation 23: 2–15.
Cortesi P., Ottaviani M.-P., Milgroom M.G., 2004. Spatial and genetic analysis of a flag shoot subpopulation of Erysiphe necator in Italy. Phytopathology 94: 544-550.
Cortesi P., Bisiach M., Ricciolini M.,Gadoury D.M., 1997.
Cleistothecia of Uncinula necator—an additional source of inoculum in Italian vineyards. Plant Dis- ease 81: 922–926.
Délye C., Corio-Costet M.-F., 1998. Origin of primary infections of grape by Uncinula necator: RAPD analy- sis discriminates two biotypes. Mycological Research 102: 283–288.
Délye C., Laigret F., Corio-Costet M.-F., 1997. A muta- tion in the 14 alpha-demethylase gene of Uncinula necator that correlates with resistance to a sterol bio- synthesis inhibitor. Applied and Environmental Micro- biology 63: 2966–2970.
Délye C., Ronchi V., Laigret F., Corio-Costet M.-F., 1999.
Nested allele-specific PCR primers distinguish genet- ic groups of Uncinula necator. Applied and Environ- mental Microbiology 65: 3950–3954.
Dufour M.C., Fontaine S., Montarry J.,Corio‐Costet M.-F., 2011. Assessment of fungicide resistance and pathogen diversity in Erysiphe necator using quanti- tative real‐time PCR assays. Pest Management Science 67: 60-69.
Erickson E.O.,Wilcox W.F., 1997. Distributions of sensitiv- ities to three sterol demethylation inhibitor fungicides among populations of Uncinula necator sensitive and resistant to triadimefon. Phytopathology 87: 784–791.
Falacy J.S., Grove G.G., Mahaffee W.F., Galloway H., Glawe D.A., Larsen R.C.,Vandemark G.J., 2007.
Detection of Erysiphe necator in air samples using the polymerase chain reaction and species-specific prim- ers. Phytopathology 97: 1290–1297.
Frantzeskakis L., Németh M.Z., Barsoum M., Kusch S., Kiss L., Takamatsu S., Panstruga R., 2019. The Parauncinula polyspora Draft Genome Provides Insights into Patterns of Gene Erosion and Genome Expansion in Powdery Mildew Fungi. mBio 10:
e01692–01619.
Frenkel O., Cadle-Davidson L., Wilcox W.F., Milgroom M.G., 2015. Mechanisms of resistance to an azole fungicide in the grapevine powdery mildew fungus, Erysiphe necator. Phytopathology 105: 370–377.
Frenkel O., Portillo I., Brewer M., Peros J.-P., Cadle‐
Davidson L., Milgroom M., 2012. Development of microsatellite markers from the transcriptome of Erysiphe necator for analysing population structure in North America and Europe. Plant Pathology 61:
106–119.
Gadoury D.M., Pearson R.C., 1988. Initiation, develop- ment, dispersal and survival of cleistothecia of Unci- nula necator in New York vineyards. Phytopathology 78: 1413–1421.
Gadoury D.M., Cadle‐Davidson L., Wilcox W.F., Dry I.B., Seem R.C., Milgroom M.G., 2012. Grapevine pow- dery mildew (Erysiphe necator): a fascinating system for the study of the biology, ecology and epidemiol- ogy of an obligate biotroph. Molecular Plant Pathol- ogy 13: 1–16.
Gindro K., Lecoultre N., Molino L., de Joffrey J.-P., Sch- nee S., … Dubuis P.-H., 2014. Development of rapid direct PCR assays to identify downy and powdery mildew and grey mould in Vitis vinifera tissues.
OENO One 48: 261–268.
Glawe D.A., 2008. The powdery mildews: a review of the world’s most familiar (yet poorly known) plant path- ogens. Annual Review of Phytopathology 46: 27–51.
Hirata T., Takamatsu S., 1996. Nucleotide sequence diver- sity of rDNA internal transcribed spacers extracted from conidia and cleistothecia of several powdery mildew fungi. Mycoscience 37: 283–288.
Jones L., Riaz S., Morales-Cruz A., Amrine K.C., McGuire B., … Cantu D., 2014. Adaptive genomic structural variation in the grape powdery mildew pathogen, Erysiphe necator. BMC Genomics 15: 1081.
Jousimo J., Tack A.J., Ovaskainen O., Mononen T., Susi H., Tollenaere C., Laine A.-L., 2014. Ecological and evolutionary effects of fragmentation on infectious disease dynamics. Science 344: 1289–1293.
Kovács G.M., Jankovics T., Kiss L., 2011. Variation in the nrDNA ITS sequences of some powdery mildew spe- cies: do routine molecular identification procedures
hide valuable information? European Journal of Plant Pathology 131: 135.
Kralik P., Ricchi M., 2017. A basic guide to real time PCR in microbial diagnostics: definitions, parameters, and everything. Frontiers in Microbiology 8: 108.
Lesemann S., Schimpke S., Dunemann F., Deis- ing H., 2006. Mitochondrial heteroplasmy for the cytochrome b gene controls the level of strobilurin resistance in the apple powdery mildew fungus Podosphaera leucotricha (Ell. & Ev.) ES Salmon. Jour- nal of Plant Diseases and Protection 113: 259–266.
Livak K.J., Schmittgen T.D., 2001. Analysis of relative gene expression data using real-time quantitative PCR and the 2− ΔΔCT method. Methods 25: 402–
Marçais B., Piou D., Dezette D., Desprez-Loustau M.-L., 408.
2017. Can oak powdery mildew severity be explained by indirect effects of climate on the composition of the Erysiphe pathogenic complex? Phytopathology 107: 570–579.
Matsuda Y., Sameshima T., Moriura N., Inoue K., Non- omura T., … Toyoda H., 2005. Identification of indi- vidual powdery mildew fungi infecting leaves and direct detection of gene expression by single conid- ium polymerase chain reaction. Phytopathology 95:
1137–1143.
Miazzi M., Hajjeh H., 2011. Differential sensitivity to tri- adimenol of Erysiphe necator isolates belonging to different genetic groups. Journal of Plant Pathology:
729–735.
Miazzi M., Hajjeh H., Faretra F., 2003. Observations on the population biology of the grape powdery mildew fungus Uncinula necator. Journal of Plant Pathology:
123–129.
Miazzi M., Hajjeh H., Faretra F., 2008. Occurence and Distribution of Two Distinct Genetic Groups In Pop- ulations of Erysiphe necator Schw. in Southern Italy.
Journal of Plant Pathology: 563–573.
Montarry J., Cartolaro P., Richard-Cervera S., Delmotte F., 2009. Spatio-temporal distribution of Erysiphe necator genetic groups and their relationship with disease levels in vineyards. European Journal of Plant Pathology 123: 61–70.
Montarry J., Cartolaro P., Delmotte F., Jolivet J., Willoc- quet L., 2008. Genetic structure and aggressiveness of Erysiphe necator populations during grapevine pow- dery mildew epidemics. Applied and Environmental Microbiology 74: 6327–6332.
Mougou A., Dutech C., Desprez‐Loustau M.L., 2008.
New insights into the identity and origin of the caus- al agent of oak powdery mildew in Europe. Forest Pathology 38: 275–287.
Nutz S., Döll K., Karlovsky P., 2011. Determination of the LOQ in real-time PCR by receiver operating charac- teristic curve analysis: application to qPCR assays for Fusarium verticillioides and F. proliferatum. Analyti- cal and Bioanalytical Chemistry 401: 717–726.
Parker J.E., Warrilow A.G., Price C.L., Mullins J.G., Kelly D.E., Kelly S.L., 2014. Resistance to antifungals that target CYP51. Journal of Chemical Biology 7: 143–161.
Rallos L.E.E., Baudoin A.B., 2016. Co-occurrence of two allelic variants of CYP51 in Erysiphe necator and their correlation with over-expression for DMI resist- ance. PloS One 11: e0148025.
Staden R., Beal K.F., Bonfield J.K. 2000. The staden pack- age, 1998. Pages 115-130 in: Bioinformatics methods and protocols. Springer.
Stephan C., Wesseling S., Schink T., Jung K., 2003. Com- parison of eight computer programs for receiver- operating characteristic analysis. Clinical Chemistry 49: 433–439.
Sundberg H., Ekman S., Kruys Å., 2018. A crush on small fungi: An efficient and quick method for obtaining DNA from minute ascomycetes. Methods in Ecology and Evolution 9: 148–158.
Susi H., Laine A.L., 2017. Host resistance and pathogen aggressiveness are key determinants of coinfection in the wild. Evolution 71: 2110–2119.
Takamatsu S., Matsuda S., Grigaliunaite B., 2013. Com- prehensive phylogenetic analysis of the genus Golovinomyces (Ascomycota: Erysiphales) reveals close evolutionary relationships with its host plants.
Mycologia 105: 1135–1152.
Thiessen L., Keune J., Neill T., Turechek W., Grove G., Mahaffee W., 2016. Development of a grower‐con- ducted inoculum detection assay for management of grape powdery mildew. Plant Pathology 65: 238–
Thiessen L.D., Neill T.M., Mahaffee W.F., 2018. Devel-249.
opment of a quantitative loop-mediated isothermal amplification assay for the field detection of Erysiphe necator. PeerJ 6: e4639.
Vági P., Kovacs G.M., Kiss L., 2007. Host range expansion in a powdery mildew fungus (Golovinomyces sp.) infecting Arabidopsis thaliana: Torenia fournieri as a new host. European Journal of Plant Pathology 117:
89–93.
Wang H., Qi M., Cutler A.J., 1993. A simple method of preparing plant samples for PCR. Nucleic Acids Research 21: 4153.
Whelan J.A., Russell N.B., Whelan M.A., 2003. A method for the absolute quantification of cDNA using real- time PCR. Journal of Immunological Methods 278:
261–269.
Yagi N., Satonaka K., Horio M., Shimogaki H., Tokuda Y., Maeda S., 1996. The role of DNase and EDTA on DNA degradation in formaldehyde fixed tissues. Bio- technic & Histochemistry 71: 123–129.