AREA-BASED AND DASYMETRIC POINT ALLOCATION INTERPOLATION METHOD FOR SPATIAL MODELLING MICRO-SCALE VOTER TURNOUT IN BUDAPEST
Tamás KOVALCSIK1* , Balázs SZABÓ2 , György VIDA1 , Lajos BOROS1
DOI: 10.21163/GT_2021.161.06 ABSTRACT:
Spatial and temporal distribution of voter turnout can be an appropriate indicator of socio-demographic processes. Since elections are held more frequently than national censuses, their results may refine our picture of the temporal changes of the population. Due to the evolution of statistical applications and queries, gathering data on smaller geographical scales enables researchers to analyze social and political processes on a micro-scale. This kind of research is particularly relevant in the analysis of the transformation of metropolitan areas with significant population concentration are characterized by rapid transformation and high degree of variation. Therefore, the paper aims to develop a method for reaggregating precinct-level electoral results which are spatially inconsistent throughout different elections in the case of Budapest (Hungary). The developed area-based and dasymetric point allocation interpolation can transform the territorially aggregated but inconsistent electoral results into one target subdivision. The changes of voter turnout in different urban areas are related to socio-demographic processes, such as inner suburbanization, gentrification, studentification, or the transformation of former industrial (transitional) areas within the city.
Key-words: Areal interpolation, Dasymetric mapping, Areal weighting, Budapest, Voter turnout.
1. INTRODUCTION
One of the most measurable and expressive forms of political participation is voter turnout (Kostadinova, 2003), a good indicator of political activity of a society. Research on the spatiality of voter turnout is important in relation to the political representation of different places, as areas with a stable high level of participation have greater influence on decision-making processes, while areas with lower political activity have a lower influence (Lijphart, 1997). In addition, spatial differences in voter turnout are related to several other spatial social factors, such as disadvantage (Michener, 2017) or the social capital and local cohesion (Putnam, 1995). Furthermore, changes in the level of voter turnout indicate several other social processes as well. For instance, declining turnout is a good indicator of declining trust in political institutions, as disappointed voters stay away from the ballot box (Putnam, 2000). Moreover, elections are held more frequently than population censuses, thus they can serve as additional information of social processes like rapid transformation and high degree of variation in metropolitan areas (Charney & Malkinson, 2015).
Therefore, the examination of both spatial differences and temporal changes of voter turnout in metropolitan areas provides information about the involvement of local society in political issues, the extent of social capital, local cohesion and social exclusion. Therefore, this analysis is investigated the spatial characteristics and temporal variability of voter turnout on the lowest possible scale, in the only metropolitan area of Hungary, Budapest. The country has a mixed electoral system since the change of regime (1990); the mandates come from single-member constituencies and party lists. Until 2010 the elections had two rounds, but after the electoral reforms in 2011 the number of rounds has been decreased to one.
_____________________________
1Department of Economic and Social Geography, University of Szeged, H-6722 Szeged, Hungary;
kovalcsik.tamas@geo.u-szeged.hu; vidagy@geo.u-szeged.hu; borosl@geo.u-szeged.hu.
2Geographical Institute, Research Centre for Astronomy and Earth Sciences, Eötvös Loránd Research Network, H-1112 Budapest, Hungary; szabo.balazs@csfk.mta.hu.
* Correspondence: kovalcsik.tamas@geo.u-szeged.hu.
Even though the capital city appears as a set of constituencies in several studies (Kovács & Vida, 2015; Vida, 2016), our aim is to analyse its complicated inner structure that is not understandable on the level of electoral or administrative districts. Since the change of regime, the area belongs to a polling station (precinct – where the ballots are counted) was redrawn for each election. It represents a typical example for the modifiable area unit problem (MAUP) (Wong, 2004). Thus, in this study an areal interpolation method had to be implemented which can reaggregate the geographically inconsistent precinct-level turnout values to one target subdivision. The method uses an automated algorithm – combining the principles of areal weighting and dasymetric interpolation – to estimate the voter turnout of the target units.
Based on the above, the aim of this research is twofold, on the one hand, the development of a new areal interpolation method for the reaggregation of inconsistent spatial subdivision containing relative indicators specifically for precincts and electoral results. On the other hand, mapping of micro-scale electoral data enable us to analyse detailed socio-demographic transformations within a metropolitan area, through the analysis of the temporal transformation in the spatiality of voter turnout and the identification of the related social processes.
The study is structured as follows, in the literature review we presented the usability and characteristics of areal interpolation and the other methods based on it. In the methodology the difficulties of drawing the geometry of the precincts – due to the lack of geographically defined geometry – were discussed. In the next step, the area-based and dasymetric point allocation interpolation method was developed in order to reaggregate these precinct data into one subdivision.
The first part of the results, we checked the accuracy of our reaggregation with RMSE and MAPE indicators, while in the second part, the spatiality and temporal distribution of voter turnout were analysed and visualized. Finally, the wide usage of the method is presented in the conclusions.
2. METHODS OF AREAL INTERPOLATION
Spatial interpolation is a method for estimating values from locations with known values to another spatial formation (Lam, 2009). Contrary to the traditional method – which generates a specific surface from point data – areal interpolation (a special type of spatial interpolation) can estimate the spatial distribution of a variable in a given subdivision using the original aggregated data (Goodchild
& Lam, 1980). Thus, it is a spatial data transformation from the original (available) set (source units) to the derived set (target units – in which the necessary analysis can be conducted) of overlapping units (Langford, Maguire & Unwin, 1991). This is a useful method when the different datasets to be compared are in a spatially inconsistent distribution (Walford & Hayles, 2012). Inconsistency in spatial datasets can come from source differences - where different social, economic and demographic data are collected in differing units (i.e., an alternative geography problem (Amos, McDonald &
Watkins, 2017)). But same type datasets – from different times, however – can be generated from significantly inconsistent spatial subdivisions (i.e., a temporal mismatch problem – (Pavía &
Cantarino, 2017; Walford & Hayles, 2012)). The question is what specific methods should be used in areal interpolation. These methods have already been compared in various studies (Amos, McDonald
& Watkins, 2017; Comber & Zeng, 2019; Goodchild, Anselin & Deichmann, 1993; Lam, 1983).
Therefore, only those which are relevant to our research methods are detailed below.
Areal weighting is the best known and the most straightforward approach, and one that can be easily implemented (Comber & Zeng, 2019; Kim & Yao, 2010). This method assumes that the population density does not change within the units of the source subdivision (Zoraghein et al., 2016).
Therefore, the population of the source zones is distributed area proportionately to spatial units (Goodchild & Lam, 1980; Lam, 1983). Accepting this assumption, the method consists of only one geometric intersection of source and target zones, where the value of each target unit can be calculated as a weighted sum of the data from intersected source zones (Langford, 2006). The weight is the ratio of the area of the intersected source unit to the original area of this unit (Flowerdew & Green, 1992).
In several research, areal weighting is the initial and original method of areal interpolation because it has no need for any further (hereinafter referred as ancillary) information to the estimation (Mennis,
2003; Monteiro et al., 2019; Zoraghein et al., 2016). However, its homogeneity assumption – which is rarely true in the real world – is the glaring disadvantage of the method (Comber & Zeng, 2019).
Many studies use ancillary information to alleviate this problem. Without claiming comprehensiveness, this information can even be residential and non-residential zones from imagery (Fisher & Langford, 1996), population density (Eicher & Brewer, 2001), residential or cadastral parcels (Zoraghein et al., 2016), the number of housing units within one census tract (Deng & Wu, 2013) or decennial census data (Liu & Martinez, 2019). According to Mennis (2003), areal interpolation which uses ancillary (additional and related) data can be defined as dasymetric mapping.
Wright (Wright, 1936) was one of the first to use population density to refine areal interpolation; the literature considers this work the beginning of dasymetric mapping, even though the method has Russian origins (Mennis, 2009). Dasymetric mapping essentially refines the assumption of homogeneity within the source unit of the areal weighting method so that it can estimate the more appropriate proportion of the population within the target units.
3. DATA AND METHODS
Our investigation is derived from territorially aggregated data (such that unit of analysis is the polling station, where the ballots are counted). Every polling station has a small geographical area within which the associated voters live. Depending on the traditions of various countries, these areas are called: election districts, wards, or most commonly precincts, which is the name we use in this paper (Amos, McDonald & Watkins, 2017). The first task was to geometrically define and draw these areas in physical space, because the (Hungarian) National Electoral Commission has only provides lists of the names of the public spaces belonging to these areas (without any further geographical information). Moreover, these have only been publicly available since the 2002 parliamentary elections. Information for precinct areas in the pre-2002 elections was found only on the website of another research team (o-o-o.hu). It must be noted that the division of the precincts available for the 1990 elections contained so many errors that its results should be considered with due caution. To increase reliability, the precincts’ geometries for the post-2002 elections were drawn manually.
However, we are working on an automated procedure for future research, which will draw the divisions from the raw precinct descriptive lists. In summary, in the first phase of data preparation the geographical division of Budapest's precincts was prepared for the last eight parliamentary elections (between 1990 and 2018) and connected with their turnout levels.
The next phase of data preparation, namely the precinct-level election results in an inconsistent spatial distribution, was organized into an integrated database, to be able to implement a cross-election analysis. This was achieved using an areal interpolation method, which was developed by the principles of areal weighting and dasymetric mapping. In this new method points represent all eligible voters. In this phase of the methods, these points are evenly distributed within each precinct. Points in each precinct are defined as intersections of square grids. This grid network procedure ensures that the distribution of points is essentially even – thus they are area proportional. One of ArcGIS's plugins, the Geospatial Modelling Environment’s ‘genregularpntsinpolys’ tool, is used to generate points. The tool uses polygons as input data and interprets distance as an input parameter as the side length of the squares that make up the grid. The side lengths of the squares forming the grid of each precinct were calculated using the following equation:
𝑥
𝑖= √ 𝑇
𝑖𝑉
𝑖(1)
where i is the index of each precinct, Ti is the area of the ith precinct and Vi is the number of voters in the ith precinct.
Each point contains the turnout level of its own precinct, in the form of the probability (0 ≤ p ≤ 1) of participation. By accurately placing all the points on the map, the election result of any part of the space can be determined from the sum of the probabilities of the points in that part of the space.
In its present state, the result of this method does not differ in any way from an areal interpolation performed via the simple areal weighting method. However, by manipulating the number and placement of points, the interpolation method can be refined more easily and clearly.
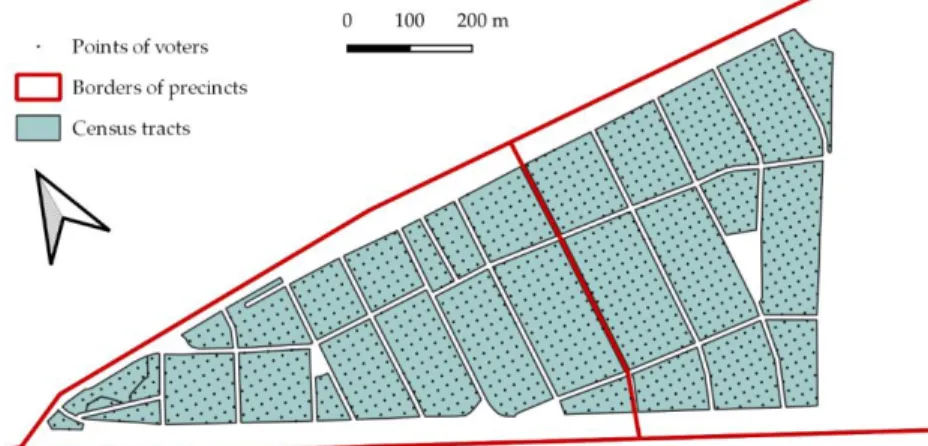
The basic principle of dasymetric mapping method holds that the population is not evenly distributed in space, and therefore some ancillary information is needed to achieve a more accurate areal interpolation. As the precincts basically cover a small population (between 500 and 1500 voters), three problems emerged. First, the geometries of precincts do not necessarily cover only residential areas; the municipal governments are responsible for the creation of precincts and, they distribute into polling stations all addresses, regardless of whether they are residential or non-residential. To solve this problem, the areas of those census tracts with residential populations were used, as maintained by the Hungarian Central Statistical Office. These were refined based on the information from freely available orthophotos (geoshop.hu). Thus, only the areas of Budapest where voters live were considered. In this case the areas in any given precinct will not be contiguous, therefore the points belonging to the given precinct must be distributed area proportionally among the individual tracts (area proportional allocation) (Fig. 1) according to the following equation:
𝑉
𝑖𝑗= 𝑇
𝑖𝑗𝑇
𝑖∗ 𝑉
𝑖(2)
where Tij is the area of the jth census tract in the ith precinct.
Thus, the distance defined in the first equation is no longer to be determined for each precinct, but instead for each census tract based on the following equation:
𝑥
𝑖𝑗= √ 𝑇
𝑖𝑗𝑉
𝑖𝑗(3)
With this step the method is based on the number of voters in a census tract, which can be further refined with a procedure based on ancillary information.
Fig. 1. A sample of the geographical position of Budapest's precincts, census tracts and generated points.
The second problem is related to large housing estate buildings, because the statistical office’s tracts of these areas are much larger than the buildings themselves, due to the large (green or parking) spaces surrounding them buildings (Fig. 2). Therefore, two precincts (from two different election years) with the same address list can be correctly defined with completely different boundaries, depending on to which precinct these free spaces are attached. To solve this, the tracts of large housing estates were deleted and instead the geometry of the large housing estate buildings from the
‘buildings’ layer of the OpenStreetMap database (GeoFabrik) were used. The geometry was cross- checked with ortophotos (obtained from www.fentrol.hu operated by the Lechner Knowledge Center) ensuring its precision and accuracy. The third problem is that there are precincts that include both single-standing family houses and large housing estate buildings. Whereas the population density of the two residential types is completely different, an area proportional allocation would place more points in the tract of family houses than can be occupied (and, in parallel, much fewer in tracts of large housing estates). However, due to the previous work on this issue (Szabó & Bene, 2019), there is a flat number attribute for each building. These were used as a weight to solve this problem. Thus, for these polygons, not their own area, but the number of flats multiplied by the average parcel size (approximately 1000 square meters) was considered in the area proportional allocation. Thus, the assumption is not be perfect, as the parcel of a family house does not have the same area everywhere, and the number of voters living in the large housing estates and the single-standing family house is not the same. Due to the above-mentioned issues this seems to be the best approximation to reality in the absence of further data (Fig. 2).
(a) (b)
Fig. 2. Illustration of the justification for the (a) use and (b) implementation of large housing estate buildings.
The final subdivision into which the precinct results of all parliamentary elections were aggregated was manually formed based on the latest (2018) precinct divisions. The guiding principle was to create consistent units by functional and built-in categories and to keep the variance of voter numbers in units as low as possible. There are 1100 units in the target subdivision, while the numbers for original (source) precincts were between 1410 and 1628. In the further part of the research, this division is used for statistical analysis of spatiality and temporal distribution of voter turnout in Budapest. However, before analyzing databases, estimates were checked. In the previous section, we discussed the limitations of measurement reliability. Taking these limitations into consideration, two different indicators were used. The RMSE is defined in the following equation:
𝑅𝑀𝑆𝐸 = √1
𝑛∗ ∑(𝑃𝑖− 𝑉̂𝑖)2
𝑛
𝑖=1
(4)
The second indicator is mean absolute percentage error (MAPE), which can eliminate distortions arising from the different sizes of zones (Zhang & Qiu, 2011). The MAPE is defined in the following equation:
𝑀𝐴𝑃𝐸 =
∑ |𝑃𝑖− 𝑉̂𝑖| 𝑃𝑖 𝑛𝑖=1
𝑛
(5)
where i is the index of each target unit, n is the number of target units, Pi is the actual ith target unit total population, and Vi is the estimated ith target unit voters.
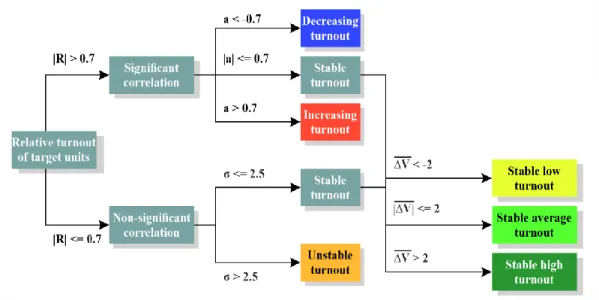
After calculating the accuracy of the reaggreation, we examined the spatial structure of Budapest according to the temporal dynamics of voter turnout. On the one hand, the turnout level of the target units in each election year was compared to the average turnout level in Budapest of that year (relative turnout: ∆𝑉𝑡𝑖 = 𝑉𝑡𝑖− 𝑉̅̅̅𝑡𝑖, where V is the voter turnout, t is the election year and i is the index of each target unit). This comparison alleviates the effects of the changes in turnout between elections. On the other hand, the target units were classified based on how voter turnout changed in them. For this, four different indicators were calculated for each unit, a standard deviation (σ), an arithmetic mean (∆𝑉̅̅̅̅), a correlation coefficient (R) and a slope of the regression line (a) (as shown in the Fig. 3). The first two do not need further explanation, they are only descriptive statistical indicators of the relative voter turnouts of each unit in different years. However, in the calculation of the latter two indicators, the relative turnouts in each unit were correlated with an increasing linear reference scale (1,2, … ,8 – a larger number means later elections), and the slope of this relationship was used. These indicators show the tendencies within the changes of relative voter turnout; if both the coefficient and the slope are positive and close to 1, the voter turnout within the spatial unit is constantly increasing since 1990.
Fig. 3. Classification method of target subdivision by its relative voter turnout.
4. RESULTS
The results are divided into two parts, at first, we evaluated the methodology of database reaggregation, in which we measured the reliability of the developed areal interpolation method. The applied method was called area-based and dasymetric point allocation interpolation method. With the creation of the database, it is possible to analyse the voter turnout of Budapest longitudinally.
4.1. The evaluation of the area-based and dasymetric point allocation interpolation method The accuracy of the database reaggregation methodology was measured by two metrics, RMSE and MAPE. The RMSE measures absolute error to the related distribution (which in this case is the distribution of the census closest to the election), while MAPE measures relative error. The rate of RMSE errors can be considered average, considering the values in the literature and the usability of the basic data used in the study. In Fisher and Langford’s study (1996), 22 percent (mean: 4597), Kim and Yao (2010) have 12 percent (mean: 6156), Langford (2013) has 47 percent (mean: 308), Liu and Martinez (2019) have 11 percent (mean: 4192) the lowest RMSE error. In the latter a much higher error was achieved with lower resolution by the same method, which also shows that the percentage of RMSE error strongly depends on the average size of the target units.
Considering that we did not have a reference population for the census tracts for each election year, and that we calculated the total population and not the population of the voting age, the error can still be considered small (Table 1). The high values of 2014 and 2018 do not indicate the inaccuracy of the method, but simply that the election year is moving further and further away from the census and the transformation of the inner spatial structure of the city (e.g. the significant migration to Western countries, inner migration, population change caused by investments etc.) creates more and more discrepancies. However, it is important to highlight that voters with other permanent address (but voting in Budapest) may distort the results of the MAPE or RMSE. The number of these voters during the elections of 2014 and 2018 increased – although it contributes to the growth of the errors, it does not fully explain that.
Table 1.
Errors of area-based and dasymetric point allocation interpolation for each election.
1990 (to 1990)
1994 (to 1990)
1998 (to 2001)
2002 (to 2001)
2006 (to 2011)
2010 (to 2011)
2014 (to 2011)
2018 (to 2011) RMSE 304
(22.3%) 304 (22.6%)
317 (23.6%)
248 (19.8%)
313 (25.0%)
307 (24.8%)
333 (27.1%)
430 (35.8%)
MAPE 26.7% 24.6% 26.9% 27.6% 29.5% 27.3% 49.9% 76.5%
In the case of the MAPE error, the values are already higher than they appear in the literature, they still do not cross a threshold that would justify the inaccuracy of the method and the reaggregated database. In Deng and Wu's study (2013), 18.49 and 9.98 percent, Zhang and Qiu (2011) have 9.8 percent (mean: 5784) the lowest MAPE error. Although for the latter study, the RMSE error was a multiple of the value what we calculated (1639-2760). Based on these, it can be stated that the method used in the research estimated the proportion of voters in the target units with sufficient accuracy, the difference was not significantly large, and even shows better values in the case of RMSE errors. It is also necessary to validate the distribution of subsequent elections (2014 and 2018) with lower-level data from the 2021 census.
Based on the descriptive statistics of the developed database (Table 2), it can be stated that it meets the micro-scale criteria and largely retained the order of precinct-level. On the average, the units contain 1200-1300 voters, and the standard deviation does not exceed 650 in either case. This means that the 50 percent of the units are in the 580 to 2000 range. In addition, the median takes on a lower value than the average, so it is increased by only a few extreme values, so the unit with many voters in the database is not significant. However, units with few voters also skew MAPE values, so this may be the explanation for the higher MAPE values.
Table 2.
Descriptive statistics of the voter numbers of the database in each election results.
1990 1994 1998 2002 2006 2010 2014 2018
Number of source zones
1504 1628 1626 1612 1598 1605 1483 1410
N 1100 1100 1100 1100 1100 1100 1100 1100
Minimum 0 6 5 87 89 111 71 44
Maximum 4614 4076 4083 4179 4196 4907 5071 5694
Mean 1363.2 1346.1 1345.7 1253.7 1253.6 1237.4 1229.7 1202.8
Median 1197 1181.5 1181.5 1099 1098.5 1066.5 1033 1025
Std.dev. 707.7 643.3 643.4 560.8 560.1 563.3 559.1 611.3
4.2. The spatiality of the voter turnout in Budapest
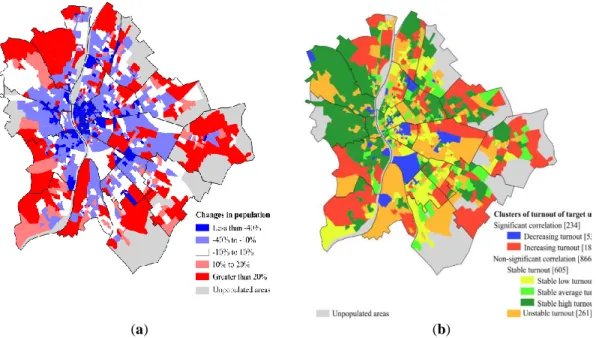
The spatial characteristics of temporal change of voter turnout in Budapest show a complex structure, which is related to several social processes (Fig. 4 (b)). The inner suburbs are characterized by steadily increasing voter turnout since 1990, these low-rise areas surrounded the city (except for the west) have growing population. In contrast, less units have declining voter turnout and they are scattered within the city in the downtown and the transition zone (the large area of former socialist industry between the city center and the inner suburbs mainly in the southern and the southeastern part). The explanation of declining turnout can be connected to the local conflicts such as the gentrification and studentification of sliding-down areas (Fabula et al., 2017) or the rehabilitation of former industrial zones with significant population change. These latter areas are also characterized by unstable and stable low turnout levels, it suggests the mixed population of rapid transforming urban areas are politically less active than the traditional posh districts. The most affluent areas of the city can be characterized with the stable high voter turnout, they are the Buda villa district and similar areas of Pest side in Zugló.
(a) (b)
Fig. 4. The spatial structure of population change between 1990 and 2018 (a) and voter turnout and its temporality (b) in Budapest.
5. CONCLUSIONS
The research had two interrelated contributions. On the one hand, the development of an areal interpolation method, which can be used to combine databases (for cross-analysis) that contain any kind of spatially aggregated and with a proportion of social subgroups but inconsistent with each other (Comber & Zeng, 2019). The area-based and dasymetric point allocation interpolation uses the principles of simple areal weighting and dasymetric mapping methods (Mennis, 2009), but simplifies them for a simple point allocation problem (Zhang & Qiu, 2011).
Based on this, the points represent the each individual (people in census, voter in elections), which contains the attributes characteristic of the given area unit in the form of the probability. In this way, the attribute data of any area can be deduced from the sum of the variables of the points falling on that part of the space. With this method, any of the above-mentioned databases (social data in a census tract or election data in a precinct, etc.) can be reaggregated using a population-adjusted allocation of points. For this, the polygons of census tracts and large housing estate buildings were used to specify the micro-level eligible voter numbers of the precincts.
On the other hand, micro-scale analysis of election results serves an appropriate indicator of socio-demographic processes of the rapid transformation inside a diverse metropolitan area (Charney
& Malkinson, 2015). It has advantage in the inter-census periods, in the 30 years, there were only three censuses (the fourth will be on 2021), but eight parliamentary elections, these latter provides the opportunity for a sophisticated spatio-statistical analysis of a rapidly transforming city. To demonstrate this, the concept of spatiality of voter turnout was used. The spatial and temporal variation of voter turnout is an indicator of other social phenomena, such as local cohesion, trust in institutions (primarily the institution of elections) (Putnam, 1995), or the influence to the decision- making mechanism (Lijphart, 1997).
Our results showed that, there is higher voter turnout in areas with growing population (namely in inner suburbs), suggesting that not necessarily the former local population is more involved in political issues, but rather the new residents (in this case the young middle class). In contrast, the scattered voter turnout in the downtown areas connected to the socio-spatial characteristics of the micro-areas (e.g. local conflicts). In units with high social status, voter turnout is stable high, which (considering the previous statements) reproduces the existing social differences.
Future research could build on precinct-level party election results which can provide information on other aspects of social transformation. Moreover, analysis of social indicators in level of census tracts provides additional statistically significant and so far hidden relationships between social and political processes.
ACKNOWLEDGMENTS
This research was supported by the UNKP-20-3-SZTE-536 New National Excellence Program of the Ministry for Innovation and Technology from the source of the National Research, Development and Innovation Fund and the UNKP 20391-3/2018/FEKUSTRAT project of the Ministry of Human Capacities.
R E F E R E N C E S
Amos, B., McDonald, M.P. & Watkins, R. (2017) When Boundaries Collide. Public Opinion Quarterly. [Online]
81, 385–400. Available from: doi:10.1093/poq/nfx001.
Charney, I. & Malkinson, D. (2015) Between electoral and urban geography: Voting patterns and socio-spatial dynamics in Tel Aviv. Applied Geography. [Online] 58, 1–6. Available from:
doi:10.1016/j.apgeog.2015.01.002.
Comber, A. & Zeng, W. (2019) Spatial interpolation using areal features: A review of methods and opportunities using new forms of data with coded illustrations. Geography Compass. [Online] 13 (10), e12465.
Available from: doi:10.1111/gec3.12465.
Deng, C. & Wu, C. (2013) Improving Small-Area Population Estimation: An Integrated Geographic and Demographic Approach. Annals of the Association of American Geographers. [Online] 103 (5), 1123–
1141. Available from: doi:10.1080/00045608.2013.770364.
Eicher, C.L. & Brewer, C.A. (2001) Dasymetric mapping and areal interpolation: Implementation and evaluation.
Cartography and Geographic Information Science. [Online] 28 (2), 125–138. Available from:
doi:10.1559/152304001782173727.
Fabula, S., Boros, L., Kovács, Z., Horváth, D., et al. (2017) Studentification, diversity and social cohesion in post-socialist Budapest. Hungarian Geographical Bulletin. [Online] 66 (2), 157–173. Available from:
doi:10.15201/hungeobull.66.2.5.
Fisher, P.F. & Langford, M. (1996) Modeling sensitivity to accuracy in classified imagery: A study of areal interpolation by dasymetric mapping. Professional Geographer. [Online] 48 (3), 299–309. Available from: doi:10.1111/j.0033-0124.1996.00299.x.
Flowerdew, R. & Green, M. (1992) Developments in areal interpolation methods and GIS. The Annals of Regional Science. [Online] 26 (1), 67–78. Available from: doi:10.1007/BF01581481.
Goodchild, M.F., Anselin, L. & Deichmann, U. (1993) A framework for the areal interpolation of socioeconomic data. Environment & Planning A. [Online] 25 (3), 383–397. Available from: doi:10.1068/a250383.
Goodchild, M.F. & Lam, N.S.-N. (1980) Areal interpolation: a variant of the traditional spatial problem. Geo- Processing. 1 (3), 297–312.
Kim, H. & Yao, X. (2010) Pycnophylactic interpolation revisited: Integration with the dasymetric-mapping method. International Journal of Remote Sensing. [Online] 31 (21), 5657–5671. Available from:
doi:10.1080/01431161.2010.496805.
Kostadinova, T. (2003) Voter turnout dynamics in post-Communist Europe. European Journal of Political Research. [Online] 42 (6), 741–759. Available from: doi:10.1111/1475-6765.00102.
Kovács, Z. & Vida, G. (2015) Geography of the new electoral system and changing voting patterns in Hungary.
Acta Geobalcanica. [Online] 1 (2), 55–64. Available from: doi:10.18509/agb.2015.06.
Lam, N.S.-N. (2009) Spatial Interpolation. In: International Encyclopedia of Human Geography. [Online].
Elsevier. pp. 369–376. Available from: doi:10.1016/B978-008044910-4.00530-7.
Lam, N.S.-N. (1983) Spatial interpolation methods: A review. American Cartographer. [Online] 10 (2), 129–
150. Available from: doi:10.1559/152304083783914958.
Langford, M. (2013) An evaluation of small area population estimation techniques using open access ancillary data. Geographical Analysis. [Online] 45 (3), 324–344. Available from: doi:10.1111/gean.12012.
Langford, M. (2006) Obtaining population estimates in non-census reporting zones: An evaluation of the 3-class dasymetric method. Computers, Environment and Urban Systems. [Online] 30 (2), 161–180. Available from: doi:10.1016/j.compenvurbsys.2004.07.001.
Langford, M., Maguire, D.J. & Unwin, D.J. (1991) The areal interpolation problem: estimating population using remote sensing in a GIS framework. In: Ian Masser & Michael Blakemore (eds.). Handling Geographical Information: Methodology and Potential Applications. London, Longman Pub Group. pp. 55–77.
Lijphart, A. (1997) Unequal Participation: Democracy’s Unresolved Dilemma Presidential Address, American Political Science Association, 1996. American Political Science Review. [Online] 91 (1), 1–14. Available from: doi:10.2307/2952255.
Liu, X.H. & Martinez, A. (2019) Areal interpolation using parcel and census data in highly developed urban environments. ISPRS International Journal of Geo-Information. [Online] 8 (7), 302. Available from:
doi:10.3390/ijgi8070302.
Mennis, J. (2009) Dasymetric Mapping for Estimating Population in Small Areas. Geography Compass. [Online]
3 (2), 727–745. Available from: doi:10.1111/j.1749-8198.2009.00220.x.
Mennis, J. (2003) Generating Surface Models of Population Using Dasymetric Mapping. Professional Geographer. [Online] 55 (1), 31–42. Available from: doi:10.1111/0033-0124.10042.
Michener, J.D. (2017) People, Places, Power: Medicaid Concentration and Local Political Participation. Journal of Health Politics, Policy and Law. [Online] 42 (5), 865–900. Available from: doi:10.1215/03616878- 3940468.
Monteiro, J., Martins, B., Murrieta-Flores, P. & Moura Pires, J.M. (2019) Spatial Disaggregation of Historical Census Data Leveraging Multiple Sources of Ancillary Information. ISPRS International Journal of Geo- Information. [Online] 8 (8), 327. Available from: doi:10.3390/ijgi8080327.
Pavía, J.M. & Cantarino, I. (2017) Dasymetric distribution of votes in a dense city. Applied Geography. [Online]
86, 22–31. Available from: doi:10.1016/j.apgeog.2017.06.021.
Putnam, R.D. (1995) Bowling Alone: America’s Declining Social Capital. Journal of Democracy. [Online] 6 (1), 65–78. Available from: doi:10.1353/jod.1995.0002.
Putnam, R.D. (2000) Bowling Alone: The Collapse and Revival of American Community. New York, Simon &
Schuster.
Szabó, B. & Bene, M. (2019) Housing estates of Budapest before and after the renovation programmes (Budapesti lakótelepek a panelprogram előtt és után). Területi Statisztika. [Online] 59 (5), 526–554.
Available from: doi:10.15196/TS590504.
Vida, G. (2016) Possibilities for measuring electoral geographical factors, that create unequal political representation (Az egyenlőtlen politikai reprezentációt létrehozó választási földrajzi hatótényezők mérési lehetőségei). Területi Statisztika. [Online] 56 (6), 643–659. Available from: doi:10.15196/TS560603.
Walford, N.S. & Hayles, K.N. (2012) Thirty Years of Geographical (In)consistency in the British Population Census: Steps towards the Harmonisation of Small-Area Census Geography. Population, Space and Place.
[Online] 18 (3), 295–313. Available from: doi:10.1002/psp.658.
Wong, D.W.S. (2004) The Modifiable Areal Unit Problem (MAUP). In: WorldMinds: Geographical Perspectives on 100 Problems. [Online]. Dordrecht, Springer Netherlands. pp. 571–575. Available from:
doi:10.1007/978-1-4020-2352-1_93.
Wright, J.K. (1936) A Method of Mapping Densities of Population: with Cape Cod as an Example. Geographical Review. 26 (1), 103–110.
Zhang, C. & Qiu, F. (2011) A Point-Based Intelligent approach to Areal interpolation. The Professional Geographer. [Online] 63 (2), 262–276. Available from: doi:10.1080/00330124.2010.547792.
Zoraghein, H., Leyk, S., Ruther, M. & Buttenfield, B.P. (2016) Exploiting temporal information in parcel data to refine small area population estimates. Computers, Environment and Urban Systems. [Online] 58, 19–
28. Available from: doi:10.1016/j.compenvurbsys.2016.03.004.