Volume 28 2021 Number 1
Volume 27 2020 Number 2
Gilda BERRUTI* , Maria Federica PALESTINO*
WASTELANDS AS AN OPPORTUNITY FOR MANAGING NAPLES’ SUSTAINABLE TRANSITION
Abstract. Circular economy offers new visions of how diversely urban spaces could be inhabited and managed. While the generation and management of waste is being treated through innovative practices, disused industrial, rural, and infrastructural areas are resistant to becoming included in a closed-loop cycle. They, in fact, establish wastelands that need to be completely re-imagined as a precondition for the transition. The fact of shifting the definition of a ’neglected area’into a ‘waste- land’, in line with the metaphor of urban metabolism, could be of tactical importance for generating alternative policies and practices. In exploring how the transition impacts Naples’ urban region, the paper argues that turning wastelands into resources has the double potential of rehabilitating spaces and challenging the governance model in use, overcoming barriers in multiple sectors.
Key words: wastescape regeneration, multilevel governance, waste circularity, transition management.
1. INTRODUCTION
Circular economy, one of the pillars of sustainable transitions promoted by the EU, suggests new visions of how people should live in urban space and, conse- quently, how it should be managed. The roots of such mostly conceptual visions are strongly dependent on the powerful metaphor of urban metabolism. It helps not only in the imaging and organising of strategies for the transition process,
*Gilda BERRUTI, Maria Federica PALESTINO, University of Naples Federico II, Department of Architecture, via Forno Vecchio 36, 80134 Naples, Italy; e-mails: gberruti@unina.it, palestin@uni- na.it, ORCIDs: https://orcid.org/0000-0003-1777-4793, https://orcid.org/0000-0002-3709-3728
https://doi.org/10.18778/1231-1952.27.2.03
© by the author, licensee Łódź University – Łódź University Press, Łódź, Poland. This article is an open access article distributed under the terms and conditions of the Creative Commons Attribution license CC-BY-NC-ND 4.0 (https://creativecommons.org/licenses/by-nc-nd/4.0/)
https://doi.org/10.18778/1231-1952.28.1.17
Csaba LAKÓCAI *
THE ROLE OF LOCATION IN THE FUNCTIONING OF A LOCAL CURRENCY: LA GONETTE CASE STUDY
Abstract. The beginning of the 21st century was a proliferation of complementary currencies world- wide. Among them, a number of newly created local currencies were notable. France proved to be especially fertile in this regard from the early 2010s. La Gonette, operating in the metropolitan area of Lyon, is one of the biggest French local complementary currencies in terms of its users, providers (business partners), and money supply. For every scheme, the most important issue, which is also a challenge, is to provide enough spending options to be attractive for users, while also retaining their particular sociocultural identity. Besides a variety of spending options, their location features are also important in regards to future development, so decision-makers of a scheme can diversify the business expansion strategy accordingly in order to better achieve the desired socio-economic goals. Using la Gonette as a case study, the research objective of this paper is to uncover the implications of the pro- viders’ location on the functioning of the scheme. To address this objective, I applied statistical tests for correspondence on the providers’ categorical and locational breakdowns. The results have shown het- erogeneity in the spatial distribution of the types of providers in accordance with broader location char- acteristics, a fact which supports the need for territorial diversification of future development concepts.
Key words: local complementary currencies, la Gonette, France, location features.
1. INTRODUCTION
Since its creation in 2015, la Gonette, operating in the metropolitan area of Lyon, has become one of the biggest local complementary currencies in France based on the number of its users, providers (businesses which accept the cur-
* Csaba LAKÓCAI, Centre for Economic and Regional Studies, Institute of World Economics, Tóth Kálmán utca 4., 1097 Budapest, Hungary; e-mail: lakocai.csaba@krtk.hu; University of Pécs, Hun- gary: e-mail: lakocai.csaba@ktk.pte.hu, ORCID: https://orcid.org/0000-0003-3572-9152.
rency), and money supply. Local currencies are complementary monetary as- sets used within a particular geographic territory of participating individuals, businesses, and organisations, with the aim of boosting local economy and/or addressing social and environmental objectives at the local level by connecting underused resources with demand (Rivero Santos, 2017). In many cases, such as in Argentina during the late 1990s and the beginning of the new millennium, local currencies are a community response to economic crises and globalisation (Gómez and Helmsing, 2007; Blanc and Fare, 2013; Cohen, 2017). However, their payment function is limited on purpose. They do not replace but rather complement legal tender, i.e. the official money of a country (Kennedy et al., 2012). In France, local currencies are required to be backed by the same amount of euro (at parity exchange rate), which is put into reserve accounts by the as- sociation that coordinates the project (Blanc and Fare, 2018).1 La Gonette is part of the country-wide local currency network, called the “MLCC network”2, which is an informal grouping of local currencies launched as citizen initiatives.
(Similar schemes launched by local governments or merchant associations may not be members of this network.)
Local currencies, as complementary assets, can imply a better cash flow once they become accepted sufficiently by users and providers. In the case of the Bristol Pound in England, a survey was launched among its users and mu- nicipality employees who had signed up to receive their salary partly in the local currency (NEF, 2015). Most of them (67%) reported that they started to visit local shops they had never visited before because they accepted the Bristol Pound. Despite that, most of them continued to visit the shops they used to be- fore the introduction of the local currency scheme and continued to spend both Bristol Pound and sterling more in those shops. However, a study by Johnson and Harvey-Wilson (2018) has found that it is hard to say whether the Bristol Pound really changed the users’ shopping habits. In practice, the real reason behind the use of this local currency is cultural and ideological, i.e. local iden- tity and the need to be ethical and behave sustainably are the main motivations for users, without necessarily wanting to change their overall consumption pat- terns. In order to achieve the desired economic impact, a scheme must provide various and diversified spending options while retaining its ethical values, as well as local and cultural identity, which is challenging (Blanc and Fare, 2016).
Therefore, two key issues are how much a local currency is accepted as a tool of payment, and what types of providers accept it. Nonetheless, a high number of participating businesses does not guarantee any economic impact in itself,
1 For the relevant legal and regulatory framework on the local complementary currencies, see the 2014 law on social and solidarity economy: LOI n°2014-856 du 31 juillet 2014 – art. 1, v. init.
2 ‘MLCC’ stands for monnaies locales complémentaires citoyennes (local complementary citizens’
currencies).
as Marshall and O’Neill (2018) have found. Based on their case study of the Bristol Pound it appeared that political institutional changes were necessary for altering the economy in the long run, and local currencies in themselves were ineffective tools for localisation. Nevertheless, local currencies can be benefi- cial in facilitating exchanges during recessions, as well as for fostering social capital.
In France, charters have a major role in the selection criteria of providers (Blanc and Fare, 2016). Apart from ethical values, e.g. fair-trade, proximities are also im- portant. There are several forms of proximity, such as geographical, institutional, and social (Blanc and Fare, 2016; Torre, 2018). Rivero Santos (2017) has argued that local social currencies can increase both physical and relational proximity by promoting short food supply chains. His argument is based on a case study of the Spanish scheme and a network of barter communities called RASTRU.
Bland and Lakócai (2020) have concluded, after analysing the French local currencies, that a broader socio-economic context of territorial conditions in- fluences the spatial distribution of schemes. This paper examines the physical/
geographical proximity of different kinds of providers. The main motivation is the assumption that when a local currency scheme seeks new business partners, the locational context of certain types of providers is worth considering. Every scheme is different, and the same applies to territories, therefore, it is advisable to examine local currencies separately in the form of case studies. The topic of this current study is la Gonette, the French local currency scheme of the Lyon agglomeration.
La Gonette, similarly to the Bristol Pound, could reach a significant number of users and providers by the end of 2019. The solid increase in money supply since its creation implies that its usage has reached the threshold value, which is necessary for a local currency scheme to survive. The launching of the digital payment option by la Gonette on 30th November 2019 may have further extend- ed the money supply in the future. Additionally, the increase in the number of accepting partners from the initial 39 business entities in 2015 to 296 business entities by November 2019 was spectacular.3 From that point on, the interest- ing question has been whether la Gonette would have any impact on the local economy. To answer that, one of the key indicators is the variety of the types of providers. Their spatial distribution is also interesting as the breakdown may contain relevant information about the diverseness of spending options at dif- ferent locations. It means that different expansion strategies are recommended to be followed at different locations (municipalities, districts, or neighbour- hoods) of the operation area of the scheme because such diversification may result in more regular exchanges of the local currency compared to a lack of diversification. In other words, more acceptance of the local currency can be
3 The data was provided by Charlotte Perring from the La Gonette Association in November 2019.
expected by linking development concepts to the existing local socio-economic conditions if new business partners are sought according to the basic locational features.
Subject literature affirms that district and neighbourhood characteristics signif- icantly influence the location decisions of a certain type of entrepreneurs (Smit, 2011). This paper analyses the relationship between the diversity of providers and their location as of the end of 2019. The research objective is to indicate the exist- ence or lack of a statistically significant association between these dimensions in order to answer the question to what extent it can affect the dynamics of the usage of la Gonette. The assumption is that the more heterogeneous the territorial distri- bution of providers is, in accordance with the urban socio-economic conditions, the greater acceptance can be achieved. This assumption is based on the statement by Torre (2018) that geographical proximity and ‘organised’ proximity interact with each other.
Although the operational area of la Gonette is the whole metropolitan area of Lyon (and a little bit beyond that), I have focussed my research mainly, but not exclusively, on the city of Lyon as most of the economic activities are concen- trated here. The next part describes the applied methodology and the data used for the analyses. Then, the following section shows the statistics and the urban socio-economic context within a district, municipality and neighbourhood break- down. Finally, the conclusion part summarises the topic of the paper, including broader implications for future research.
2. METHODOLOGY AND DATA
So far, a few papers about local currencies have investigated any hard data. Didier (2020) examined the socioeconomic profile of the users of Florain, the local cur- rency scheme in Nancy, by applying a multiple correspondence analysis based on survey data. He identified four clusters: social activists, gentrifiers, simple users, and culturally committed users. The methodological approach could be relevant for further case studies.
This paper investigates the relation between the type and location of la Gonette business partners in the hope of presenting another new perspective to the liter- ature. In order to analyse the association between these variables quantitatively, I shall apply tests of independence. Quantitative analyses in themselves cannot offer sufficient explanations as to the existence or lack of association. Therefore, a qualitative interpretation of statistical data, which is in the focus of the paper, is indispensable. Units under observation are territories such as the municipalities, districts and neighbourhoods of the Lyon agglomeration.
The approach assumed in this paper is unique in the literature on local cur- rencies. Another publication by Guillaume and Lung (2019), dealing with local currencies operating in the Nouvelle-Aquitaine region of France, has provided an interesting statistical comparison about the category breakdown of the different kinds of the providers of certain schemes. However, their paper did not raise the associational relationship between the types of providers and location within the operation area of a local currency scheme.
The data about business partners is partly from the la Gonette website and partly it was provided by Charlotte Perring from the La Gonette Association in November 2019. Further data about LVED (“Lyon, Ville Equitable et Durable”) business partners, presented below, is from a Lyon municipality brochure pub- lished in December 2019.
3. SPENDING OPTIONS WITH LA GONETTE AS PER LOCATION
Lyon is the third largest city and, with its agglomeration, the second largest urban area of France. The agglomeration has 1.3 million residents while the function- al urban area of Lyon includes nearly 2 million inhabitants. It is located in the region of Auvergne-Rhȏne-Alpes and the department of Rhȏne. The Lyon ag- glomeration, called Métropole de Lyon in French, has had a jurisdiction as both a department and a métropole since 2015, and it is often discussed independently from the rest of Rhȏne in statistical reports and literature. The agglomeration of Lyon is characterised by relatively high employment in the service sector (23%), compared to (the rest of) Rhȏne where industrialisation is more significant (Lahi, 2009). Nevertheless, industry is still an important part of the local economy with a 12% share in employment. Administration, education, healthcare and social care represent the biggest employment sector (29% of total employment) in the Lyon agglomeration (Reynaud and Simon, 2016). Compared to other European urban areas of the same size, the Lyon agglomeration is distinctive for its youth, with 140,000 students. Between 2006 and 2012, the outer parts of the city of Lyon had the most dynamic overall population growth in the agglomeration (ibid) .
Since the 1982 law on the local administration of Paris, Marseille and Lyon was passed, these cities of France have consisted of directly elected district municipalities besides city municipal councils4. The districts have informal inner territorial units of neighbourhoods (quartiers in French), which are often mentioned in urban planning sources and literature. The actual division of neighbourhoods can be changed by the district municipalities over time. Fig. 1 shows the nine districts of Lyon.
4 See: https://www.legifrance.gouv.fr/affichTexte.do?cidTexte=JORFTEXT000000880033
Fig. 1. Map of Lyon districts Source: own work.
The following parts of the study discuss the location of la Gonette partners in respect of the agglomeration’s municipalities, Lyon’s districts and neighbour- hoods. The main assumption behind this research is that the analysis of the lo- cation of the local currency partners brings a new aspect in dealing with local currencies, as well as urban economics, and sociology.
3.1. Districts and municipalities
La Gonette’s website offers an interactive map of the places where users can spend their local currency.5 The legends on this map distinguish different kinds of pro- viders by their icons according to categories in which the partners of the scheme are classified. In order to simplify the handling of these categories, I merged them into four main categories. Table 1 shows how the that has been implemented.
5 See: http://www.lagonette.org/
Table 1. Merged categories of la Gonette providers into main categories
Categories of providers Main categories
restaurants, bars, catering
catering and food trade grocery shops
agricultural products crafts trade
non-food commercial providers clothing
cosmetics
stationery, bookstores, press, publishing decorations, furnishing, DIY, gardening other shops
cultural outings
culture and leisure provides sport and leisure
education, training computer, electronics
other service providers web, multimedia, communication, printing
health and well-being repair
transport, delivery accommodation personal services business services other
Source: own work based on la Gonette’s website.
The other dimension of the analysis is the locational breakdown. First, I com- pared the distribution according to the administrational units of the districts.
Lyon has 9 districts. Table 2 shows the distribution of providers according to the districts and their main categories, both in absolute numbers and as percentages.
It is important to mention that in Table 2 I considered only the network partners that functioned as permanent accepting places and excluded places that occa- sionally accepted la Gonette, such as casual markets of producers. Furthermore, whenever providers belonged to more than one category, I chose to classify them under the most suitable one according to their main profile based on their websites.
Table 2. Distribution of providers according to their districts and categories in Lyon
District
Providers Catering and
food trade
Non-food commercial
providers
Culture and leisure
provides
Other
providers Overall
1 18 8 8 6
45% 20% 20% 15% 40
2 3 1 1 5
30% 10% 10% 50% 10
3 10 6 7 11
29% 18% 21% 32% 34
4 8 6 2 6
36% 27% 9% 27% 22
5 3 3 2 0
37,5% 37,5% 25% 0% 8
6 7 0 0 6
54% 0% 0% 46% 13
7 18 6 3 11
47% 16% 8% 29% 38
8 3 2 1 3
33% 22% 11% 33% 9
9 5 0 2 4
45% 0% 18% 36% 11
Overall 75 32 26 52 185
41% 17% 14% 28%
Source: own work.
Table 2 shows that the percentage shares of main categories in most districts did not differ much from the overall percentage shares. Based on the Chi-square test, shown in Appendix 1, there was no significant relationship between the lo- cation and the share of different kinds of providers. In other words, the district where the providers were located did not influence the distribution of the type of providers. In this regard, the category breakdown of providers was homogeneous.
The same was true for the whole metropolitan area (see Appendix 2). Outside Lyon, catering and food trade providers represented 34%, non-food commercial providers represented 11%, culture and leisure providers represented 21%, and other providers represented 34% of the overall 104 providers.
Even though there was no statistically significant relationship between the districts and the category breakdown, it is worth interpreting the numbers from a qualitative approach. Overall, catering and food trade represented the largest category of providers. This is understandable as many food products might easily be produced locally and, among a certain group of consumers, there is a definite demand for local foods. Behind this, different types of service providers such as accounting, IT services, personalised coaching, therapeutic services, non-profits, etc. were the second most important group of acceptors. Indeed, in post-industrial societies, the tertiary sector is the biggest economic sector, and some service pro- viders have distinct local profiles that facilitate the acceptance of the local curren- cy among them. There were less non-food commercial providers, as well as the culture and leisure activity providers than there were the previous ones. However, they were sufficient to provide spending options for users in need of their products or services.
Within the city of Lyon, most of the providers were located in districts 1, 3 and 7. According to Maury and Gilbert (2016), district 3 is characterised by the tertiary sector, while district 7 is the most oriented toward local businesses. The numbers in Table 2 seem to agree with this statement. Furthermore, they correlate in general with Rolland’s (2014) figure about the location of different kinds of business labelled “Lyon, Ville Equitable et Durable” or LVED, based on data from January 2014. This certificate, provided by the municipality, is given to business- es for fair trade and eco-conscious operation within the whole agglomeration of Lyon.6 The office of the la Gonette association has retained this label since 2018.
As for district 1, the fact that it is the headquarters of la Gonette might have a role in the high number of acceptors found there. Besides, this district has un- dergone spectacular socioeconomic changes and a sort of gentrification over the past 40 years from a population of mainly poor and underqualified inhabitants to higher qualified intellectual citizens (Maury and Gilbert, 2016). Based on empiri- cal research on the US population, Collom (2005) has shown that highly educated people are generally more open to social innovations, such as local currencies.
Didier (2020) has found that the share of more educated people among the users of Florain in the French city of Nancy is relatively high, but they are not necessarily the most active users. In this regard, political, social, and ecological engagements, with a strong affinity to localism, are more important factors than education. One might assume that this statement is relevant for la Gonette, too; in district 7, where businesses are generally the most locally oriented, spending with the local curren- cy was more regular than in district 1. However, we do not have explicit data so far to prove this assumption.7
6 However, the criteria and the way of providing this label are sometimes questionable (Rolland, 2014).
7 However, the increasing use of the digital payment will probably provide us with such data in the coming years.
In the agglomeration outside the city of Lyon, the relatively higher share of culture and social service providers (compared to the city of Lyon) can be ex- plained by the highest share of associations dealing with educational and social issues as employers within the non-profit sector in respect of the whole metropol- itan area (Bouchpan et al., 2014) .
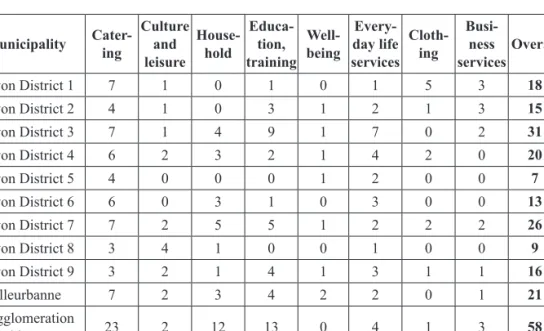
The above-mentioned correlation between la Gonette acceptors and LVED partners can be analysed statistically. Indeed, there is an overlap. Based on the data as of the end of 2019, 38 businesses were identified as members of both networks. Table 3 shows the breakdown of LVED-labelled businesses according to their categories and the municipalities where they were located. Villeurbanne, which is often referred to unofficially as the 10th district of Lyon, is displayed separately from the rest of the agglomeration municipalities outside Lyon. This is justified by the high number of labelled businesses there. The table includes only partners with permanent addresses, i.e. online business partners are excluded. The breakdown of LVED partners shows some similarity with the breakdown of la Gonette partners, however, this is not straightforward.
Table 3. Distribution of LVED partners according to their location
Municipality Cater- ing
Culture leisureand
House- hold
Educa- tion, training
Well- being
Every- day life services
Cloth- ing
Busi- ness
servicesOverall
Lyon District 1 7 1 0 1 0 1 5 3 18
Lyon District 2 4 1 0 3 1 2 1 3 15
Lyon District 3 7 1 4 9 1 7 0 2 31
Lyon District 4 6 2 3 2 1 4 2 0 20
Lyon District 5 4 0 0 0 1 2 0 0 7
Lyon District 6 6 0 3 1 0 3 0 0 13
Lyon District 7 7 2 5 5 1 2 2 2 26
Lyon District 8 3 4 1 0 0 1 0 0 9
Lyon District 9 3 2 1 4 1 3 1 1 16
Villeurbanne 7 2 3 4 2 2 0 1 21
Agglomeration
outside Lyon 23 2 12 13 0 4 1 3 58
Overall 77 17 32 42 8 31 12 15 234
Source: Lyon municipality brochure about the LVED partners published in December 2019.
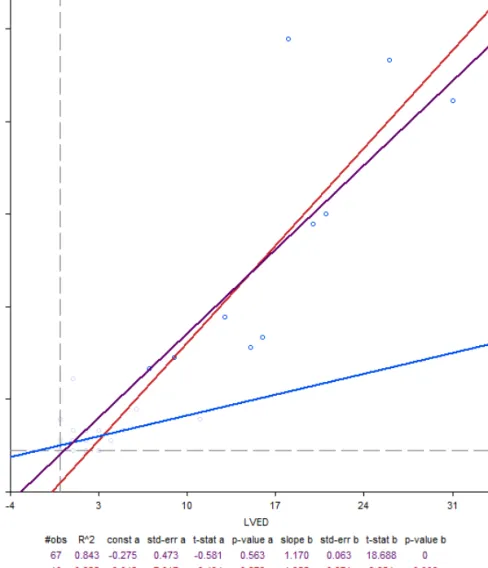
Among the district and agglomeration municipalities, there is a strong and sta- tistically significant correlation between the number of local currency acceptors
and LVED-labelled businesses, which is shown in Fig. 2. Furthermore, the corre- lation within the 9 districts of Lyon and Villeurbanne is statistically different from the rest of the agglomeration, based on the Chow test. The results have confirmed the nexus of the two local business networks.
Fig. 2. Correlation between the number of la Gonette and LVED partner businesses among the dis- tricts and community municipalities in the Lyon agglomeration (Notes: in purple: correlation within the whole agglomeration; in red: correlation in Lyon districts; in blue: correlation in the municipal-
ities outside Lyon) Source: own work.
So far, I have considered the locations according to districts and community municipalities. In the next part, I shall approach the issue of location in smaller territorial breakdowns.
3.2. Neighbourhoods
While districts, as subdivisions of city municipalities, are administrative units, neighbourhoods are informal territorial units organised on the basis of actual in- ner urban conditions. For this reason, neighbourhoods are often mentioned in the literature as the ideal territories of urban planning and development (Yigitcanlar et al., 2015; Neilagh, Ghafourian, 2018; Ortega-Momtequín et al., 2021) .
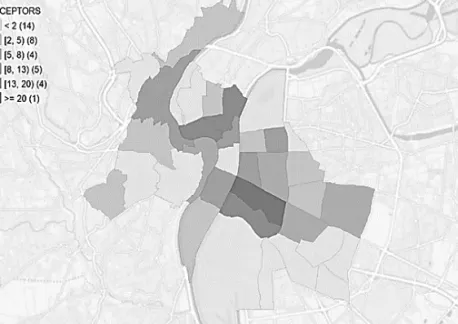
Within Lyon, there is also a need to go deeper into districts and look at neigh- bourhoods, too, as districts themselves are heterogeneous enough in their social conditions as well as the distribution of providers. The map in Fig. 3 shows a clas- sification of neighbourhoods according to the number of acceptors. I classified the neighbourhoods into six clusters in order to compare them with another classifi- cation by Balouzat et al. (2019), which analysed the demographic dynamics and urban development from the 1980s. This study classified the neighbourhoods into six clusters according to the following typology:
– G1: urban transformation and strong population growth.
– G2: constant and popular family profile.
– G3: rejuvenation and gentrification.
– G4: low dynamics, aging population.
– G5: rejuvenation, low urban development.
– G6: from aging population toward a more familial profile8 .
Table 4, as a contingency table, shows a breakdown of neighbourhoods ac- cording to the two classifications. In both cases, neighbourhoods belonging to the same district can be diverse. Even though there is no statistically significant asso- ciation between the two classifications, based on the Chi-square test (Appendix 3) some qualitative statements can be articulated.
Three neighbourhoods, namely Pentes de la Croix-Rousse, Guillotière, and Jean Macé, having the highest number of providers, belonged to the group G3, which is characterised by rejuvenation and “gentrification”. Guillotière and Jean Macé are located in district 7 while Pentes de la Croix-Rousse is in district 1. The fact that local currencies are not dedicated necessarily to the wealthiest population implies that there is no direct relationship between the sociodemographic condi- tion of these neighbourhoods and the number of acceptors. Most probably, the reason behind the high number of providers could be that these neighbourhoods have witnessed considerable public investments and infrastructural development
8 Author’s translation from French.
since the 1980s (Balouzat et al., 2019), making them more attractive for business- es. Besides, they are centrally located or easily accessible by public transport.
Those neighbourhoods where there are no providers or there is only one were located mainly around the periphery of the city. They belonged to all kinds of clusters apart from G3, and all of the districts apart from district 1 and 3. Neigh- bourhoods with more than one but no more than a dozen of providers were also heterogeneous according to their social profile.
Fig. 3. Classification of the neighbourhoods of Lyon according to the number of providers Source: own work.
Table 4. Distribution of the neighbourhoods of Lyon according to demographic typology and the number of providers
Typology Number of providers
0-1 2-4 5-7 8-12 13-19 >20
G1 5 2 2 1 0 0
G2 4 1 0 0 0 0
G3 0 0 1 0 2 1
G4 2 3 0 0 1 0
G5 2 1 1 4 1 0
G6 1 1 0 0 0 0
Source: own work based on Balouzat et al. (2019) and la Gonette’s website.
To get a more sophisticated picture of the locational distribution of providers, we might go even deeper past the level of neighbourhoods. The website of the central statistical office of France called INSEE (Institut national de statistique et des études économique) provides some basic demographic data on building blocks (squares). Based on Balouzat and Simon’s study (2017) about urban seg- regation, the concentration of the wealthy and the poor populations is quite high in a building block breakdown, which is partly hidden in a neighbourhood break- down. Once their findings are compared, presented on a map of Lyon consisting of squares (blocks), with the location of la Gonette acceptors, one can see that many of the providers were located in blocks, which were characterised as the residence of population with mainly low revenue. It would be interesting to analyse the relationship between the providers’ location and the residents’ financial situation in a squared territorial breakdown. However, such detailed dataset is not at our disposal so far.9
4. CONCLUSION
Literature dealing with local currencies occasionally works with hard data and the analysis of spatiality is even rarer. The author’s intention here is to compensate that deficiency, as well as to show the relevance of the topic for the broader urban sociological context. This study discussed the features of la Gonette as the local currency of the Lyon metropolitan area, in terms of providers and their location.
This approach brings a new aspect in approaching local currencies, as well as the socio-spatial dynamics of their urban environment.
Based on the quantitative analysis we can conclude that location does not deter- mine the type of providers, neither is the number of providers related to the basic characteristics of the neighbourhoods where they operate. However, taking a rather qualitative look at the numbers, one can notice some implications. The profiles of the districts where the number of acceptors is the highest is associated with the most common types of providers within them. It might be advisable for la Gonette practitioners to consider these locational specificities in further development of the scheme as such territorial diversification of business expansion strategy may result in greater acceptance of the local currency. Apart from districts and municipalities, the number of providers is interrelated with the social conditions also at the neigh- bourhood level, even though there is no direct interpretation of this relationship.
9 Marcon and Puech (2014) have argued and demonstrated that even more sophisticated and diverse results can be detected in distance-based continuous space. Indeed, it would be also interesting to analyse the providers’ location using distance-based spatial weights instead of any territorial break- down, however, it goes beyond the frame of the current study.
The findings are necessarily scale-dependent, therefore, the more detailed the territorial breakdown and the more sophisticated the data one has, the more rel- evant and more specific conclusions one achieves. The limitation of the current study resides in the availability of data. Further territorial research is encouraged accordingly as such kinds of analyses not only represent a new aspect of dealing with a local currency but they can also widen our knowledge about urban so- cio-spatial conditions.
Acknowledgements. TerMos (“Territorial dynamics of local currencies in the AURA region: construction, effectiveness, relevance, resilience”) research pro- gramme developed in the French region Auvergne-Rhône-Alpes on behalf of the research center Triangle.
REFERENCES
BALOUZAT, B. and SIMON, A. (2017), Ségrégation résidentielle par le revenu dans quatre grandes villes de la région : des quartiers souvent marqués socialement, INSEE, 30.
BALOUZAT, B., GEYMOND, J. and BERTRAND, P. (2019), Quartiers de Lyon : de profondes mutations en 30 ans, avec une forte dynamique à l’est, INSEE, 83.
BLANC, J. and FARE, M. (2013), ‘Understanding the Role of Governments and Administrations in the Implementation of Community and Complementary Currencies’, Annals of Public and Cooperative Economics, 1, pp. 63–81. https://doi.org/10.1111/apce.12003
BLANC, J. and FARE, M. (2016), ‘Turning values concrete: the role and ways of business selection in local currency schemes’, Review of Social Economy, 74 (3), pp. 298–319. https://doi.org/10.
1080/00346764.2016.1168035
BLANC, J. and FARE, M. (2018), ‘Contrasted cases. Successes and failures of local currency schemes in France since 2010’, International Journal of Community Currency Research, 22 (1), pp. 60–73.
BLANC, J. and LAKOCAI, C. (2020), ‘Toward Spatial Analyses of Local Currencies: the case of France’, International Journal of Community Currency Research, 24 (1), pp. 11–29.
BOUCHPAN, L., BERTRAND, P., RECOULY, Y. and LAGARDE, T. (2014), Grand Lyon : les défis environnementaux et humains d’une forte attractivité, INSEE, 226.
COHEN, B. (2017), ‘The Rise of Alternative Currencies in Post-Capitalism’, Journal of Manage- ment Studies, 54 (5), pp. 739–746. https://doi.org/10.1111/joms.12245
COLLOM, E. (2005), ‘Community currency in the United States: the social environments in which it emerges and survives’, Environment and Planning A, 37 (9), pp. 1565–1587. https://doi.
org/10.1068/a37172
DIDIER, R . (2020), Le profil socioéconomique des utilisateurs de monnaies locales en France. Le cas particulier du Florain à Nancy, Document de Travail [Working Paper] n° 2020 – 49, Bureau d’Économie Théorique et Appliquée.
GÓMEZ, G. M. and HELMSING, A. H. J. (2007), ‘Selective Spatial Closure and Local Economic Development: What Do We Learn from the Argentine Local Currency Systems?’, World Devel- opment, 36 (11), pp. 2489–2511. https://doi.org/10.1016/j.worlddev.2007.11.015
GUILLAUME, A. and LUNG, Y. (2019), Les Monnaies Locales complémentaires en Nouvel- le-Aquitaine : un état des lieux, NOTE DE TRAVAIL MoLoNA n°1 – Novembre 2019, Maison des sciences de l’homme d’Aquitaine.
JOHNSON, S. and HARVEY-WILSON, H. (2018), ‘Local currency adoption and use: insight from a realist evaluation of the Bristol Pound’, Bath Papers in Internation Development and Wellbe- ing, 56 .
KENNEDY, M., LIETAER, B. and ROGERS, J. (2012), People Money. The Promise of Regional Currencies, Axminster.
LAHI, F. (2019), Rhȏne et Métropole de Lyon : deux territoires moteurs de l’emploi regional, INSEE, 62.
MARCON, É. and PUECH, F. (2014), ‘Mesures de la concentration spatiale en espace continu:
théorie et applications’, Économie et Statistique, 474, pp. 105–131. https://doi.org/10.3406/es- tat.2014.10514
MARSHALL, A. P. and O’NEILL, D. (2018), ‘The Bristol Pound: A Tool for Localisation?’, Eco- logical Economics, 146, pp. 273–281. https://doi.org/10.1016/j.ecolecon.2017.11.002
MAURY, S. and GILBERT, A. (2016), Les arrondissements de Lyon: de profondes mutations so- cio-économiques en 40 ans, INSEE, 29.
NEILAGH, Z. M. and GHAFOURIAN, M. (2018), ‘Evaluation of Social Sustainability in Residen- tial Neighborhoods’, European Journal of Sustainable Development, 7 (1), pp. 209–217. https://
doi.org/10.14207/ejsd.2018.v7n1p209
New Economics Foundation (NEF) (2015), Money with a purpose. Community currencies achieving social, environmental and economic impact, http://b.3cdn.net/nefoundation/ff- 0740cad32550d916_o1m6byac6.pdf
ORTEGA-MOMTEQUIN, M., RUBIERA-MOROLLON, F. and PEREZ-GLADISH, M. (2021),
‘Ranking residential locations based on neighborhood sustainability and family profile’, Interna- tional Journal of Sustainable Development & World Ecology, 28 (1), pp. 49–63 . https://doi.org/
10.1080/13504509.2020.1778581
REYNAUD, J-P. and SIMON, A. (2016), Lyon, une agglomeration de dimension européenne, INSEE, 23.
RIVERO SANTOS, A. M. (2017), ‘Contributions of Social Currencies to Alternative Short Food Supply Chains’, Urban Agriculture & Regional Food Systems, 2 (1), pp. 1–15 . https://doi.
org/10.2134/urbanag2016.07.0005
ROLLAND, L. (2014), ‘Commerce équitable et politiques urbaines de développement durable’, Géoconfluences. http://geoconfluences.ens-lyon.fr/informations-scientifiques/dossiers-thema- tiques/developpement-durable-approches-geographiques/articles-scientifiques/commerce-equi- table-et-politiques-urbaines-de-developpement-durable
SMIT, A. J. (2011), ‘The Influence of District Visual Quality on Location Decisions of Creative Entrepreneurs’, Journal of the American Planning Association, 77 (2), pp. 167–184. https://doi.
org/10.1080/01944363.2011.567924
TORRE, A. (2018), ‘Développement territorial et relations de proximité’, Revue d’Économie Ré- gionale & Urbaine, 5–6, pp. 1043–1075. https://doi.org/10.3917/reru.185.1043
YIGITCANLAR, T., KAMRUZZAMAN, Md. and TERIMAN S. (2015), ‘Neighborhood Sustaina- bility Assessment: Evaluating Residential Development Sustainability in a Developing Country Context’, Sustainability, 7 (3), pp. 2570–2602. https://doi.org/10.3390/su7032570
APPENDIX 1.
Test of independence between the main types of providers and their districts within Lyon
Chi-square (Observed value) 25,525 Chi-square (Critical value) 36,415
DF 24
p-value 0 .378
alpha 0 .05
APPENDIX 2.
Test of independence between the main types of providers and their location according to their location in Lyon or in its surrounding agglomeration
Chi-square (Observed value) 4,980 Chi-square (Critical value) 7,815
DF 3
p-value 0 .173
alpha 0 .05
APPENDIX 3.
Test of independence between the breakdowns of Lyon neighbourhoods ac- cording to the number of providers and their demographic dynamics based on Balouzat et al. (2019)
Chi-square (Observed value) 35,870 Chi-square (Critical value) 37,652
DF 25
p-value 0 .074
alpha 0 .05